


To estimate the prevalence of obesity and overweight in children and adolescents in our city and to investigate the associated factors.
Subjects and methodsA cross-sectional study of 1317 children and adolescents aged 2–16 years was done. Multistage probability sampling was used to select three groups of subjects: 411 aged 12–16 years, 504 aged 6–12 years, and 402 aged 2–6 years. Body mass index was calculated, and obesity and overweight were diagnosed using the threshold levels of the International Obesity Task Force for children and adolescents. Parents were asked about eating habits, health, social, and demographic aspects. Results are given as percentages (95% confidence interval). The relationship between obesity and overweight and the different variables was studied using multiple logistic regression. The adjusted odds ratio (OR) was calculated.
ResultsAmong children and adolescents aged 2–16 years, 9.5% (8.0–11.0%) were obese and 22.4% (23.3–24.6%) were overweight. Of subjects aged 12–16 years, 8.5% (5.9–11.2%) were obese and 20.5% (16.7–24.3%) were overweight. In the groups aged 6–12 years and 2–6 years, rates of obesity and overweight were 11.6% (8.9–14.3%) and 31.0% (27.0–35.0) and 8.0% (5.4–10.6%) and 13.6% (10.3–16.9%), respectively. Obesity or overweight was associated to age (OR 1.21; p<0.001), maternal obesity (OR 10.99; p=0.008), a birthweight higher than 4kg (OR 2.91; p=0.002), and formula feeding (OR 1.82; p=0.005).
ConclusionObesity and overweight in children and adolescents are highly prevalent problems in our city.
Calcular la prevalencia de obesidad y sobrepeso en niños y adolescentes de nuestra ciudad e investigar los factores asociados.
Sujetos y métodosEstudio transversal de 1.317 niños y adolescentes de 2 a 16 años. Mediante muestreo probabilístico polietápico se seleccionaron 3 grupos: 411 de 12 a 16, 504 de 6 a 12 y 402 de 2 a 6 años. Se les calculó el índice de masa corporal y se definió obesidad y sobrepeso según la International Obesity Task Force. Se realizó un cuestionario de consumo de alimentos y de características clínicas y sociodemográficas. Los resultados se expresan como porcentajes (intervalos de confianza al 95%). Mediante regresión logística múltiple se estudió la asociación entre exceso de peso (obesidad y sobrepeso) y las distintas variables, calculando la odds ratio (OR) ajustada.
ResultadosEl 9,5% (8,0-11,0) de los niños y adolescentes de 2 a 16 años son obesos y 22,4% (23,3-24,6) tienen sobrepeso. En el grupo de 12 a 16 años, el 8,5% (5,9-11,2) son obesos y el 20,5% (16,7-24,3) tienen sobrepeso, en el grupo de 6 a 12 años el 11,6% (8,9-14,3) y el 31,0% (27,0-35,0) y en el de 2 a 6 años el 8,0% (5,4-10,6) y el 13,6% (10,3-16,9), respectivamente. Se asocian con el exceso de peso la edad (OR 1,21; p<0,001), la obesidad materna (OR 10,99; p=0,008), el peso al nacer mayor de 4kg (OR 2,91; p=0,002) y la lactancia artificial exclusiva (OR 1,82; p=0,005).
ConclusiónLa obesidad y el sobrepeso infantil y juvenil son problemas extraordinariamente prevalentes en nuestra ciudad.
Obesity in children and adolescents is a significant health problem for both the present and the future of the individuals concerned. The present problem is that important complications such as metabolic syndrome and respiratory (sleep apnea syndrome, asthma, hypoventilation), gastrointestinal (cholelithiasis, liver steatosis), endocrine (early puberty), orthopedic, psychological, and social problems already occur at these ages.1 The problems for the future include that obese children have an 80% chance of still being obese at 35 years2 and that metabolic syndrome predisposes to cardiovascular disease and diabetes at a later age.3,4
The worldwide prevalence of infantile and juvenile obesity has progressively increased in recent decades, from 4.2% in 1990 to 6.7% in 2010.5 Since 1998, the World Health Organization has considered obesity to be a global epidemic1 which not only affects developed countries. In 2010, 43 million children (35 million in developing countries) were overweight or obese, and 92 million were considered at risk of overweight.5 An increased prevalence has also been noted in Spain.6,7
Our study objectives were to estimate the prevalence of obesity and overweight in children and adolescents from the city of Almeria (Andalusia) and to investigate the associated factors.
Subjects and methodsAn observational, cross-sectional, epidemiological study was conducted on a population sample. The study was conducted in Almeria on all children aged 2–16 years living in this city.
The accessible population was obtained from two sources, the health district and the education office. Children aged two to four years were taken from the list provided by the Almeria health district, recording all children living in Almeria for screening for hypothyroidism and phenylketonuria. This population is virtually the same as the target population. The district has nine primary care centers. The cohort of children born from January 2003 to December 2004 consisted of 5343 children. For children older than four years, the accessible population consisted of all children attending school as of November 2004 at the 44 public and 26 state-assisted and private centers providing nursery (4 and 5 years) and primary (6–12 years) education, and at the 18 public and 10 state-assisted and private secondary education centers (12–16 years) in the city of Almeria. The total population consisted of 17,934 children aged 4–12 years and 9823 aged 12–16 years.
Multistage probability sampling was performed. The primary units were the primary care centers of the health district and nursery, primary, and secondary education centers. Four healthcare centers, six nursery and primary education centers (four public and two private), and six secondary education centers (four public and two private) were randomly selected. Three classrooms from each school year were subsequently selected, and all pupils in the selected classrooms were invited to participate in the study. Assuming a 30% prevalence of excess weight, a 95% confidence level, and a 6% precision, the minimum sample size required was 215 children aged 2–6 years, 221 aged 6–12 years, and 219 aged 12–16 years. Five hundred and fifty subjects from each group were selected in anticipation that many subjects would refuse to participate in the study.
Inclusion criteria were residence in Almeria, age ranging from 2 to 16 years, and informed consent from parents or guardians and from children older than 12 years. Chronic diseases were considered exclusion criteria.
Anthropometric and physical examination data were collected from the subjects. Weight was recorded in light clothes and without shoes as the mean of two measurements using a digital Seca 861 scale with a 100g precision, and height was recorded as the mean of two measurements to the nearest millimeter taken with a stadiometer coupled to the scale with the child in an upright position. Body mass index (BMI, weight/squared height) was calculated. Signs of start of puberty (testes at least 4mL in size in boys and breast bud in girls) were examined.
The parents of children in the 2–4 age group were interviewed face to face (at the examination visit of the child) and by telephone in all other groups. They were asked about sociodemographic and dietary variables and personal and family history.
Field work was done from September 2007 to June 2010. The interviewers and examiners were all physicians who had followed a prior program of training and criteria standardization. Agreement between them was assessed, and a coefficient of agreement of 0.90 was found.
Obesity and overweight were defined according to the international thresholds for children and adolescents proposed by the International Obesity Task Force,8 and excess weight was defined as including both.
SPSS version 17.0 software was used for statistical analysis, and Epidat 3.0 software was used for sample calculation. In descriptive statistics, qualitative variables are given as percentages and confidence intervals (95% CI), and quantitative variables are given as mean (95% CI)±standard deviation. To study the association between excess weight (the dichotomous dependent variable) and clinical, sociodemographic, and dietary variables, multiple logistic regression was used quantifying the association with the odds ratio (OR) and its 95% CI. A value of p<0.05 was considered statistically significant.
The study was conducted in compliance with the rules of the Declaration of Helsinki of 1975 and was approved by the research and ethics committees of Torrecárdenas Hospital.
ResultsA total of 1317 children and adolescents (402 aged 2–6 years, 504 aged 6–12 years, and 411 aged 12–16 years) participated in the study. Three hundred and thirty-three subjects, 20.2% of those invited, refused to participate. Higher refusal rates were found in the youngest (26.9%) and oldest (25.3%) groups as compared to the intermediate age group (8.4%), but there were no differences by sex, ethnic origin, or geographic area of the healthcare or educational institutions.
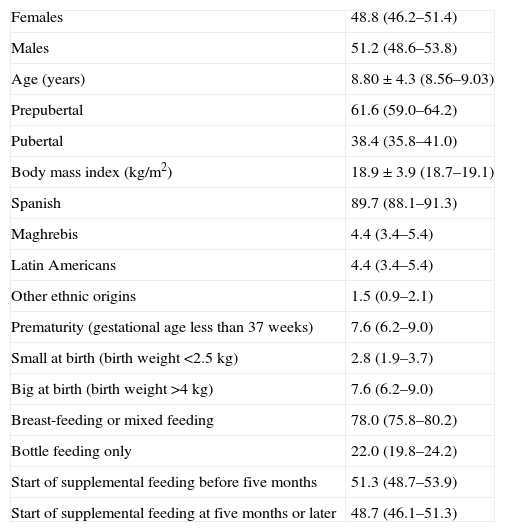
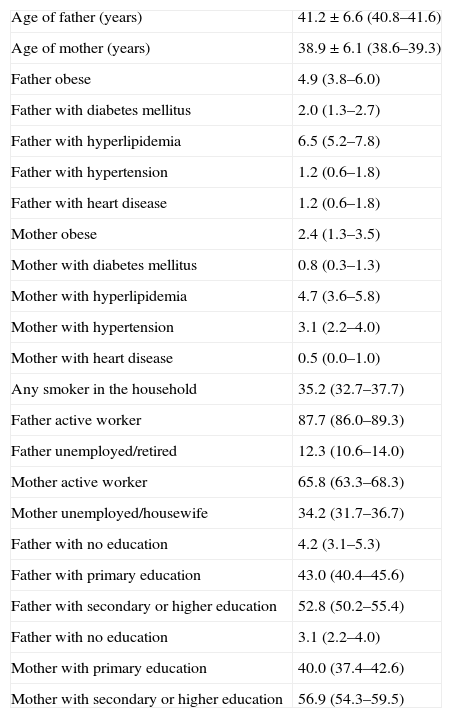
Tables 1–3 provide a detailed description of the sample. Almeria is a city which in recent years has received an important immigrant population (10.3% of children in the city belong to families coming from other countries, mainly from the Maghreb and Latin America). The city has a significant unemployment rate (only 87.7% of fathers and 65.8% of mothers state that they are active workers), and the proportion of parents with no education has decreased (4.2% of fathers and 3.1% of mothers).
Sample description.
| Females | 48.8 (46.2–51.4) |
| Males | 51.2 (48.6–53.8) |
| Age (years) | 8.80±4.3 (8.56–9.03) |
| Prepubertal | 61.6 (59.0–64.2) |
| Pubertal | 38.4 (35.8–41.0) |
| Body mass index (kg/m2) | 18.9±3.9 (18.7–19.1) |
| Spanish | 89.7 (88.1–91.3) |
| Maghrebis | 4.4 (3.4–5.4) |
| Latin Americans | 4.4 (3.4–5.4) |
| Other ethnic origins | 1.5 (0.9–2.1) |
| Prematurity (gestational age less than 37 weeks) | 7.6 (6.2–9.0) |
| Small at birth (birth weight <2.5kg) | 2.8 (1.9–3.7) |
| Big at birth (birth weight >4kg) | 7.6 (6.2–9.0) |
| Breast-feeding or mixed feeding | 78.0 (75.8–80.2) |
| Bottle feeding only | 22.0 (19.8–24.2) |
| Start of supplemental feeding before five months | 51.3 (48.7–53.9) |
| Start of supplemental feeding at five months or later | 48.7 (46.1–51.3) |
Qualitative variables are given as percentage and 95% confidence interval, and quantitative variables as mean±standard deviation and 95% confidence interval of the mean.
Sample description: parent data collected in the questionnaires.
| Age of father (years) | 41.2±6.6 (40.8–41.6) |
| Age of mother (years) | 38.9±6.1 (38.6–39.3) |
| Father obese | 4.9 (3.8–6.0) |
| Father with diabetes mellitus | 2.0 (1.3–2.7) |
| Father with hyperlipidemia | 6.5 (5.2–7.8) |
| Father with hypertension | 1.2 (0.6–1.8) |
| Father with heart disease | 1.2 (0.6–1.8) |
| Mother obese | 2.4 (1.3–3.5) |
| Mother with diabetes mellitus | 0.8 (0.3–1.3) |
| Mother with hyperlipidemia | 4.7 (3.6–5.8) |
| Mother with hypertension | 3.1 (2.2–4.0) |
| Mother with heart disease | 0.5 (0.0–1.0) |
| Any smoker in the household | 35.2 (32.7–37.7) |
| Father active worker | 87.7 (86.0–89.3) |
| Father unemployed/retired | 12.3 (10.6–14.0) |
| Mother active worker | 65.8 (63.3–68.3) |
| Mother unemployed/housewife | 34.2 (31.7–36.7) |
| Father with no education | 4.2 (3.1–5.3) |
| Father with primary education | 43.0 (40.4–45.6) |
| Father with secondary or higher education | 52.8 (50.2–55.4) |
| Father with no education | 3.1 (2.2–4.0) |
| Mother with primary education | 40.0 (37.4–42.6) |
| Mother with secondary or higher education | 56.9 (54.3–59.5) |
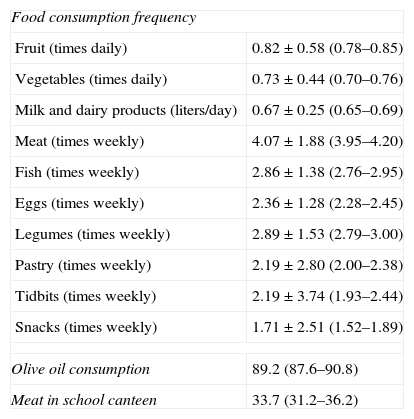
Sample description.
| Food consumption frequency | |
| Fruit (times daily) | 0.82±0.58 (0.78–0.85) |
| Vegetables (times daily) | 0.73±0.44 (0.70–0.76) |
| Milk and dairy products (liters/day) | 0.67±0.25 (0.65–0.69) |
| Meat (times weekly) | 4.07±1.88 (3.95–4.20) |
| Fish (times weekly) | 2.86±1.38 (2.76–2.95) |
| Eggs (times weekly) | 2.36±1.28 (2.28–2.45) |
| Legumes (times weekly) | 2.89±1.53 (2.79–3.00) |
| Pastry (times weekly) | 2.19±2.80 (2.00–2.38) |
| Tidbits (times weekly) | 2.19±3.74 (1.93–2.44) |
| Snacks (times weekly) | 1.71±2.51 (1.52–1.89) |
| Olive oil consumption | 89.2 (87.6–90.8) |
| Meat in school canteen | 33.7 (31.2–36.2) |
Dietary variables. Qualitative variables are given as percentage and 95% confidence interval, and quantitative variables as mean±standard deviation and 95% confidence interval of the mean.
As regards dietary habits (Table 3), our young had diets highly deficient in fruit, vegetables, fish, eggs, and legumes, adequate in dairy products, and with an excess of unnecessary items (pastries, tidbits, and salty snacks). The vast majority of families (89.2%) said they cooked with olive oil, and one-third of children ate at school canteens. Seventy-eight percent of children had been breastfed, but only 37.6% for longer than three months, and 51.3% had started supplemental feeding before their fifth month of life.
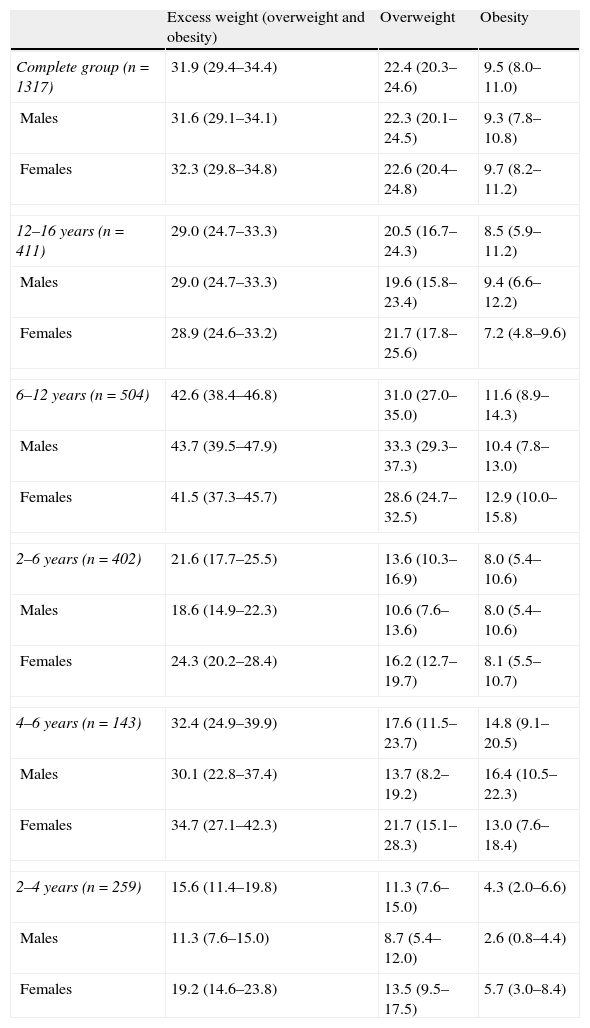
Excess weight was found in 31.9% of Almeria's children; of these, 8.5% were obese and 22.4% were overweight. Table 4 shows the prevalence of obesity, overweight, and excess weight in each age and sex group and the corresponding 95% CIs. No significant differences were seen between males and females in the overall group or in any age subgroup, with excess weight being found in 31.6% of males and 32.3% of females (p=0.96). Age group differences were however found, with higher prevalence rates in the group aged 6–12 years and lower prevalence rates in children aged 2–6 years (p<0.001). In the youngest group, a significant difference was seen between the two age subgroups, with lower prevalence rates in children aged 2–4 years (p<0.001).
Prevalence (and its 95% confidence interval) of excess weight, obesity, and overweight in the population aged 2–16 years and in each sex and age group.
| Excess weight (overweight and obesity) | Overweight | Obesity | |
| Complete group (n=1317) | 31.9 (29.4–34.4) | 22.4 (20.3–24.6) | 9.5 (8.0–11.0) |
| Males | 31.6 (29.1–34.1) | 22.3 (20.1–24.5) | 9.3 (7.8–10.8) |
| Females | 32.3 (29.8–34.8) | 22.6 (20.4–24.8) | 9.7 (8.2–11.2) |
| 12–16 years (n=411) | 29.0 (24.7–33.3) | 20.5 (16.7–24.3) | 8.5 (5.9–11.2) |
| Males | 29.0 (24.7–33.3) | 19.6 (15.8–23.4) | 9.4 (6.6–12.2) |
| Females | 28.9 (24.6–33.2) | 21.7 (17.8–25.6) | 7.2 (4.8–9.6) |
| 6–12 years (n=504) | 42.6 (38.4–46.8) | 31.0 (27.0–35.0) | 11.6 (8.9–14.3) |
| Males | 43.7 (39.5–47.9) | 33.3 (29.3–37.3) | 10.4 (7.8–13.0) |
| Females | 41.5 (37.3–45.7) | 28.6 (24.7–32.5) | 12.9 (10.0–15.8) |
| 2–6 years (n=402) | 21.6 (17.7–25.5) | 13.6 (10.3–16.9) | 8.0 (5.4–10.6) |
| Males | 18.6 (14.9–22.3) | 10.6 (7.6–13.6) | 8.0 (5.4–10.6) |
| Females | 24.3 (20.2–28.4) | 16.2 (12.7–19.7) | 8.1 (5.5–10.7) |
| 4–6 years (n=143) | 32.4 (24.9–39.9) | 17.6 (11.5–23.7) | 14.8 (9.1–20.5) |
| Males | 30.1 (22.8–37.4) | 13.7 (8.2–19.2) | 16.4 (10.5–22.3) |
| Females | 34.7 (27.1–42.3) | 21.7 (15.1–28.3) | 13.0 (7.6–18.4) |
| 2–4 years (n=259) | 15.6 (11.4–19.8) | 11.3 (7.6–15.0) | 4.3 (2.0–6.6) |
| Males | 11.3 (7.6–15.0) | 8.7 (5.4–12.0) | 2.6 (0.8–4.4) |
| Females | 19.2 (14.6–23.8) | 13.5 (9.5–17.5) | 5.7 (3.0–8.4) |
Variables predicting for excess weight (obesity and overweight) in both children and adolescents were age (OR 1.21 [1.11–1.32]; p<0.001), maternal obesity (OR 10.99 [1.87–64.5]; p=0.008), birth weight greater than 4kg (OR 2.91 [1.46–5.80]; p=0.002), and a history of bottle feeding only (OR 1.82 [1.20–2.78]; p=0.005). All other variables tested were not significantly related to excess weight.
DiscussionExcess weight is a highly prevalent problem in children and adolescents in Almeria, occurring in up to 31% of them. Its prevalence is very similar to that reported in adults in our region, 28.8%.9
The diversity of diagnostic criteria for overweight and obesity in children and adolescents represents a problem as regards comparing our results to those reported in other pediatric populations. Agreement currently exists in that overweight and obesity should be defined based on the BMI.1 The problem lies in establishing the BMI thresholds separating normal from pathological states. If the upper percentiles of the charts of each country are used, comparisons are not possible.
In an attempt to unify criteria worldwide, the International Obesity Task Force (IOTF) was able to combine data from almost 200,000 children and adolescents by pooling six national studies from various continents, and designing centile curves for each study which crossed 25 and 30kg/m2, the limits for the diagnosis of overweight and obesity in adults, at the age of 18 years. The six curves were averaged to obtain specific cut-off points for each sex and age that defined obesity and overweight in childhood and adolescence and ensured the comparability of the data from the different populations.8
Following these IOTF criteria, the Spanish EnKid study, conducted from 1998 to 2000 on 3534 children and young aged 2–24 years from all Spanish communities, reported prevalence rates of obesity and overweight of 6.3% and 18.1%, respectively.10,11 A larger study of 7659 children recently conducted (in 2010–2011) in Spain, restricted to children aged 6–10 years, found similar prevalence rates and concluded that the problem had stabilized, i.e. had not continued to increase, in the last decade.12 Similar frequencies have been reported in countries with the same development level as ours,13,14 such as Portugal and France.15,16 Prevalence rates are of course different in less developed countries, where they are not so high.17–20
The EnKid study reported a North-South gradient, finding the highest rates of excess weight in Andalusia and the Canary Islands.10,11 More recent studies conducted on schoolchildren only in other regions in Central and North Spain support this gradient concept and report lower prevalence rates than ours in this age group: approximately 20% overweight and 8% obesity.21–23
Although children aged 6–12 years are the most affected, excess weight rates in children under 6 years of age are not negligible, and should lead us to reflect on the rapid occurrence of an acquired disease and the need for very early intervention. Thanks to these interventional measures, studies have not reported increases in prevalence in the past decade, but rather a stabilization of prevalence,12,24 while rates have already begun decreasing in pre-school children from some European countries over the past five years.25–27 It remains to be shown whether prevalence rates may also be decreasing in older children, so overcoming the trend to excess weight during childhood.
In the abovementioned national EnKid study, obesity was more prevalent in males (except in those aged 2–5 years), in children with high birth weight breastfed for less than three months, in families with a lower socioeconomic level and a lower educational level of the mother, and in urban areas.11 Other authors have also concluded that excess weight is greater the lower the income.12,22,28,29 High birth weight and bottle feeding were also risk factors in our study, but the educational level of the parents was not a statistically significant protective factor. No differences were found either between sexes or racial minorities. In a multiethnic society such as ours, it would be of great interest to design a study with adequate power to show differences between these subpopulations and their evolution over generations.
As regards dietary habits, recognized protective factors include the consumption of fruit and vegetables and a high-energy breakfast, and risk factors include the consumption of sugary drinks, pastries, and snacks.11 We could not show any of these relations, undoubtedly because the methodology used, a direct questionnaire completed by the physician him/herself, is not the most reliable way of recording the actual behavior of the population.
Obesity and overweight in children and adolescents are highly prevalent problems in Almeria. Excess weight is related to age (although it already has a non-negligible frequency at pre-school age), maternal obesity, high birth weight, and a history of bottle feeding only. This may possibly be the leading health problem at pediatric ages, and its quantification makes strategies to control this epidemic imperative.
Conflicts of interestThe authors state that they have no conflicts of interest.
Please cite this article as: García García E, et al. Prevalencia de sobrepeso y obesidad en niños y adolescentes de 2 a 16 años. Endocrinol Nutr. 2013;60:121–6.
This study was awarded a grant from the Department of Health of the Andalusian regional government (PI 0427/2007).
