


Insulin pump therapy associated with continuous glucose monitoring has shown a positive clinical impact on diabetes control and reduction of hypoglycemia episodes. There are descriptions of the performance of this device in other populations, but its precision and accuracy in Colombia and Latin America are unknown, especially in the routine outpatient setting.
MethodsData from 33 type 1 and type 2 diabetes patients with sensor-augmented pump therapy with threshold suspend automation, MiniMed Paradigm® Veo™ (Medtronic, Northridge, California), managed at Hospital Universitario San Ignacio (Bogotá, Colombia) and receiving outpatient treatment, were analyzed. Simultaneous data from continuous glucose monitoring and capillary blood glucose were compared, and their precision and accuracy were calculating with different methods, including Clarke error grid.
ResultsAnalyses included 2262 continuous glucose monitoring-reference paired glucose values. A mean absolute relative difference of 20.1% was found for all measurements, with a value higher than 23% for glucose levels ≤75mg/dL. Global compliance with the ISO criteria was 64.9%. It was higher for values >75mg/dl (68.3%, 1308 of 1916 readings), than for those ≤75mg/dl (49.4%, 171 of 346 readings). Clinical accuracy, as assessed by the Clarke error grid, showed that 91.77% of data were within the A and B zones (75.6% in hypoglycemia).
ConclusionsA good numerical accuracy was found for continuous glucose monitoring in normo and hyperglycemia situations, with low precision in hypoglycemia. The clinical accuracy of the device was adequate, with no significant safety concerns for patients.
La terapia con bomba de insulina asociada a monitorización continua de glucosa ha demostrado tener un impacto clínico positivo en el control de la diabetes y en la reducción de los episodios de hipoglucemia. Aunque existen descripciones del rendimiento del dispositivo en otras poblaciones, se desconoce su desempeño en Colombia y Latinoamérica en el contexto de la terapia ambulatoria usual.
MétodosSe analizaron los registros de 33 pacientes con diabetes mellitus tipo 1 y 2 en terapia con monitorización continua de glucosa integrada al infusor de insulina con suspensión automática en hipoglucemia (MiniMed Paradigm® Veo™) utilizando el Sensor Sof-Sensor™ (Medtronic, Northridge, California) manejados en el Hospital Universitario San Ignacio (Bogotá, Colombia) y que venían recibiendo tratamiento ambulatorio. Se compararon datos simultáneos provenientes de glucometría capilar y monitorización continua de glucosa, calculando su validez por diferentes técnicas, incluyendo un análisis clínico utilizando la gradilla de error de Clarke.
ResultadosBasados en 2.262 datos pareados se encontró una media de la diferencia absoluta relativa para todas las mediciones del 20,1%, siendo mayor a 23% en las mediciones ≤75mg/dl. El cumplimiento global de los criterios ISO fue de 64,9%, siendo mejor en las mediciones >75mg/dl (68,3%, 1.308 de 1.916 lecturas), que en aquellas ≤ 75mg/dl (49,4%, 171 de 346 lecturas). El porcentaje combinado en zonas A y B de la gradilla de error de Clarke fue del 91,77% (75,6% para hipoglucemia).
ConclusionesSe observó un buen desempeño numérico para las determinaciones intersticiales en situaciones de normo- e hiperglucemia, persistiendo poca precisión en el rango de hipoglucemia. La precisión clínica del dispositivo es adecuada, sin comprometer de forma significativa la seguridad de los pacientes.
Different clinical studies have shown the benefits of treatment intensification in diabetes mellitus, which slows the start or progression of complications associated to diabetes.1–5 However, the costs of improved metabolic control was the occurrence of three times more episodes of hypoglycemia in the intensive versus the conventional management groups. This makes hypoglycemia and fear of hypoglycemia the main limiting factors for achieving significant HbA1c reductions.2–4 Development of continuous glucose monitoring (CGM) systems and their integration into insulin pump therapy, also known as sensor-augmented pump therapy (SAP), is aimed at reducing this risk, especially in the event of unaware episodes in which there is a risk of severe hypoglycemia with serious consequences.6 This tool becomes much more relevant considering that up to 57% of patients with hypoglycemia may be unaware of it.7,8
Precision of CGM depends on conditions such as glucose balance between interstitial fluid, plasma, and whole blood, and there is a lag time for glucose diffusion from plasma to interstitial fluid.9–11 During rapid changes in glucose concentrations, interstitial measurements may give discordant values (higher or lower) when compared to venous plasma levels. In addition, the devices have a trend to a lower precision in the lower glucose range (<70mg/dL or 3.9mmol/L).12–15 Recently developed monitoring devices include the Sof-sensor (Medtronic, Northridge, CA) and Enlite™ (Medtronic, Northridge, CA), which are integrated into insulin pumps with new calibration algorithms capable of incorporating other prior and future data in calculations of each glucose value. They are thus an approximation to “real time”, using an average regression model “smoothed” from the trend of measurement of interstitial blood glucose every 5minutes.16 With these improvements, new systems include the possibility of adjusting the threshold of alarms alerting users not only when the programmed levels are reached, but also when a predictive extrapolated value is about to reach the alert level at a pre-programmed time, as well as programming the function to stop insulin infusion when a set blood glucose value is reached (automated suspension on hypoglycemia).15,17–19
During daily hospital practice at Hospital Universitario San Ignacio, it was felt that precision of the CGM system in patients on SAP therapy could be lower than reported in international literature, and as no prior studies were available, formal evaluation through this study was decided. This is the first study conducted in Colombia and Latin America to assess the precision of the continuous glucose monitoring system integrated into the insulin infusion pump with automated suspension on hypoglycemia (MiniMed Paradigm® Veo™), using a Sof-Sensor™ (Medtronic, Northridge, CA) under conditions of daily living, rather than in a controlled study, to verify the therapy in the “real world”.
MethodsThe study was conducted on 33 outpatients with diabetes on SAP, trained and managed at the Endocrinology Unit of Hospital Universitario San Ignacio. Informed consent was obtained from patients at study entry. The study was approved by the ethics committee of the institution.
Inclusion criteria were patients with type 1 and 2 diabetes mellitus managed with an insulin infusion pump with integrated continuous glucose monitoring with automated suspension on hypoglycemia, MiniMed Paradigm® Veo™ (Medtronic Inc, Northridge, CA). The device should have been used for three months before study entry, regardless of HbA1c value of presence of microvascular or macrovascular complications. Pregnant patients and records with less than two calibration glucose measurements and/or signal loss for longer than 12hours were excluded.
Patients used Sof-Sensor™ (Medtronic, Northridge, CA) CGM sensors for a total time of at least six days (range, 6–12 days) with intervals of use of each sensor of three days, as recommended by the manufacturer. Calibration was made using glucometers (Optium Xceed® and One touch®). Patients were instructed to calibrate the sensor three or four times daily, as this provides a better performance. On the first day, system calibration was advised at 2, 6, and 12hours. Three or four calibrations daily were recommended on the following days, provided glucose experienced no significant changes (such as after an insulin bolus, after a meal, during or after physical activity), during a hypoglycemic episode, or is the sensor screen showed one or two arrows indicating glucose elevation or decrease at a rate of 1–2mg/dL per minute or more than 2mg/dL per minute.
Patients were instructed to record capillary glucose measurements and simultaneous interstitial glucose values in writing, in an instrument designed for this purpose (with the categories of preprandial, postprandial, hyperglycemia, hypoglycemia, and automated suspension on hypoglycemia) which they should return at the end of follow-up.
Records were collected simultaneously collected from the instrument and by downloading information at Hospital Universitario San Ignacio from the device using CareLink Pro Version 3.0 software (Medtronic, Northridge, CA). No interventions other than the therapy being received by patients as part of their standard medical care were performed.
Statistical analysisThe difference between interstitial and capillary blood glucose values was analyzed using a Student's t test for means differences, comparing capillary blood glucose measured by the usual therapy device of each patient simultaneously to interstitial measurement by CGM (with an interval shorter than 5minutes between them) in different situations, including preprandial and postprandial measurements and during activation of hypoglycemia and hyperglycemia alarms, and automated suspension on hypoglycemia.
For analysis of numerical precision, the requirements of the International Organization for Standardization (ISO) for CGM were taken into account. Mean absolute relative difference (MARD) was calculated from the mean of arithmetic differences between interstitial and capillary values ([capillary−interstitial blood glucose/capillary blood glucose]×100) for paired data in the different clinical settings of hyperglycemia (blood glucose higher than 180mg/dL), hypoglycemia (blood glucose less than 70mg/dL with or without symptoms) and automated suspension on hypoglycemia (activation programmed for each patient, usually at less than 55mg/dL). Compliance was similarly assessed based on ISO criteria by a positive or negative variation by 15mg/dL when blood glucose value was ≤75mg/dL and by 20% when it was ≥75mg/dL.14,17 Mean capillary and interstitial blood glucose values and P value were calculated with a Student's t test using MedCalc® version 11.5.1.0 (MedCalc Software, Ostend, Belgium).
Clinical precision was estimated using Clarke error grid analysis as recommended by different guidelines.14,19,20 For this evaluation, paired data were considered excluding values capillary blood glucose values >400mg/dL, because 400mg/dL is the upper detection limit of the CGM system. Data were classified according to regions in the plot; thus: A: interstitial values within 20% of the capillary blood glucose range; B: interstitial blood glucose values outside 20% of capillary blood glucose range but not leading to inadequate treatment; C: interstitial blood glucose values leading to unnecessary treatment; D: interstitial values suggesting a potentially dangerous failure to detect hypoglycemia or hyperglycemia; E: interstitial blood glucose values that would lead to confound management of hypoglycemia for management of hyperglycemia or vice versa.12,14,19,20 A specific Clarke error code was used for calculation with Matlab® Version 7.14.0.739 (MathworksInc, Natick, MA, USA).
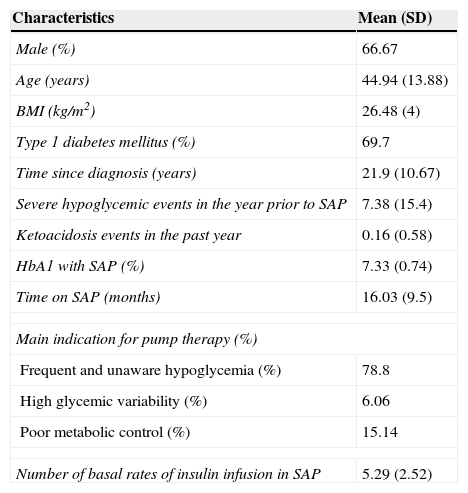
ResultsTable 1 shows the baseline characteristics of the 33 patients recruited into the study. A majority were male (66.7%) patients con long-standing type 1 diabetes mellitus (69.7%) who had been receiving treatment with insulin pump for more than one year. The main indication for treatment was the occurrence of frequent and unaware hypoglycemia (78.8%). The 10 patients with type 2 diabetes had characteristics slightly different from those found in patients with type 1 diabetes; specifically, a greater proportion of males (80%) and higher mean age (58.3±3.39 years). The most common indication for the pump was poor metabolic control (60%). Mean HbA1c levels and rate of prior hypoglycemic episodes were similar in both patient subgroups.
General characteristics of patients (n=33).
| Characteristics | Mean (SD) |
|---|---|
| Male (%) | 66.67 |
| Age (years) | 44.94 (13.88) |
| BMI (kg/m2) | 26.48 (4) |
| Type 1 diabetes mellitus (%) | 69.7 |
| Time since diagnosis (years) | 21.9 (10.67) |
| Severe hypoglycemic events in the year prior to SAP | 7.38 (15.4) |
| Ketoacidosis events in the past year | 0.16 (0.58) |
| HbA1 with SAP (%) | 7.33 (0.74) |
| Time on SAP (months) | 16.03 (9.5) |
| Main indication for pump therapy (%) | |
| Frequent and unaware hypoglycemia (%) | 78.8 |
| High glycemic variability (%) | 6.06 |
| Poor metabolic control (%) | 15.14 |
| Number of basal rates of insulin infusion in SAP | 5.29 (2.52) |
SD: standard deviation; BMI: body mass index; SAP: sensor augmented pump therapy.
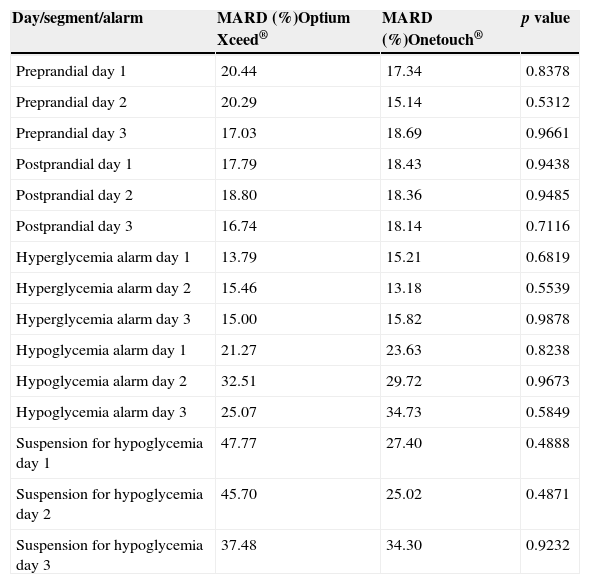
For the numerical analysis, 2.262 valid pairs of data were used. As two glucometers were used in the different patients (Optium Xceed® and One touch®), a differential analysis of MARD was made for each device, which found no significant differences (p=0.9531, Table 2).
MARD comparison by type of glucometer.
| Day/segment/alarm | MARD (%)Optium Xceed® | MARD (%)Onetouch® | p value |
|---|---|---|---|
| Preprandial day 1 | 20.44 | 17.34 | 0.8378 |
| Preprandial day 2 | 20.29 | 15.14 | 0.5312 |
| Preprandial day 3 | 17.03 | 18.69 | 0.9661 |
| Postprandial day 1 | 17.79 | 18.43 | 0.9438 |
| Postprandial day 2 | 18.80 | 18.36 | 0.9485 |
| Postprandial day 3 | 16.74 | 18.14 | 0.7116 |
| Hyperglycemia alarm day 1 | 13.79 | 15.21 | 0.6819 |
| Hyperglycemia alarm day 2 | 15.46 | 13.18 | 0.5539 |
| Hyperglycemia alarm day 3 | 15.00 | 15.82 | 0.9878 |
| Hypoglycemia alarm day 1 | 21.27 | 23.63 | 0.8238 |
| Hypoglycemia alarm day 2 | 32.51 | 29.72 | 0.9673 |
| Hypoglycemia alarm day 3 | 25.07 | 34.73 | 0.5849 |
| Suspension for hypoglycemia day 1 | 47.77 | 27.40 | 0.4888 |
| Suspension for hypoglycemia day 2 | 45.70 | 25.02 | 0.4871 |
| Suspension for hypoglycemia day 3 | 37.48 | 34.30 | 0.9232 |
MARD: mean absolute relative difference.
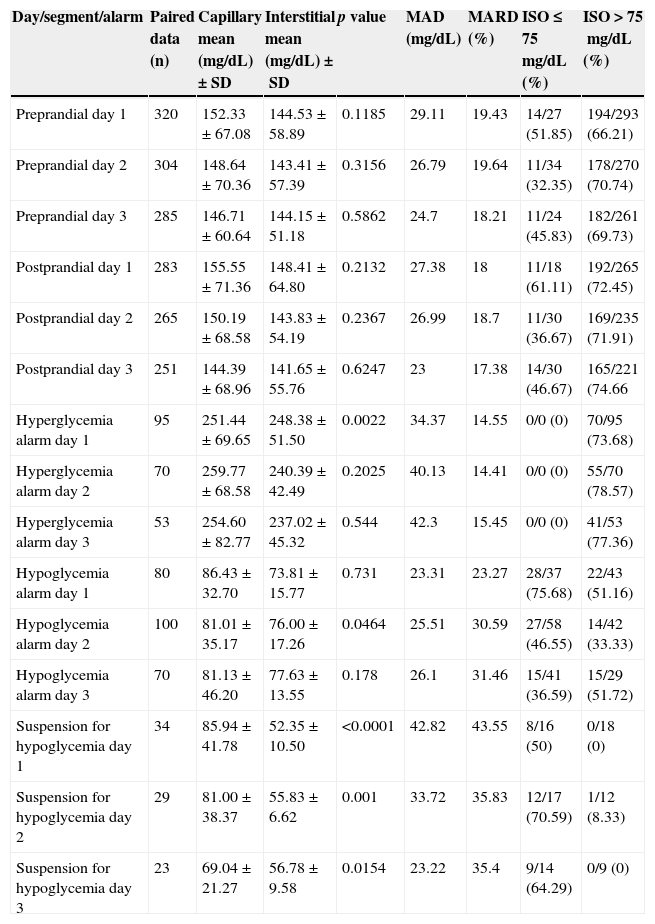
The MARD of all measurements (n=2262) was 20.1%, and ISO compliance was 64.94%. Table 3 provides a detailed description of the behavior in numerical precision of each segment and alarm considered. In addition, the MARD was differentially assessed in patients with type 1 and type 2 diabetes. No difference was found between them (20.43% vs 19.85%, p=0.75), thus showing that type of diabetes has no impact on sensor precision.
Overall comparison of capillary vs interstitial values by day of use of the sensor.
| Day/segment/alarm | Paired data (n) | Capillary mean (mg/dL)±SD | Interstitial mean (mg/dL)±SD | p value | MAD (mg/dL) | MARD (%) | ISO≤75mg/dL (%) | ISO>75mg/dL (%) |
|---|---|---|---|---|---|---|---|---|
| Preprandial day 1 | 320 | 152.33±67.08 | 144.53±58.89 | 0.1185 | 29.11 | 19.43 | 14/27 (51.85) | 194/293 (66.21) |
| Preprandial day 2 | 304 | 148.64±70.36 | 143.41±57.39 | 0.3156 | 26.79 | 19.64 | 11/34 (32.35) | 178/270 (70.74) |
| Preprandial day 3 | 285 | 146.71±60.64 | 144.15±51.18 | 0.5862 | 24.7 | 18.21 | 11/24 (45.83) | 182/261 (69.73) |
| Postprandial day 1 | 283 | 155.55±71.36 | 148.41±64.80 | 0.2132 | 27.38 | 18 | 11/18 (61.11) | 192/265 (72.45) |
| Postprandial day 2 | 265 | 150.19±68.58 | 143.83±54.19 | 0.2367 | 26.99 | 18.7 | 11/30 (36.67) | 169/235 (71.91) |
| Postprandial day 3 | 251 | 144.39±68.96 | 141.65±55.76 | 0.6247 | 23 | 17.38 | 14/30 (46.67) | 165/221 (74.66 |
| Hyperglycemia alarm day 1 | 95 | 251.44±69.65 | 248.38±51.50 | 0.0022 | 34.37 | 14.55 | 0/0 (0) | 70/95 (73.68) |
| Hyperglycemia alarm day 2 | 70 | 259.77±68.58 | 240.39±42.49 | 0.2025 | 40.13 | 14.41 | 0/0 (0) | 55/70 (78.57) |
| Hyperglycemia alarm day 3 | 53 | 254.60±82.77 | 237.02±45.32 | 0.544 | 42.3 | 15.45 | 0/0 (0) | 41/53 (77.36) |
| Hypoglycemia alarm day 1 | 80 | 86.43±32.70 | 73.81±15.77 | 0.731 | 23.31 | 23.27 | 28/37 (75.68) | 22/43 (51.16) |
| Hypoglycemia alarm day 2 | 100 | 81.01±35.17 | 76.00±17.26 | 0.0464 | 25.51 | 30.59 | 27/58 (46.55) | 14/42 (33.33) |
| Hypoglycemia alarm day 3 | 70 | 81.13±46.20 | 77.63±13.55 | 0.178 | 26.1 | 31.46 | 15/41 (36.59) | 15/29 (51.72) |
| Suspension for hypoglycemia day 1 | 34 | 85.94±41.78 | 52.35±10.50 | <0.0001 | 42.82 | 43.55 | 8/16 (50) | 0/18 (0) |
| Suspension for hypoglycemia day 2 | 29 | 81.00±38.37 | 55.83±6.62 | 0.001 | 33.72 | 35.83 | 12/17 (70.59) | 1/12 (8.33) |
| Suspension for hypoglycemia day 3 | 23 | 69.04±21.27 | 56.78±9.58 | 0.0154 | 23.22 | 35.4 | 9/14 (64.29) | 0/9 (0) |
International Organization for Standardization (ISO) criteria: difference in sensor value within ±15mg/dL when capillary blood glucose ≤75mg/dL or within ±20% when capillary blood glucose >75mg/dL.
% ISO criteria: number of sensor readings within the criterion/total capillary readings according to capillary value ≤75 or >75mg/dL (%).
The personalized alarm limits for hypoglycemia and unaware hypoglycemia were programmed in a wide range (including values higher than 75mg/dL).
SD: standard deviation; MAD: mean absolute difference; MARD: mean absolute relative difference.
Overall, MARD was lower than 20% for pooled preprandial and postprandial records (Table 3). Because of sensor characteristics, precision was calculated by day since device insertion (days 1, 2, and 3). No significant differences were found. Sixty-five percent of preprandial readings met the ISO criterion (590 of 909 measurements). Eighty-five paired recordings were obtained for the range ≤75g/dL, with ISO compliance in 42.4% (36 of 85 readings). In postprandial measurements (n=799), ISO criteria were met in 70.34% of cases (>75g/dL, 526 of 721 readings, 72.95%; ≤75g/dL, 36 of 78 readings, 46.15%).
For hypoglycemia alarms (n=250), overall compliance with ISO guidelines was seen in 121 data, or 48.4%. In this case, mean MARD was 28.5%.
In recordings of automated suspension on hypoglycemia, only 34.9% of reading met ISO criteria, with MARD values ranging from 35% and 43%. The limited number of measurements (n=86) should however be taken into account.
Clinical precisionA total of 2.247 data pairs were considered after excluding capillary blood glucose values higher than 400mg/dL due to the limit of sensor sensitivity. The combined percentage in zones A and B of the Clarke error grid (clinically acceptable) was 93.2% for preprandial data, 93.8% for postprandial data, 75.6% for hypoglycemia recordings, 97.6% for hyperglycemia recordings, and 89.5% for recordings of automated suspension on hypoglycemia. For all values combined, percentages were 91.77% in zones A+B and 0.18% in zone E. Fig. 1 shows the comparative behavior of capillary and interstitial blood glucose values according to Clarke error grid.
 Preprandial paired values (values in zones A+B 93.27%). (B) Postprandial values (zones A+B 93.84%). (C) Hypoglycemia alarm (zones A+B 75.6%). (D) Hyperglycemia alarm (zones A+B 97.62%). (E) Suspension for hypoglycemia (zones A+B 89.54%). (F) Total values (zones A+B 91.77%, zone E 0.18%). Inside each plot, paired data are given in each of the zones proposed by Clarke as follows: (A) insterstitial values within 20% of the capillary blood glucose range; (B) interstitial blood glucose values outside 20% of the capillary range but not leading to inadequate treatment; (C) interstitial blood glucose values leading to unnecessary treatment; (D) interstitial vs capillary values suggesting a potentially dangerous failure to detect hypoglycemia or hyperglycemia; (E) interstitial blood glucose values that would lead to confound management of hypoglycemia for management of hyperglycemia or vice versa.")
Clarke error grid analysis. (A) Preprandial paired values (values in zones A+B 93.27%). (B) Postprandial values (zones A+B 93.84%). (C) Hypoglycemia alarm (zones A+B 75.6%). (D) Hyperglycemia alarm (zones A+B 97.62%). (E) Suspension for hypoglycemia (zones A+B 89.54%). (F) Total values (zones A+B 91.77%, zone E 0.18%). Inside each plot, paired data are given in each of the zones proposed by Clarke as follows: (A) insterstitial values within 20% of the capillary blood glucose range; (B) interstitial blood glucose values outside 20% of the capillary range but not leading to inadequate treatment; (C) interstitial blood glucose values leading to unnecessary treatment; (D) interstitial vs capillary values suggesting a potentially dangerous failure to detect hypoglycemia or hyperglycemia; (E) interstitial blood glucose values that would lead to confound management of hypoglycemia for management of hyperglycemia or vice versa.
No episodes of ketoacidosis were reported after the events of automated suspension on hypoglycemia or after activation of alarms of hyperglycemia. Similarly, no patient required medical management for hypoglycemia during the recording period.
DiscussionThere are multiple reports in the literature on the use of continuous glucose monitoring associated to insulin pump therapy.21–24 This is however the first study to assess numerical and clinical precision of devices of devices including the function of automated suspension on hypoglycemia in a Latin American population.
Prior publications have shown that the calibration algorithm of the MiniMed Paradigm® Veo™ system (Medtronic Inc, Northridge, CA) is more precise in the range from 81 and 120mg/dL and has shown a significant improvement between 40 and 80mg/dL.12 Initial validations suggested an increase in detection of hypoglycemia from 54.9% to 82.3% when the new mathematical process was included, and up to 90–94% when the predictive alert tools allowed by development of the automated suspension on hypoglycemia tool were considered. For such study, according to detection ranges the MARD is within the range of 14–18% for the values of 80–240mg/dL, and close to 25% for values of 40–80mg/dL,12 data similar to those found in this study. In our particular case, a better performance was shown with regard to ISO criteria and MARD for measurements in normo- and hyperglycemia, although in the case of automated suspension on hypoglycemia, more than 50% of measurements in the level ≤75mg/dL did not comply with the guidelines.
Despite numerical reductions in MAD and MARD calculations, there is no agreement on the precision categories for this or other statistical measurements reported,12,15 and even in different consensuses there is no clear definition of the values to establish adequate performance, because although ISO criteria have been accepted as a general measure, these were adapted from evaluation of systems for measuring capillary blood glucose.18,19
According to several authors and consensus guidelines,12,16,18,19 clinical precision, defined by Clarke error grid analysis, takes precedence over the concept of numerical precision. The strength of this method lies in the definition of clinical outcomes by identifying the result of the intervention performed using data obtained by the interstitial sensor and in the dynamic properties of the analysis, as this includes the direction and change of blood glucose values.15,18–25 Modifications in the calibration processes and algorithms of devices have resulted in a significant improvement in the clinical aspect, so that the proportion of measurements located in zones A and B of Clarke error grid ranges from 76% and 89% for lower values and from 93% and 99% in the normo- and hyperglycemic ranges.13,19 Findings in our population agree with that behavior, with an overall performance in zones A and B of 91.7%; even in the hypoglycemic and hyperglycemic ranges, the values are similar to those reported in other studies (75.6% for hypoglycemia and 97.6% for hyperglycemia in our case). Significantly, only in one case was a high percentage found in zone E, the one with the greatest potential risk (1.16% for automated suspension on hypoglycemia), a situation possibly associated to the low number of total measurements. The number of episodes is striking considering the characteristics of high hypoglycemic risk of our population. This may reflect a potential improvement in frequency of hypoglycemia associated to use of the devices.
This behavior correlates to description in the literature of reduction of values in zone E of the integrated technology, ranging from 0.12% and 0.18%, the limit of overall performance in our study. These elements, combined with absence of hyperglycemia associated to ketoacidosis or requirement of medical or hospital management after suspension or for severe hypoglycemia, suggest an earlier and more accurate detection of events of hyperglycemia and hypoglycemia, improving patient safety and widening the space for self-management of the potential complications associated to these. As an additional benefit, our findings represent a first analysis in the outpatient setting, outside the controlled conditions of a clinical study, indicating the favorable results of device performance in the real world.
ConclusionAlthough a better numerical performance was seen for interstitial measurements in situations of normo- and hyperglycemia, the clinical precision established through the Clarke error grid shows that most measurements are in clinically adequate categories, with a minimum of data in the groups with associated risk due to interventions defined with continuous monitoring. CGM is thus shown to have adequate clinical performance, contributing to patient management by including tools for trends in blood glucose changes without compromising patient safety.
This study is the first Latin American description of the behavior of this therapy in our specific population, and represents a starting point for comparison with new modifications aimed at improving the current devices for management of diabetes.
Conflicts of interestAna María Gómez has acted as speaker for Novo-Nordisk, Elli Lilly, MSD Novartis, and Medtronic, and has received funding for research from Medtronic, Sanofi Aventis, and Abbott.
Alejandro Marín Sánchez has acted as speaker for Medtronic.
All other authors state that they have no conflicts of interest.
Please cite this article as: Gómez AM, Marín Sánchez A, Muñoz OM, Colón Peña CA. Precisión numérica y clínica de la monitorización continua de glucosa en pacientes colombianos en terapia con bomba de infusión de insulina con suspensión automática en hipoglucemia. Endocrinol Nutr. 2015;62:485–492.
