


To obtain local reference values for blood lipids and blood pressure (BP), and to determine the prevalence of metabolic syndrome (MS) in children and adolescents from Mérida, Venezuela, and to compare results using local and international cut-off values.
Materials and methodsThe study enrolled 916 participants of both sexes aged 9–18 years of age from educational institutions. Demographic, anthropometric, and BP data were collected. Fasting blood glucose and lipid profile were measured. Percentile distribution of lipid and BP values was done by age group and sex. Prevalence of MS was estimated based on the NCEP-ATPIII classification (as modified by Cook et al.) and the classification of the International Diabetes Federation, using percentiles of Mérida and the USA as cut-off points. Agreement between both classifications was estimated using the kappa test (κ).
ResultsPrevalence of MS was 2.2% by Cook-Merida percentiles, as compared to 1.8% by Cook-USA percentiles, a moderate agreement (κ=0.54). Agreement between Cook et al. and IDF using Merida percentiles was weak (κ=0.28). There was a higher frequency of abdominal obesity, hypertriglyceridemia and hypertension, and a lower frequency of low HDL-C using Mérida percentiles. The risk (odds ratio) of having MS is greater if abdominal obesity exists (OR: 98.63, CI: 22.45–433.35, p=0.0001). MS was significantly more common in obese subjects (18.3%, p=0.0001).
ConclusionsPrevalence of MS in this sample of children and adolescents was 2.2%. Lipid and BP values were lower in Venezuelan as compared to US, European, and Asian children and adolescents, and similar to those in Latin-American references. Own reference values are required for accurate diagnosis of MS, as well as a worldwide consensus on its diagnostic criteria.
Obtener valores de referencia local de lípidos sanguíneos y presión arterial (PA), y determinar la prevalencia de síndrome metabólico (SM) en escolares y adolescentes de la ciudad de Mérida, Venezuela, y comparar resultados usando puntos de corte propios e internacionales.
Materiales y métodosParticiparon 916 estudiantes de 9 a 18 años de edad, de ambos sexos, provenientes de instituciones educativas. Se obtuvieron datos demográficos, antropométricos y de PA. Se cuantificaron glucemia en ayunas y perfil lipídico. Los valores de los lípidos y la PA se distribuyeron por percentiles (pc), según grupos de edad y sexo. Para el diagnóstico de SM se consideraron 2 clasificaciones, la del NCEP-ATP III-modificada por Cook et al. y la de la Federación Internacional de Diabetes, usando los pc de Mérida y de EE. UU. como puntos de corte. La concordancia entre ambas clasificaciones se estimó con el índice kappa (κ).
ResultadosLa prevalencia de SM fue del 2,2% por Cook-pc Mérida, frente al 1,8% por Cook-pc EE. UU., concordancia moderada (κ=0,54). La concordancia entre Cook et al. e IDF, usando pc Mérida, fue débil (κ=0,28). Usando los pc Mérida hubo mayor frecuencia de obesidad abdominal, hipertrigliceridemia y PA elevada, y menos de cHDL bajo. El riesgo (odds ratio) de presentar SM es mayor si la obesidad abdominal está presente (OR: 98,63; IC: 22,45–433,35; p=0,0001). El SM fue significativamente más frecuente en los obesos (18,3%; p=0,0001).
ConclusionesLa prevalencia de SM en esta muestra de niños y adolescentes fue del 2,2%. Los valores de lípidos y de PA fueron más bajos que los norteamericanos, europeos y asiáticos, y similares a los latinoamericanos. Se justifica la obtención de valores propios de referencia para diagnóstico certero de SM, así como un consenso mundial sobre sus criterios diagnósticos.
Metabolic syndrome (MS) is defined as a group of metabolic abnormalities occurring in an individual leading to an increased frequency of atherosclerotic cardiovascular disease and type 2 diabetes mellitus.1 This condition affects adult and young people, and there is evidence that presence of cardiovascular risk factors in childhood is associated to development of coronary artery disease in adult age.2,3
Because of the increased prevalence of overweight and obesity in the pediatric population in the past two decades and the rapid increase in the incidence of type 2 diabetes mellitus in this age group, it has been deemed appropriate to establish adequate MS criteria for this population to predict complications in adult age.4 Controversy exists between the different classifications and cut-off points that should be used for each of the MS components in children, which has caused confusion and difficulties to compare studies in different populations and to establish the long-term clinical implications of this syndrome.5
Although the MS components in children and adolescents are the same as reported in adults (obesity, hypertriglyceridemia, low high density lipoprotein cholesterol level (HDL-C), high blood pressure (HBP), and impaired carbohydrate metabolism), various studies question the application of the cut-off values recommended for adults in the pediatric population because they do not take into account the dynamics of growth and maturation in children, the effect of hormonal changes in puberty on insulin secretion and sensitivity, lipid profile changes, impact of familial heredity, and ethnicity, all of them variables which make it difficult to establish criteria for children.6–8
A literature review conducted by Ford and Li9 showed that countless definitions of MS in children and adolescents have been devised in recent years, with the disadvantage that many authors opt for developing their own definition, although with very similar characteristics to those proposed by the National Cholesterol Education Program (NCEP),10–16 which have been used in comparative studies with various results. In addition, many countries do not have their own references for anthropometric or lipid measurements, and therefore use international values or values from other countries for the different percentiles (PCs). This may lead to MS frequency results different from reality, regardless of the criteria used and hence the importance to know the normal distribution patterns of a given characteristic in the population depending on age and sex, and to use cut-off points that correspond to the local or regional reference values for the different MS components.17 In Venezuela, reference values are available for anthropometric measures, blood pressure (BP), total cholesterol (TC), and triglycerides (TG). However, those values were taken from a pediatric population in 199318 and need updating. No national reference values are available for waist circumference (WC), low density lipoprotein cholesterol (LDL-C), HDL-C, and non-HDL cholesterol. Such values are very important for early detection of the potential cardiometabolic risk of our children and adolescents and to undertake the preventive interventions required.
The lack of a standard classification causes MS prevalence in the population of children and adolescents to vary widely depending on the criteria used. Thus, in the US Cook et al.11 found a 4.2% prevalence, while Ferranti et al.12 reported a 9.2% prevalence using stricter criteria. In Latin America, a study in Chile19 found MS prevalence rates of 4% in overweight children and 30% in obese children. In Venezuela, in an evaluation of 370 children aged 7–9 years from the city of Merida, MS frequency was 0.4% in normal weight children and 38.9% in obese children.20
Since differences in lifestyle and/or genetic determinants are responsible for variations in reference values between the different populations,12,13 and because of the discrepancies in definition of MS in this age group, in which early diagnosis and intervention would hypothetically improve the quality of life of individuals at risk, a population study was conducted in children and adolescents from Municipio Libertador in Mérida-Venezuela to collect our own updated reference BP and blood lipid values and to establish the prevalence of MS using the most widely accepted classifications for this purpose and ascertain whether differences occur when local, instead of international, cut-off points are used for the different components.
Subjects and methodsSubjectsAn observational, cross-sectional, analytical study was conducted. The study sample was part of a project entitled “Evaluation of growth, development, and cardiometabolic risk factors in schoolchildren and adolescents from Mérida, Venezuela (CREDEFAR)” which was conducted at Instituto Autónomo Hospital Universitario de Los Andes (IAHULA) from March 2010 to June 2011 with the participation of the departments of endocrinology, pediatric nutrition, growth, and development, and clinical nutrition. The population and sampling were discussed in a prior publication of the CREDEFAR study.21 A representative sample of 927 children and adolescents aged 9–18 years from 8 public and 5 private institutions in Municipio Libertador in the city of Mérida was collected. Children whose parents, after reading the information brochure, agreed to study participation and signed the informed consent were enrolled into the study. Eleven subjects were excluded: one pregnant, one with type 1 diabetes mellitus, two with low height treated with growth hormone, one with chronic malnutrition, one with cerebral palsy, two with history of metformin treatment, and three for incomplete anthropometric data. The final sample, 916 subjects, was greater than estimated for this research, which was 67 subjects per year of age, i.e. 603 subjects. Estimation was made using a 4.6% frequency of MS, obtained in a prior study in our city in children aged 7–9 years,20 an alpha error of 0.05, and an approximate population per year of age of 4000 subjects, collected from the regional educational area.
ProcedureOnce authorization was obtained from the corresponding educational center, participants were appointed to attend the IAHULA with their representatives for collection of demographic data and personal and family history of cardiovascular disease. A physical examination including measurement of weight, height, BP, and WC was performed. Body mass index (BMI) was calculated using the formula BMI=weight (kg)/height2 (m). After a 10-h fast, a venous blood sample was drawn from the antecubital area of the arm to test fasting blood glucose (FBG) and lipid levels.
Anthropometric data were taken with the participant in underwear and with no shoes, following the rules and procedures described in the 2000 National Health and Nutrition Examination Survey.22 They were weighed in a standard scale, and their height was determined as the mean of three consecutive measures using a Harpenden stadiometer. WC was measured using an inextensible measuring tape at a point midway between the costal margin and iliac crest (anterosuperior iliac spine) with the subject standing and breathing out. BP was recorded using a mercury sphygmomanometer in the extended right arm and with the subject seated, taking care to maintain the zero at right atrium level, with an adequate cuff that covered completely (or by at least 80%) arm circumference without exceeding it and two thirds of the arm's length.
Blood glucose, TG, TC, and HDL-C levels were tested using enzymatic methods with commercial reagents from CIENVAR and a HITACHI 911 autoanalyzer. HDL-C was separated from the other lipoproteins present in serum by precipitation of low and very low density lipoproteins (LDL and VLDL), and from chylomicrons using a precipitating reagent consisting of phosphotungstic acid and magnesium ions, leaving HDL-C alone in the supernatant. LDL-C was calculated using the Friedewald formula: LDL-C=TC−(TG/5+HDL-C). Tests were performed at the hormone laboratory of IAHULA. The ethical standards set down in the Declaration of Helsinki were met.
Categorization of variables- -
For nutritional status, the curves for Venezuelan children and adolescents were obtained by FUNDACREDESA,23 considering as obesity BMI values >97th PC, overweight BMI values >90th and ≤97th PC, normal weight if BMI values ranged from the 10th and 90th PC, and low weight if BMI was24 to allow for international comparisons.
- -
Two classifications were used for MS diagnosis: the ATP III classification modified by Cook et al.11 and the 2007 classification of the International Diabetes Federation (IDF).16 The Cook et al. criteria included: WC (cm) >90th PC for age and sex, systolic and diastolic BP (mmHg) >90th PC for age and sex, TG (mg/dL) >90th PC for age and sex, HDL-C (mg/dL) <10th PC for age and sex, and FBG≥100mg/dL. The IDF criteria for subjects aged 9–16 years included: WC (cm) >90th PC for age and sex, systolic BP≥130 and/or diastolic BP ≥85mmHg, TG ≥150mg/dL, HDL-C <40mg/dL, and FBG ≥100mg/dL; the criteria for subjects older than 16 years included: WC >90cm in males and >80cm in females, systolic BP ≥130 and/or diastolic BP ≥85mmHg, TG ≥150mg/dL, HDL-C <40mg/dL in males and <50mg/dL in females, and FBG ≥100mg/dL. MS was diagnosed according to Cook et al. when at least three diagnostic criteria were met, and according to IDF when there was abdominal obesity as predefined criterion plus two additional criteria.
In order to compare the results obtained using local references to international references, the Cook et al. classification was divided into:
- •
Cook-Mérida PCs: using WC,21 TG, HDL-C, and BP, the cut-off points obtained in sample distribution for children and adolescents participating in this study (CREDEFAR). Table 1 shows the percentile distribution of blood lipids by age and sex groups, and Table 2 gives the percentile distribution of BP by age and sex groups.
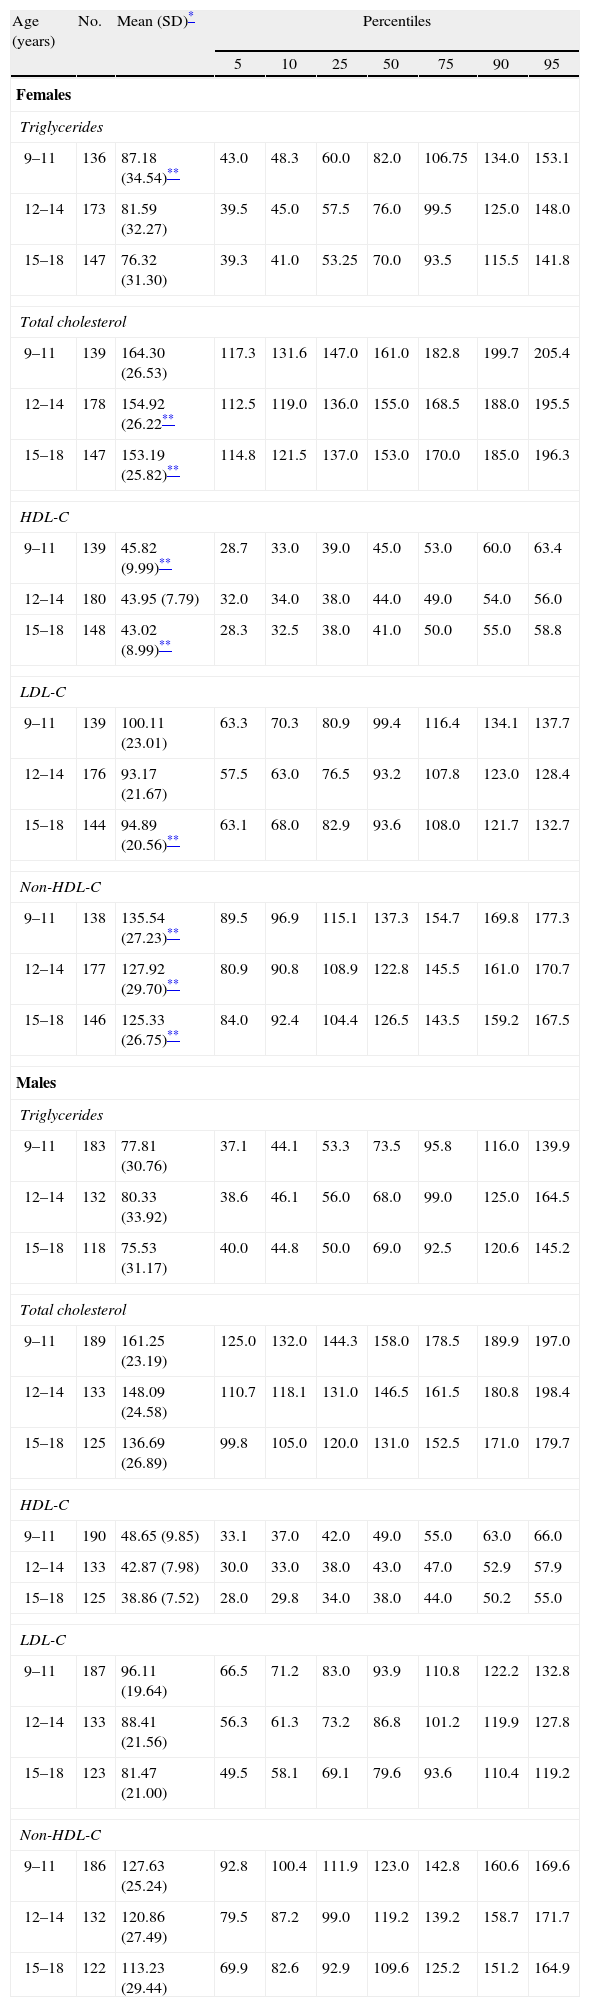
Table 1.Percentile distribution of serum lipid levels (mf/dL) by age and sex groups in children and adolescents from Municipio Libertador in Mérida, Venezuela (CREDEFAR study).
Age (years) No. Mean (SD)* Percentiles 5 10 25 50 75 90 95 Females Triglycerides 9–11 136 87.18 (34.54)** 43.0 48.3 60.0 82.0 106.75 134.0 153.1 12–14 173 81.59 (32.27) 39.5 45.0 57.5 76.0 99.5 125.0 148.0 15–18 147 76.32 (31.30) 39.3 41.0 53.25 70.0 93.5 115.5 141.8 Total cholesterol 9–11 139 164.30 (26.53) 117.3 131.6 147.0 161.0 182.8 199.7 205.4 12–14 178 154.92 (26.22** 112.5 119.0 136.0 155.0 168.5 188.0 195.5 15–18 147 153.19 (25.82)** 114.8 121.5 137.0 153.0 170.0 185.0 196.3 HDL-C 9–11 139 45.82 (9.99)** 28.7 33.0 39.0 45.0 53.0 60.0 63.4 12–14 180 43.95 (7.79) 32.0 34.0 38.0 44.0 49.0 54.0 56.0 15–18 148 43.02 (8.99)** 28.3 32.5 38.0 41.0 50.0 55.0 58.8 LDL-C 9–11 139 100.11 (23.01) 63.3 70.3 80.9 99.4 116.4 134.1 137.7 12–14 176 93.17 (21.67) 57.5 63.0 76.5 93.2 107.8 123.0 128.4 15–18 144 94.89 (20.56)** 63.1 68.0 82.9 93.6 108.0 121.7 132.7 Non-HDL-C 9–11 138 135.54 (27.23)** 89.5 96.9 115.1 137.3 154.7 169.8 177.3 12–14 177 127.92 (29.70)** 80.9 90.8 108.9 122.8 145.5 161.0 170.7 15–18 146 125.33 (26.75)** 84.0 92.4 104.4 126.5 143.5 159.2 167.5 Males Triglycerides 9–11 183 77.81 (30.76) 37.1 44.1 53.3 73.5 95.8 116.0 139.9 12–14 132 80.33 (33.92) 38.6 46.1 56.0 68.0 99.0 125.0 164.5 15–18 118 75.53 (31.17) 40.0 44.8 50.0 69.0 92.5 120.6 145.2 Total cholesterol 9–11 189 161.25 (23.19) 125.0 132.0 144.3 158.0 178.5 189.9 197.0 12–14 133 148.09 (24.58) 110.7 118.1 131.0 146.5 161.5 180.8 198.4 15–18 125 136.69 (26.89) 99.8 105.0 120.0 131.0 152.5 171.0 179.7 HDL-C 9–11 190 48.65 (9.85) 33.1 37.0 42.0 49.0 55.0 63.0 66.0 12–14 133 42.87 (7.98) 30.0 33.0 38.0 43.0 47.0 52.9 57.9 15–18 125 38.86 (7.52) 28.0 29.8 34.0 38.0 44.0 50.2 55.0 LDL-C 9–11 187 96.11 (19.64) 66.5 71.2 83.0 93.9 110.8 122.2 132.8 12–14 133 88.41 (21.56) 56.3 61.3 73.2 86.8 101.2 119.9 127.8 15–18 123 81.47 (21.00) 49.5 58.1 69.1 79.6 93.6 110.4 119.2 Non-HDL-C 9–11 186 127.63 (25.24) 92.8 100.4 111.9 123.0 142.8 160.6 169.6 12–14 132 120.86 (27.49) 79.5 87.2 99.0 119.2 139.2 158.7 171.7 15–18 122 113.23 (29.44) 69.9 82.6 92.9 109.6 125.2 151.2 164.9 HDL-C: high density lipoprotein cholesterol; LDL-C: low density lipoprotein cholesterol; non-HDL-C: non-HDL cholesterol; SD: standard deviation.
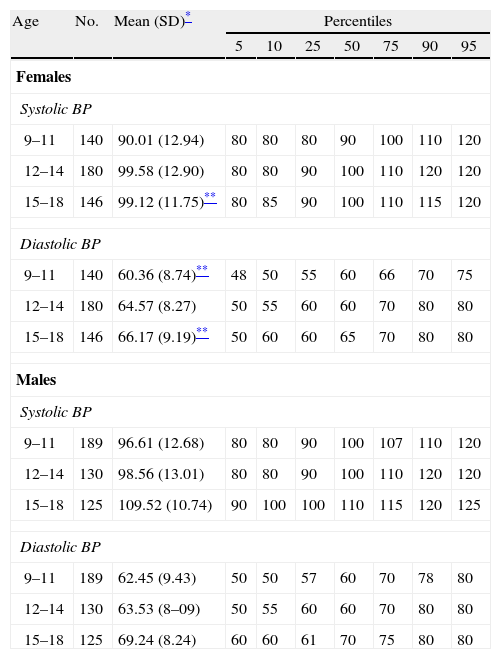
Table 2.Percentile distribution of blood pressure values (mmHg) by age and sex groups in children and adolescents from Municipio Libertador, Mérida, Venezuela (CREDEFAR study).
Age No. Mean (SD)* Percentiles 5 10 25 50 75 90 95 Females Systolic BP 9–11 140 90.01 (12.94) 80 80 80 90 100 110 120 12–14 180 99.58 (12.90) 80 80 90 100 110 120 120 15–18 146 99.12 (11.75)** 80 85 90 100 110 115 120 Diastolic BP 9–11 140 60.36 (8.74)** 48 50 55 60 66 70 75 12–14 180 64.57 (8.27) 50 55 60 60 70 80 80 15–18 146 66.17 (9.19)** 50 60 60 65 70 80 80 Males Systolic BP 9–11 189 96.61 (12.68) 80 80 90 100 107 110 120 12–14 130 98.56 (13.01) 80 80 90 100 110 120 120 15–18 125 109.52 (10.74) 90 100 100 110 115 120 125 Diastolic BP 9–11 189 62.45 (9.43) 50 50 57 60 70 78 80 12–14 130 63.53 (8–09) 50 55 60 60 70 80 80 15–18 125 69.24 (8.24) 60 60 61 70 75 80 80 SD: standard deviation; BP: blood pressure.
- •
Cook-US PCs: using WC, TG, and HDL-C PCs the NHANES III references,25 which are used for reference in the US, and for BP the tables from the Fourth Report on the Diagnosis, Evaluation, and Treatment of High Blood Pressure in children and adolescents.26
The IDF classification was similarly divided into:
Statistical analysisTo perform distribution by percentiles (5th, 10th, 25th, 50th, 75th, 90th, and 95th) of blood lipid and BP values by age and sex groups, the data collected were previously explored, excluding outliers of these variables (±3 standard deviation [SD] Z-Score). For other analyses, continuous variables are given as mean±SD, and categorical variables as number and percentage. Differences between continuous variables were analyzed using a Student's t test or an analysis of variance (ANOVA), as appropriate. The proportion of children and adolescents with MS and with each of its components was calculated based on the different classifications and cut-off points. The kappa index (κ) was used to establish agreement between the results. Agreement was considered to be poor if <0.20; weak if 0.21–0.40; moderate if 0.41–0.60; good if the value obtained was 0.61–0.80; and very good if the value ranged from 0.81 to 1. The indirect relative risk (iRR-odds ratio. [OR]) of having MS was estimated based on the presence of its components. Association of MS with nutritional status, sex, age groups, and public or private institutions was established using a Chi-square test. A value of p<0.05 was considered statistically significant. Data were processed using SPSS version 19.
ResultsOf the 916 children and adolescents enrolled into the study, 484 (52.8%) came from public educational centers and 432 (47.2%) from private centers, and 466 (50.9%) were females and 450 (49.1%) males. Age ranged from 9 to 18.6 years, with a mean of 13.25 years (SD, 2.56); 36.4% (n=333) were 9–11 years old, 34.1% (n=312) were aged 12–14 years, and 29.6% (n=271) were 15–18 years old. When nutritional status was classified based on BMI, 630 subjects (68.8%) had normal nutritional status, 128 (14%) low weight, 87 (9.5%) overweight, and 71 (7.8%) obesity. Using the Cole et al. definition,24 obesity was found in 4.4% of the subjects (n=40), overweight in 17.3% (n=158), and low or normal weight in 78.4% (n=717), with a good agreement (κ=0.760) with the Venezuelan classification. The mean and SD for height, weight, and BMI in the CREDEFAR sample, as well as the corresponding PC by age and sex according to Venezuelan curves, were reported in the prior publication.21
Table 1 shows the mean, SD, and percentiles of blood lipid levels by age and sex groups in our population. Overall, female subjects had higher mean levels than males, with the difference being significant for TG in the group aged 9–11 years, for total cholesterol, HDL-C and LDL-C in the older groups, and in all age groups for non-HDL cholesterol (p<0.05). Mean levels of the different lipids significantly decreased with increasing age. This was more evident in males, with the lowest levels found in the group aged 15–18 years in both sexes (p<0.05).
Table 2 shows the mean, SD, and percentiles of BP by age and sex groups in our population. Overall, higher values were found in males as compared to females, and the difference was significant for systolic BP in the group aged 15–18 years, and for diastolic BP in the groups aged 9.11 and 15–18 years (p<0.05). The mean value of systolic and diastolic BP significantly increased with age (p<0.0001).
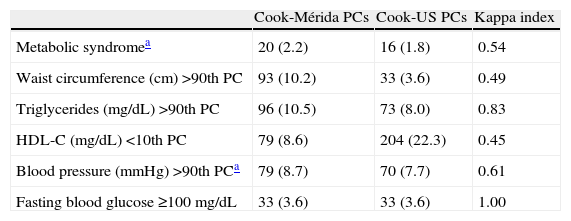
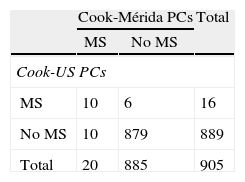
Table 3 shows the prevalence of MS and its components when the proposal by Cook et al. was used.11 MS was diagnosed in 20 subjects (2.2%) when Cook-Mérida PCs were used, and in 16 (1.8%) when Cook-US PCs were used; agreement was moderate (κ=0.54). Table 3.1, included in Annex 1, lists the cases with and without MS. As shown, when US PCs were used, 10/20 participants (50%) with MS were not detected and six cases were overdiagnosed as compared to when Mérida PCs were used, and only 10 cases were diagnosed by both criteria. As regards MS components, abdominal obesity, as measured by WC, showed a greater frequency when the local 90th PC was used, with a total of 93 cases, as compared to 33 cases when the US PC was used (10.2 vs 3.6%); similarly, TG changes were 96 (10.5%) vs 73 (8%) and BP changes were 79 (8.7%) vs 70 (7.7%). The opposite was found when HDL-C data were analyzed, as a greater number of changes were seen when US PCs were used (22.3 vs 8.6%). BP data were missing in 11 subjects, and frequency of BP impairment and MS diagnosis was determined in 905 children and adolescents. Agreement using the κ index was moderate for WC (κ=0.49) and HDL-C (κ=0.45), good for BP (κ=0.61), and very good for TG (κ=0.83) and FBG (κ=1). According to local references, the most common risk factor in this population was TG elevation (10.5%), followed by abdominal obesity (10.2%), elevated BP (8.7%), and decreased HDL-C (8.6%).
Prevalence of metabolic syndrome and its components according to Cook et al. comparing local and international percentile values.
| Cook-Mérida PCs | Cook-US PCs | Kappa index | |
| Metabolic syndromea | 20 (2.2) | 16 (1.8) | 0.54 |
| Waist circumference (cm) >90th PC | 93 (10.2) | 33 (3.6) | 0.49 |
| Triglycerides (mg/dL) >90th PC | 96 (10.5) | 73 (8.0) | 0.83 |
| HDL-C (mg/dL) <10th PC | 79 (8.6) | 204 (22.3) | 0.45 |
| Blood pressure (mmHg) >90th PCa | 79 (8.7) | 70 (7.7) | 0.61 |
| Fasting blood glucose ≥100mg/dL | 33 (3.6) | 33 (3.6) | 1.00 |
HDL-C: high density lipoprotein cholesterol; PC: percentile.
Data given are numbers (percentage).
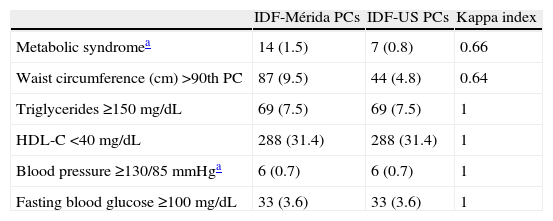
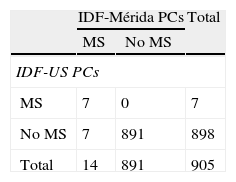
Table 4 shows prevalence of MS and its components according to the IDF. More cases of MS were diagnosed when IDF-Mérida PCs were used, 14 (1.5%) vs 7 (0.8%) with a value κ=0.66. There were 7 cases diagnosed by both methods and 7/14 (50%) not diagnosed with IDF-US PCs (Table 4.1). Eighty-seven cases (9.5%) of abdominal obesity were detected with the local value, as compared to 44 cases (4.8%) with the US value (κ=0.64). There were no differences in all other criteria, because fixed values were used.
Prevalence of metabolic syndrome and its components according to the International Diabetes Federation comparing values of local and international percentiles.
| IDF-Mérida PCs | IDF-US PCs | Kappa index | |
| Metabolic syndromea | 14 (1.5) | 7 (0.8) | 0.66 |
| Waist circumference (cm) >90th PC | 87 (9.5) | 44 (4.8) | 0.64 |
| Triglycerides ≥150mg/dL | 69 (7.5) | 69 (7.5) | 1 |
| HDL-C <40mg/dL | 288 (31.4) | 288 (31.4) | 1 |
| Blood pressure ≥130/85mmHga | 6 (0.7) | 6 (0.7) | 1 |
| Fasting blood glucose ≥100mg/dL | 33 (3.6) | 33 (3.6) | 1 |
HDL-C: high density lipoprotein cholesterol; IDF: International Diabetes Federation; PC: percentile.
Data given are numbers (percentage).
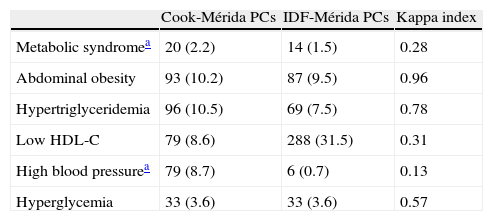
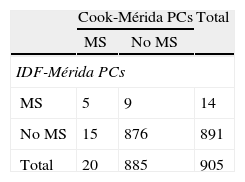
Table 5 shows the prevalence of MS and its components when local PCs obtained by CREDEFAR were used, comparing the Cook et al. and the IDF criteria. Twenty cases (2.2%) were diagnosed using the Cook-Mérida PCs classification, and 14 cases (1.5%) using the IDF-Mérida PCs. Agreement between both was however very weak (κ=0.28) because only five cases were detected by both methods (Table 5.1). Frequency of abdominal obesity was similar (10.2 vs 9.5%); hypertriglyceridemia was more common with the Cook et al. criterion using percentiles than with the IDF criterion, using an absolute value of 150mg/dL, 96 (10.5%) vs 69 (7.5%); agreement was very good for WC (κ=0.96) and good for TG (κ=0.78). Analysis of the frequency of low HDL-C levels showed less changes when Cook-Mérida PCs were used as compared to the absolute value of 40mg/dL proposed by the IDF: 79 (8.6%) vs 288 (31.5%); agreement was weak (κ=0.31). More cases of HBP were detected using the Cook-Mérida PC method, 79 (8.7%) vs 6 (0.7%) (κ=0.13. The same numbers were detected for FBG, because a cut-off point of 100mg/dL was used.
Prevalence of MS and its components using local and international percentile values and comparing Cool et al. and IDF criteria.
| Cook-Mérida PCs | IDF-Mérida PCs | Kappa index | |
| Metabolic syndromea | 20 (2.2) | 14 (1.5) | 0.28 |
| Abdominal obesity | 93 (10.2) | 87 (9.5) | 0.96 |
| Hypertriglyceridemia | 96 (10.5) | 69 (7.5) | 0.78 |
| Low HDL-C | 79 (8.6) | 288 (31.5) | 0.31 |
| High blood pressurea | 79 (8.7) | 6 (0.7) | 0.13 |
| Hyperglycemia | 33 (3.6) | 33 (3.6) | 0.57 |
HDL-C: high density lipoprotein cholesterol; IDF: International Diabetes Federation; PC: percentile.
Data given are numbers (percentage).
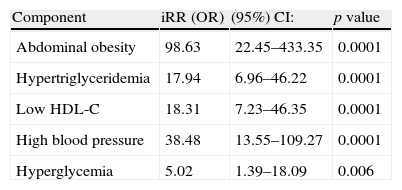
The iRR or OR of having MS if a subject has any MS component is shown in Table 6. In this sample of children and adolescents, the risk of subjects of experiencing MS is 98.6-fold greater if they have abdominal obesity; 17.9-fold greater if they have hypertriglyceridemia; 18.3-fold greater if they have low HDL-C levels; 38.4-fold greater if they are hypertensive; and 5-fold greater if they have impaired FBG levels.
Probability of having metabolic syndrome if any of its components is present, according to Cook-Mérida PC criteria.
| Component | iRR (OR) | (95%) CI: | p value |
| Abdominal obesity | 98.63 | 22.45–433.35 | 0.0001 |
| Hypertriglyceridemia | 17.94 | 6.96–46.22 | 0.0001 |
| Low HDL-C | 18.31 | 7.23–46.35 | 0.0001 |
| High blood pressure | 38.48 | 13.55–109.27 | 0.0001 |
| Hyperglycemia | 5.02 | 1.39–18.09 | 0.006 |
HDL-C: high density lipoprotein cholesterol; CI: confidence interval; OR: odds ratio; iRR: indirect relative risk.
When presence of the different MS components was investigated in subjects categorized by BMI using the Cook-Mérida PCs, the number of components was seen to significantly increase as adiposity increased (p=0.0001). Thus, no MS was seen in subjects with low and normal weight, while 7 (8.1%) overweight subjects and 13 (18.3%) obese subjects had MS (Fig. 1). In the group of 20 subjects with MS, the most common component was abdominal obesity (18/20 cases), followed by increased BP (15/20 cases), hypertriglyceridemia (13/20 cases), low HDL-C levels (12/20 cases), and fasting low blood glucose levels, found in only three of the 20 cases.
 according to Cook-Mérida PCs in children and adolescents by on body mass index. Percentage. Chi-square test: p=0.0001.")
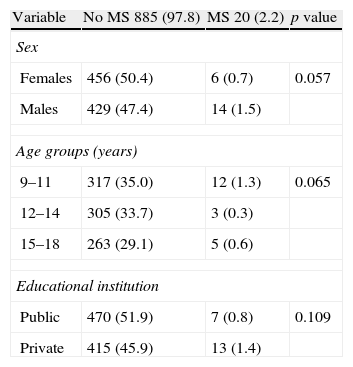
MS prevalence by sex, age group, and type of public or private institution was analyzed based on the proposal of Cook-Mérida PCs (Table 7). MS was more common in males (14 cases, 1.5%) as compared to females (6 cases, 0.7%) with a marginal significance (p=0.057). Prevalence was slightly greater in the 9–11 year group (1.3% vs 0.3% and 0.6%) and in subjects attending private institutions (13 [1.4%] vs 7 [0.8%]) as compared to public centers, without reaching statistical significance.
Prevalence of metabolic syndrome according to Cook-Mérida PCs in children and adolescents by sex, age group, and type of educational institution.
| Variable | No MS 885 (97.8) | MS 20 (2.2) | p value |
| Sex | |||
| Females | 456 (50.4) | 6 (0.7) | 0.057 |
| Males | 429 (47.4) | 14 (1.5) | |
| Age groups (years) | |||
| 9–11 | 317 (35.0) | 12 (1.3) | 0.065 |
| 12–14 | 305 (33.7) | 3 (0.3) | |
| 15–18 | 263 (29.1) | 5 (0.6) | |
| Educational institution | |||
| Public | 470 (51.9) | 7 (0.8) | 0.109 |
| Private | 415 (45.9) | 13 (1.4) | |
MS: metabolic syndrome.
Data are No. (%).
This study reports local reference values for lipid profile levels and BP in schoolchildren and adolescents from Municipio Libertador in the city of Mérida, Venezuela (CREDEFAR study). The behavior of these variables, stable during childhood and with sex differences during and after puberty, was similar to that reported by other authors.27–31 Qualitative differences were however found. A comparison of our lipid levels to those recently reported by Cook et al.25 in North American children combining data from NHANES (NHANES III 1988–1994 and NHANES 1999–2006) and the main US studies in childhood (Bogalusa Heart Study, Fels Longitudinal Study, Muscatine Study, and Lipid Research Clinics prevalence Study) shows that our subjects had lower levels at all ages, and that differences in the 90th PC were more marked as age increased, with our participants having TG and TC levels up to 10–20mg/dL lower in both sexes. The 10th PC of HDL-C in our population was also 4–5mg/dL lower as compared to North American children. A comparison to European28 and Asian32 studies also showed that our lipid levels were lower, while they were similar to those collected in Latin American populations.30,33,34 As regards BP values, our systolic pressure levels were lower than those reported in the Fourth Report on the Diagnosis, Evaluation, and Treatment of High Blood Pressure in children and adolescents,26 with differences in the 90th PC ranging from 10 and 15mmHg, while diastolic pressure values showed smaller differences, our values being only 2–4mmHg lower. The differences found emphasize the need for having our own references. If our children and adolescents are evaluated using international references, a significant number of subjects with dyslipidemia and HBP would go undetected because this warning of cardiometabolic risk would be overlooked.
MS prevalence in children and adolescents varies depending on the classification and reference values used. MS prevalence in our study was 2.2%, a low rate when compared to the 4.2% prevalence found by Cook et al.11 in the US population and to the 7.3% prevalence found by Mardones et al.35 in the public schools of Santiago de Chile, similar to the 2.3% rate recently reported by Park et al.36 in Korean adolescents, and higher than that reported by Ekelund et al.37 (1.4%) in young European subjects.
When MS diagnosis based on Cook-Mérida PCs and on Cook-US PCs was compared a slightly greater frequency was found using our percentiles, 20 (2.2%) vs 16 (1.8%). When the different components are analyzed, it is clear that such differences are due, on the one hand, to WC, TG, and BP, as our 90th PC values for these are lower as compared to US values and more subjects with changes are detected, and on the other hand to the 10th PC value of HDL-C, because the US value is higher and detects more subjects with changes in our population. The ultimate MS is similar, but the subjects detected are different. These results clearly show that international values differ from our values, and could lead to a wrong diagnosis of MS if they are used. There are no studies in the literature comparing regional and international PCs using the Cook et al. classification for MS which may serve to compare our results.
Using the IDF criteria, 87 cases of abdominal obesity were found using IDF-Métida PCs, as compared to 44 cases using IDF-US PCs; all other criteria were similar, because this classification recommends fixed rather than PC values. With this single change in WC, MS was found in 14 subjects (1.5%) when using IDF-Mérida PCs and in 7 subjects (0.8%) when using IDF-US PCs because of detection of more subjects with abdominal obesity with our PCs. Pirkola et al.38 reported in 2008 the results of a study conducted in 16-year-old adolescents using IDF criteria. Overall MS prevalence was 2.4 using the pediatric definition. When the adult definition was used, prevalence was 1.7% with European cut-off points for WC and 1% with US cut-off points. Authors concluded that in the 16-year-old population, the pediatric definition estimates a higher MS prevalence than the adult definition, and also confirmed the need for using percentiles of the population itself.
The classification proposed by the IDF emphasizes the central role of abdominal obesity, and this is a necessary condition for diagnosing MS, which according to authors such as Quah et al.39 could underestimate subjects with normal weight but with other changes that place them at risk of developing MS. In addition, use of fixed values for all other MS criteria (TG, HDL-C, and BP) masks the actual frequency of impaired values. In the Quah et al. study,39 no participant was hypertensive when the cut-off point of BP of 130/85mmHg was used, while 15.4% had systolic HBP and 9% diastolic HBP based on the PCs of the 1996 NHBPEWG.40 Similar observations were made in our study. Use of the cut-off point proposed by the IDF excludes a good proportion of cases as compared to the 90th PC of BP obtained in CREDEFAR (6 vs 79 cases).
A lower MS frequency was seen based on IDF criteria (1.5%) as compared to Cook et al. criteria (2.2%), as occurred in most studies.41–43 Some authors suggest that such difference is due to the fact that the IDF classification detects children with MS who are older and have greater WC and triglyceride levels, while cases of intermediate or mild severity are detected by criteria derived from ATP III.41,42 When both classifications were compared in our study, agreement in MS diagnosis was very low (κ=0.28), with only five cases diagnosed by both classifications. The reason for this is that the IDF classification uses fixed values of the different components, and therefore detects less cases of hypertriglyceridemia (69 vs 96) and HBP (6 vs 79), but much more cases of low HDL-C levels (288 vs 79) than the Cook et al. classification. The latter classification allows for use of regional PCs for identification of the component or risk factor, which better adjusts to the reality of each population. This lack of agreement was reported by Goodman et al.44 (2004), who compared MS prevalence in adolescents using the definitions of the World Health Organization and NCEP-ATP III and found a value of κ=0.41; the NCEP definition only identified 40% of the subjects with MS according to the classification of the World Health Organization, while the latter detected 66.7% of individuals with MS according to the NCEP-ATP III. Authors concluded that clinical and demographic differences exist in MS type depending on the definition, and discrepancies suggest a variation in the central element of the various classifications.
Diagnosis of MS confers a high cardiovascular risk because it represents several conditions in a same individual. Each of its components is however considered as an independent risk factor in itself, and should therefore be given adequate attention from childhood even if it is not associated to another factor. It should be noted that while 20 patients with MS were diagnosed (according to Cook-Mérida PCs), there were 93 subjects with abdominal obesity, 96 with hypertriglyceridemia, 79 with low HDL-C levels, and 79 with HBP, which should all receive treatment and clinical follow-up. This study showed that presence of any MS components significantly increases the risk of the syndrome, with central obesity conferring the greatest risk (iRR 98.63; p=0.0001). This agrees with the conclusion reported by Wang et al.43 that central obesity is the key element in clustering of metabolic risk factors in children. In our study, 90% of the subjects with MS had abdominal obesity.
Sinha et al.45 in a cohort of obese children, reported that impaired FBG levels were seen in only 0.8% using the cut-off point of 110mg/dL, and stated that this high FBG level indicated a more advanced stage in glucose homeostasis impairment which is usually preceded by carbohydrate intolerance. In our study, a single participant had a FBG level higher than 110mg/dL. Authors such as Nguyen et al.46 have shown that in children, risk of diabetes starts to increase from FBG levels higher than 86mg/dL. Reduction of the cut-off point for diagnosis of altered FBG levels in children to predict the probability of future development of diabetes mellitus is a significant challenge which requires more long-term data and is very important in view of increasing obesity.46 It was therefore decided to replace in this study the original FBG value proposed by Cook et al. as cut-off point for MS diagnosis of 110mg/dL11 by a value of 100mg/dL, which is the one accepted since 1997 by the American Diabetes Association47 for diagnosis of FBG impairment. On the other hand, some researchers48 have found that serum glucose levels do not significantly change as adiposity increases. This was indeed the less common change in our population (3.6%), and also the component less frequently seen among subjects with MS (15%). A limitation in our study was that the frequency of glucose intolerance in this sample is not known because oral glucose intolerance was not tested.
This research found that MS frequency increased with adiposity, as the syndrome did not occur in any subject with normal weight, and was detected in 7 overweight subjects (8.1%) and 13 obese subjects (18.3%), which agrees with reports by other authors.13,14,49 This frequency of MS in our obese children was however low as compared to other studies such as the one reported by Cruz et al.13 which found 30% affected subjects, the Strufaldi et al. study50 with a 25.8% frequency in obese schoolchildren from Brazil, and the Suazo et al. study,51 which reported a 26.3% rate in obese children aged 6–12 years from Chile. Comparative studies on the type of diet, exercise habits, and heredity will be needed to try and explain this fact. Based on our results, we share the statement by Weiss et al.14 that adiposity is the central factor for MS occurrence regardless of sex, age, and pubertal development.
Sangun et al.41 found in obese children aged 7–18 years a higher MS prevalence in males, as did Cook et al.11 in a sample of subjects aged 12–19 years (6.1 vs 2.1%), with no differences depending on pubertal stage, These findings are similar to those made in our study, where a greater MS frequency (marginally significant) was seen in males. Some authors52,53 think that puberty is one of the periods where insulin resistance is greater and there is therefore a greater probability to develop MS. In our study, no significant difference was found between age groups, and a trend was seen to a higher MS frequency among schoolchildren aged 9–11 years. The association between socioeconomic level and MS is not fully established or understood, and appears to be highly influenced by behavioral factors such as a sedentary lifestyle and intake of high-calorie meals, conditions which are strongly related to the syndrome.54 Our results showed a non-significant trend to more cases of MS in private institutions.
Our conclusion is that MS prevalence in children and adolescents from Municipio Libertador in the city of Mérida is lower than reported in the literature. Universal agreement on MS diagnosis in children and adolescents is needed. Use of references from the population itself in PCs by age and sex as a cut-off point for calculation of MS components should also be emphasized, because use of references from other populations makes overdiagnosis or underdiagnosis likely. Among the classifications studied for MS diagnosis, the Cook et al.11 classification is preferred because it uses PCs for most MS components, thus taking into account changes occurring as the consequence of children growth and development. Since presence of MS components increases in an individual as adiposity increases, it is recommended that obese children are investigated and treated.
Conflicts of interestThe authors state that they have no conflicts of interest.
We would like to thank funding received from the Council of Scientific, Humanistic, Technological, and Art Development of Universidad de Los Andes (CDCHTA-ULA) under project M-1013-11-07-AA and ADG M-10, and also from the National Fund for Science, Technology and Innovation (Fonacit) of the Ministry of Popular Power for Science, Technology and Innovation with project no. 2012000970.
Please cite this article as: Villalobos Reyes M, Mederico M, Paoli de Valeri M, Briceño Y, Zerpa Y, Gómez-Pérez R, et al. Síndrome metabólico en escolares y adolescentes de la ciudad de Mérida-Venezuela: comparación de resultados utilizando valores de referencia locales e internacionales (estudio CREDEFAR). Endocrinol Nutr. 2014;61:474–485.
