


Desensitization of leptin receptors is a process that specifically occurs in some tissues. We have hypothesized that during the development of obesity tissue lipids would increase gradually in particular organs depending on leptin responsiveness. Our aim was to establish a relationship between leptin resistance and lipid deposition by using a model of diet-induced obesity (DIO) and we have characterized, in mice undergoing a dietary treatment with a high-fat (HF) diet, the evolution of lipid content and leptin responsiveness in white adipose tissue and liver.
MethodsFour-week-old male C57BL/6J mice were divided into two groups and assigned either to a low-fat or to a high-fat diet. Dietary treatment lasted 8, 20 or 32 weeks. The last day animals received 1mg/kg leptin and then tissues were weighed and processed for Western-blotting and lipid determination.
ResultsWe observed an initial increase of the relative weight of adipose pads that was blunted after 32-week HF. In contrast, liver size exhibited an initial decrease followed by a progressive increase, which was coincident with the increase of hepatic triglycerides and with the impairment of leptin receptor signalling.
ConclusionOur data show that leptin resistance within white adipose tissue does not deal with an increase of the size of adipose pads and suggest that consequences of leptin resistance, in terms of fat accumulation, are tissue-dependent.
La desensibilización de los receptores de la leptina es un proceso que ocurre de forma específica en algunos tejidos. Comprobamos la hipótesis de si durante el desarrollo de la obesidad, aumentarían los lípidos en tejido de forma progresiva en órganos concretos y en función de la capacidad de respuesta a la leptina. Nuestro objetivo fue establecer una relación entre la resistencia a la leptina y la deposición de lípidos mediante el uso de un modelo de obesidad inducida por dieta (OID) y caracterizamos, en ratones sometidos a un tratamiento dietético con una dieta elevada en grasas (DEG), la evolución del contenido lipídico y la capacidad de respuesta a la leptina en tejido adiposo blanco y en el hígado.
MétodosRatones C57BL/6J machos de cuatro semanas de edad fueron divididos en dos grupos y asignados a una dieta de bajo o de elevado contenido en grasas. El tratamiento dietético duró 8, 20 o 32 semanas. El último día, los animales recibieron 1mg / kg de leptina y luego se pesaron y se procesaron los tejidos para transferencia de tipo Western y la determinación de lípidos.
ResultadosSe observó un aumento inicial en el peso relativo del tejido adiposo, que se redujo después de 32 semanas con DEG. Por otro lado, el tamaño del hígado mostró una descenso inicial, seguido de un aumento progresivo que coincidió con un aumento de los triglicéridos hepáticos y un deterioro en la señalización del receptor de la leptina.
ConclusiónNuestros datos muestran que la resistencia a la leptina en el tejido adiposo blanco no aborda un aumento de tamaño del tejido adiposo y sugiere que las consecuencias de la resistencia a la leptina, en términos de acumulación de grasa, dependen del tejido.
Dietary triglycerides are the main source of fatty acids (FAs) to fulfil energy needs of heart and skeletal muscle. The unconsumed fraction of these nutrients is stored in adipocytes to retrieve energetic deficit during fasting periods. The adipose tissue acts as a trap for the excess of FA liberated from plasma triglycerides1 and when this buffering action is impaired, non-adipose tissues can accumulate FA in the form of triacylglycerol, a condition related with the development of lipotoxicity and metabolic syndrome.2
Regulatory circuits aimed at maintaining energy homeostasis can be experimentally disrupted in rodents by means of high-fat (HF) dietary treatments.3–5 Thus, feeding mice with chow enriched with saturated fat gradually leads to overweight, hyperleptinemia, hypothalamic resistance to leptin and obesity. In a previous work we have observed that mice submitted to 32-week HF treatment exhibit larger WAT deposits than controls together with hyperleptinemia and desensitization of the signal-transducer and activator of transcriprion 3 (STAT3) pathway coupled to leptin receptors.6 Therefore, the possibility of a gradual, time-dependent, desensitization of leptin receptors triggered by HF has focussed our attention. We hypothesize that time-course of leptin resistance during diet-induced obesity (DIO) development might occur differently depending on tissues/organs and we wonder if ectopic accumulation of lipids in a particular tissue/organ would parallel the development of leptin resistance in this tissue/organ.
In order to establish an eventual relationship between leptin resistance and deposition of lipids, we have characterized the evolution of (i) body weight, (ii) weight of different white adipose pads and liver, (iii) lipid content in adipose tissue and liver, and (iv) responsiveness to acute leptin in these tissues, measured in terms of STAT3 phosphorylation. The study has been carried out in C57BL6J mice undergoing a dietary treatment with HF either during 8, 14 and 32 weeks.
Materials and methodsAnimals and dietary treatmentFour-week-old male C57BL/6J mice (CRIFA, Spain) weighing 16–18g were housed under controlled light (12-h light/dark cycles from 8am to 8pm) and temperature (22–24°C) conditions with standard food and water ad libitum. After one week, animals with similar average body weight (BW) were divided into two groups and housed 8–10 per cage and assigned either to a low-fat or to a high-fat diet. Low-fat (10kcal% fat, 70kcal% carbohydrates and 20kcal% protein; 3.85kcal/g) or high-fat (45kcal% fat, 35kcal% carbohydrates, 20kcal% protein; 4.73kcal/g) diets were supplied by Research Diets (USA) and will be referred to as LF and HF, respectively. HF and their respective LF control mice had free access to food either during 8, 14 or 32 weeks. Diet composition (provided by the manufacturer) appears summarized in Table 1. BW and food intake were monitored twice per week. On the last day, mice were weighed and killed by decapitation between 8am and 9am. Blood was collected in chilled EDTA-coated polypropylene tubes and organs immediately dissected and weighed. Plasma samples were frozen for biochemical determinations. The investigation conforms to the Guide for the Care and Use of Laboratory Animals published by the US National Institute of Health (NIH publication no. 85-23, revised 1996).
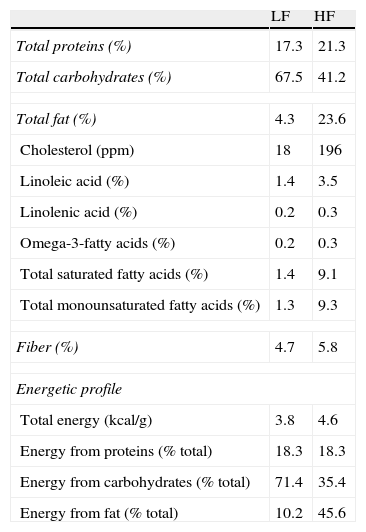
Composition and energetic profile of low-fat (LF) and high-fat (HF) diets.
| LF | HF | |
| Total proteins (%) | 17.3 | 21.3 |
| Total carbohydrates (%) | 67.5 | 41.2 |
| Total fat (%) | 4.3 | 23.6 |
| Cholesterol (ppm) | 18 | 196 |
| Linoleic acid (%) | 1.4 | 3.5 |
| Linolenic acid (%) | 0.2 | 0.3 |
| Omega-3-fatty acids (%) | 0.2 | 0.3 |
| Total saturated fatty acids (%) | 1.4 | 9.1 |
| Total monounsaturated fatty acids (%) | 1.3 | 9.3 |
| Fiber (%) | 4.7 | 5.8 |
| Energetic profile | ||
| Total energy (kcal/g) | 3.8 | 4.6 |
| Energy from proteins (% total) | 18.3 | 18.3 |
| Energy from carbohydrates (% total) | 71.4 | 35.4 |
| Energy from fat (% total) | 10.2 | 45.6 |
Nutritional composition is expressed in % (W/W). Contribution of each component to energy content is expressed as percentage of total calories.
Recombinant murine leptin (1mg/kg) or saline was administered at 9am. After 90min, mice were killed by decapitation and liver, and lumbar and mesenteric adipose tissues were dissected and stored at −80°C until assay.
Plasma measurementsPlasma leptin concentration was analysed using a specific radioimmunoassay (RIA) kit for murine leptin (Linco Research, USA) (4.9% intra-assay variation, 3.3% inter-assay variation). Insulin was determined by means of a specific EIA kit for mouse insulin (Mercodia, Denmark) (2.2% intra-assay variation, 4.9% inter-assay variation). Glucose was measured by a spectrophotometric method (Glucose Trinder Method, Roche, Spain). Triglycerides and free fatty acids were determined using the GPO (Biolabo, France) and ACS-ACOD (Wako, Germany) methods, respectively.
Measurement of total lipid contentLipids were extracted from liver and mesenteric adipose tissue in chloroform/methanol (2/1) following the method of Folch7 with modifications.8
Western blot for phosphorylated signal transducer and activator of transcription 3 (pSTAT3)pSTAT3 was measured in liver and lumbar adipose tissue. Briefly, tissues were homogenized in ice-cold buffer containing 0.42M NaCl, 20mM Hepes (pH 7.9), 1mM Na4P2O7, 1mM EDTA, 1mM EGTA, 1mM dithiothreitol, 20% glycerol, 1μg/ml aprotinin, 1μg/ml leupeptin, 20mM sodium fluoride, 1mM trisodium orthovanadate and 2mM phenylmethylsulfonyl fluoride. Tubes containing homogenates were frozen at −80°C and thawed at 37°C three consecutive times, then centrifuged for 10min at 4°C. Equivalent amounts of proteins (50μg) present in the supernatant were loaded in Laemli buffer (50mM Tris pH=6.8, 10% SDS, 10% glycerol, 5% mercaptoethanol and 2mg/ml blue bromophenol) and size-separated in 15% SDS-polyacrylamide gel electrophoresis. Proteins were transferred to PVDF membranes (Amersham Pharmacia, Spain) using a transblot apparatus (Bio-Rad, Spain). For immunoblotting, membranes were blocked with 5% non-fat dried milk in Tween-PBS (TPBS) for 1h. A primary antibody against pSTAT3 (Tyr705) (Cell Signaling Technology, USA; 1/100 final dilution) or STAT3 (Santa Cruz Biotechnology, USA; 1/1000 final dilution) was applied at the convenient dilution overnight at 4°C. After washing, appropriate secondary antibodies (anti-rabbit IgG-peroxidase conjugated) were applied for 1h at a dilution of 1/5000. Blots were washed, incubated in commercial enhanced chemiluminescence reagents (ECL, Amersham Bioscence, UK) and exposed to autoradiographic film. Films were scanned using a GS-800 Calibrated Densitometer (Bio-Rad, Spain) and blots were quantified using Quantity One software (Bio-Rad, Spain). Values for pSTAT3 were normalized with STAT3.
StatisticsAll variables analysed in this study had a normal distribution. Variations were analysed by a one-way ANOVA, followed by Newman–Keuls’ post hoc test. Statistical significance was set at p<0.05.
ResultsEffect of diet-induced obesity on tissues and body weightObesity was induced in C57BL/6J mice by exposure to a diet in which 45% cal derived from fat. A control group was fed with LF chow, which only yielded 10% cal from fat. As appears illustrated in Fig. 1, animals on HF did not exhibit hyperphagia throughout the treatment.
 High-fat diet; (¿) low-fat diet.")
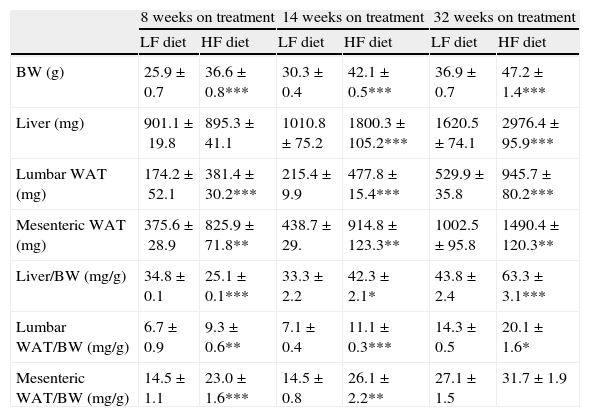
As summarized in Table 2, mice on HF diet exhibited a significant increase of BW after 8 (1-ANOVA F(1,39)=67,653; p<0.001), 14 (F(1,49)=372,907; p<0.001) and 32 weeks (F(1,32)=131,326; p<0.001) on dietary treatment. The HF diet induced a gain of white adipose tissue (WAT), illustrated by the significant increase of lumbar and mesenteric adipose pads. The size of lumbar WAT, compared to the size in the corresponding matched LF groups, increased approximately 24%, 42% and 60% after 8 (1-ANOVA F(1,17)=15,572; p<0.001), 14 (F(1,25)=94,322; p<0.001) and 32 weeks (F(1,32)=13,204; p<0.001) on treatment, respectively. In the case of mesenteric WAT, the increase was 41% (F(1,17)=36,261; p<0.01), 89% (F(1,19)=8731; p<0.01) and 51% (F(1,18)=50,696; p<0.01) at identical time points.
Effect of dietary treatment on body weight and weight of lumbar and mesenteric WAT and liver. Organs and tissues weight is presented both in absolute values and relative to body weight. *p<0.05, **p<0.01, ***p<0.001, compared to the corresponding matched control groups. Newman–Keuls’ test.
| 8 weeks on treatment | 14 weeks on treatment | 32 weeks on treatment | ||||
| LF diet | HF diet | LF diet | HF diet | LF diet | HF diet | |
| BW (g) | 25.9±0.7 | 36.6±0.8*** | 30.3±0.4 | 42.1±0.5*** | 36.9±0.7 | 47.2±1.4*** |
| Liver (mg) | 901.1±19.8 | 895.3±41.1 | 1010.8±75.2 | 1800.3±105.2*** | 1620.5±74.1 | 2976.4±95.9*** |
| Lumbar WAT (mg) | 174.2±52.1 | 381.4±30.2*** | 215.4±9.9 | 477.8±15.4*** | 529.9±35.8 | 945.7±80.2*** |
| Mesenteric WAT (mg) | 375.6±28.9 | 825.9±71.8** | 438.7±29. | 914.8±123.3** | 1002.5±95.8 | 1490.4±120.3** |
| Liver/BW (mg/g) | 34.8±0.1 | 25.1±0.1*** | 33.3±2.2 | 42.3±2.1* | 43.8±2.4 | 63.3±3.1*** |
| Lumbar WAT/BW (mg/g) | 6.7±0.9 | 9.3±0.6** | 7.1±0.4 | 11.1±0.3*** | 14.3±0.5 | 20.1±1.6* |
| Mesenteric WAT/BW (mg/g) | 14.5±1.1 | 23.0±1.6*** | 14.5±0.8 | 26.1±2.2** | 27.1±1.5 | 31.7±1.9 |
We have used the weight of a tissue divided by BW (g) as an index to estimate the influence of dietary treatment on weight accumulation in a particular organ/tissue. Thus, if the index remains unchanged during treatment, one can assume that organ/tissue size progresses in a similar extent than BW does. Our current data show that relative weights of lumbar and mesenteric WAT are increased in HF animals, independently of treatment duration (Table 2), indicating that these tissues gain proportionally more weight than overall BW. Comparison of relative weights between LF and HF groups revealed that the HF diet induced a 66% increase of the relative weight of lumbar WAT after 8 weeks of treatment. Variations determined 14 and 32 weeks after treatment were 85% and 27%, respectively. In the case of mesenteric WAT, variations were 91%, 53% and 19% after 8, 14 or 32 weeks on treatment (Fig. 2). All these data show that the partial contribution of lumbar and mesenteric WAT to BW decreases during the development of DIO, suggesting the accumulation of fat in non-adipose organs.
![(a) Percentage of variation of absolute weight of different organs/tissues induced by 8, 14 and 32 weeks HF diet (compared to low-fat matched controls). Percentages were calculated as [(tissue weight HF/tissue weight LF)−1]×100. (b) Percentage variation of relative weight of different organs/tissues induced by 8, 14 and 32 weeks HF diet. Percentages were calculated as [(relative tissue weight HF/relative tissue weight LF)−1]×100. (¿) Lumbar WAT; (▴) mesenteric WAT; (¿) liver.](https://static.elsevier.es/multimedia/21735093/0000005900000006/v1_201305082351/S2173509312001018/v1_201305082351/en/main.assets/gr2.jpeg?xkr=ue/ImdikoIMrsJoerZ+w997EogCnBdOOD93cPFbanNf23BlP/DWEpPOpuWlfofnysWDelqeaA06g/KrmTTsl2djeVyPLpgkKp/eAiZV1Z2PFTXre8bSOMwSs20k0DCX56sabwN1DkaVPveKNrTCG/60Mf++4ZP3RuQ4fTJC7IqKVVNn/tplJ2bM1s6T6NH7eC4Rn2AzYv0j7sfNf3RfWOjaO+jXSpaZISQ3PYVDBgUhUxHPUrGu7AV/meZMQDekvlYc27EkujU7SzsXtVOAxQ/tKviQqEsZA8VIM4Hg8T4Y= "(a) Percentage of variation of absolute weight of different organs/tissues induced by 8, 14 and 32 weeks HF diet (compared to low-fat matched controls). Percentages were calculated as [(tissue weight HF/tissue weight LF)−1]×100. (b) Percentage variation of relative weight of different organs/tissues induced by 8, 14 and 32 weeks HF diet. Percentages were calculated as [(relative tissue weight HF/relative tissue weight LF)−1]×100. (¿) Lumbar WAT; (▴) mesenteric WAT; (¿) liver.")
(a) Percentage of variation of absolute weight of different organs/tissues induced by 8, 14 and 32 weeks HF diet (compared to low-fat matched controls). Percentages were calculated as [(tissue weight HF/tissue weight LF)−1]×100. (b) Percentage variation of relative weight of different organs/tissues induced by 8, 14 and 32 weeks HF diet. Percentages were calculated as [(relative tissue weight HF/relative tissue weight LF)−1]×100. (¿) Lumbar WAT; (▴) mesenteric WAT; (¿) liver.
In the liver, we detected an increase of weight after 14 (F(1,25)=41,597; p<0.001) and 32 weeks (F(1,32)=55,536; p<0.001) on dietary treatment. In this case relative weights exhibited a progressive 23% and 46% increase after 14 (F(1,24)=6287; p<0.05) and 32 weeks (F(1,32)=30,538; p<0.001), respectively. Fig. 2a (% variation of absolute tissue weight) and b (% variation of relative tissue weight) illustrate the magnitude of body mass flux from WAT deposits toward the liver.
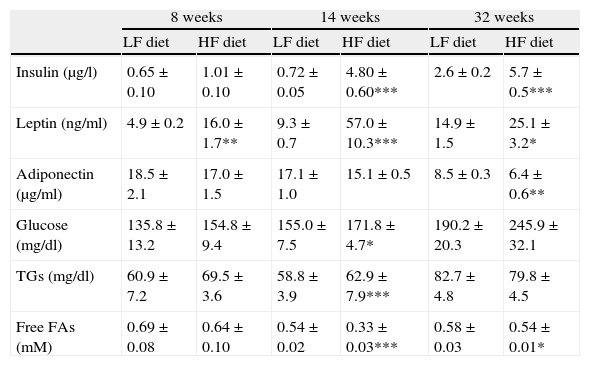
Effect of diet-induced obesity on plasma parametersAs summarized in Table 3, plasma analysis revealed that HF induced significant hyperleptinemia regardless of the duration of dietary treatment. Maximal levels were detected after 14-week HF, and the concentration of the hormone declined from this time point. After 32 weeks of treatment, animals also exhibited hyperleptinemia, but leptin concentration was reduced almost 50%, compared to the maximal level after 14-week HF. Plasma insulin concentration remained unchanged after 8 weeks of treatment but marked hyperinsulinemia was observed both after 14- (p<0.001) and 32-week (p<0.001) HF. Plasma concentration of glucose and free fatty acids (FAs) was also analyzed and we detected an increase of glucose levels after 14-week HF. Free FAs appeared to be decreased both after 14 (p<0.001) and 32 weeks (p<0.05) of dietary treatment. Adiponectin level was not modified by HF until 32 weeks of treatment (p<0.001).
Effect of dietary treatment on plasma biochemistry. *p<0.05, **p<0.01, ***p<0.001, compared to the corresponding matched control groups. Newman–Keuls’ test.
| 8 weeks | 14 weeks | 32 weeks | ||||
| LF diet | HF diet | LF diet | HF diet | LF diet | HF diet | |
| Insulin (μg/l) | 0.65±0.10 | 1.01±0.10 | 0.72±0.05 | 4.80±0.60*** | 2.6±0.2 | 5.7±0.5*** |
| Leptin (ng/ml) | 4.9±0.2 | 16.0±1.7** | 9.3±0.7 | 57.0±10.3*** | 14.9±1.5 | 25.1±3.2* |
| Adiponectin (μg/ml) | 18.5±2.1 | 17.0±1.5 | 17.1±1.0 | 15.1±0.5 | 8.5±0.3 | 6.4±0.6** |
| Glucose (mg/dl) | 135.8±13.2 | 154.8±9.4 | 155.0±7.5 | 171.8±4.7* | 190.2±20.3 | 245.9±32.1 |
| TGs (mg/dl) | 60.9±7.2 | 69.5±3.6 | 58.8±3.9 | 62.9±7.9*** | 82.7±4.8 | 79.8±4.5 |
| Free FAs (mM) | 0.69±0.08 | 0.64±0.10 | 0.54±0.02 | 0.33±0.03*** | 0.58±0.03 | 0.54±0.01* |
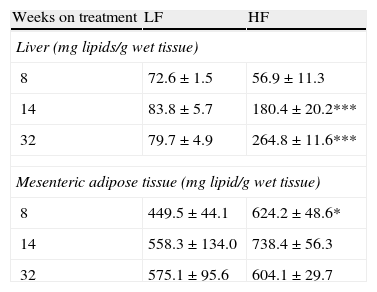
As appears summarized in Table 4, hepatic lipid remained unmodified after 8-week dietary treatment but one-way ANOVA revealed an effect of diet both after 14- (F(1,15)=7873; p<0.05) and 32-week HF (F(1,13)=13,871; p<0.01). In mesenteric adipose tissue total lipid content remained unmodified in lean mice and a significant increase of lipids was detected only after 8-week HF.
Effect of dietary treatment on lipid content in liver and mesenteric adipose tissue. *p<0.05, ***p<0.01 compared to the corresponding matched LF groups (Newman–Keuls’ tests).
| Weeks on treatment | LF | HF |
| Liver (mg lipids/g wet tissue) | ||
| 8 | 72.6±1.5 | 56.9±11.3 |
| 14 | 83.8±5.7 | 180.4±20.2*** |
| 32 | 79.7±4.9 | 264.8±11.6*** |
| Mesenteric adipose tissue (mg lipid/g wet tissue) | ||
| 8 | 449.5±44.1 | 624.2±48.6* |
| 14 | 558.3±134.0 | 738.4±56.3 |
| 32 | 575.1±95.6 | 604.1±29.7 |
To assess the functionality of leptin receptors in different tissues at different time points of dietary treatment, we analyzed the responsiveness to acute leptin both in lumbar WAT and hepatic tissues. Recombinant murine leptin (1mg/kg) was administered i.p. to LF and HF-fed mice and phosphorylated STAT3 (pSTAT3) measured 90min after leptin administration by means of Western blot. Figs. 3 and 4 illustrate the effect of leptin on STAT3 phosphorylation on the above-mentioned tissues at different time points of HF treatment (8, 14 and 32 weeks).
 on STAT phosphorylation (pSTAT3) in liver from mice treated during 8 weeks (a), 14 weeks (b) or 32 weeks (c) with high-fat diet. Upper panels: Immunodetection of STAT3 and pSTAT3 in left ventricle of mice receiving either saline or 1mg/kg leptin. Lower panels: Effect of leptin on STAT3 phosphorylation as the mean±S.E.M. of the ratio pSTAT3/STAT3 (n=5–6 animals) (*p<0.05 compared to their respective saline groups. Newman–Keuls’ test).")
Effect of acute leptin (1mg/kg; i.p.) on STAT phosphorylation (pSTAT3) in liver from mice treated during 8 weeks (a), 14 weeks (b) or 32 weeks (c) with high-fat diet. Upper panels: Immunodetection of STAT3 and pSTAT3 in left ventricle of mice receiving either saline or 1mg/kg leptin. Lower panels: Effect of leptin on STAT3 phosphorylation as the mean±S.E.M. of the ratio pSTAT3/STAT3 (n=5–6 animals) (*p<0.05 compared to their respective saline groups. Newman–Keuls’ test).
 on STAT phosphorylation (pSTAT3) in lumbar adipose tissue from mice treated during 8 weeks (a), 14 weeks (b) or 32 weeks (c) with high-fat diet. Upper panels: Immunodetection of STAT3 and pSTAT3 in left ventricle of mice receiving either saline or 1mg/kg leptin. Lower panels: Effect of leptin on STAT3 phosphorylation as the mean±S.E.M. of the ratio pSTAT3/STAT3 (n=5–6 animals) (*p<0.05 compared to their respective saline groups. Newman–Keuls’ test).")
Effect of acute leptin (1mg/kg; i.p.) on STAT phosphorylation (pSTAT3) in lumbar adipose tissue from mice treated during 8 weeks (a), 14 weeks (b) or 32 weeks (c) with high-fat diet. Upper panels: Immunodetection of STAT3 and pSTAT3 in left ventricle of mice receiving either saline or 1mg/kg leptin. Lower panels: Effect of leptin on STAT3 phosphorylation as the mean±S.E.M. of the ratio pSTAT3/STAT3 (n=5–6 animals) (*p<0.05 compared to their respective saline groups. Newman–Keuls’ test).
Two-way ANOVA revealed that, after 8 weeks on dietary treatment, leptin elicited a significant effect on STAT3 phosphorylation (F(1,14)=8708; p<0.05) which was independent of the type of diet (Fig. 3a). In contrast, in animals undergoing a 14-week treatment schedule, the effect of leptin was dependent on the type of diet (2-ANOVA F(1,12)=4730; p<0.05 for the interaction between treatment with leptin and type of dietary treatment). In this case, one-way ANOVA indicated that the effect of leptin was only significant in LF mice (p<0.05) (Fig. 3b). Finally, after 32-week HF, two-way ANOVA revealed a lack of effect of leptin both in HF and LF mice (Fig. 3c).
Lumbar WATThe effect of leptin on STAT3 phosphorylation in lumbar WAT appears illustrated in Fig. 4a–c. We observed that leptin increased pSTAT3 levels both in LF and HF mice (2-ANOVA F(1,14)=10,612; p<0.01 for leptin treatment; p>0.05, for the interaction between leptin and dietary treatment) after 8-week dietary treatment. Nevertheless no effect of leptin was detected after longer treatments, neither in LF nor in HF animals.
DiscussionThe main result of the current research concerns the gradual uncoupling between leptin receptors and the STAT3 signalling pathway, which suggests that leptin resistance develops differently depending on the type of tissue. In contrast to the arcuate nucleus of the hypothalamus, which displays leptin resistance after short-term HF treatment,5 none of the tissues studied by us (Figs. 3a and 4a) exhibited leptin resistance after 8-week HF. From this time point, we observed that desensitization develops both in liver (Fig. 3b) and lumbar WAT (Fig. 4b) but not in cardiac tissue,4 which preserves leptin responsiveness even after 32-week HF treatment.6 Our results do not imply necessarily that HF induces a complete loss of functionality of leptin receptors, because they are also coupled to other signalling pathways such as Akt, which has been shown to preserve its functionality under conditions leading to desensitization of the STAT3 pathway.6,9
The influence of HF diets on leptin resistance has been the issue of recent research. In addition to the effect of HF-evoked hyperleptinemia, a direct effect of saturated fatty acids cannot be discarded. In fact, partial substitution of the fatty acid component of HF (saturated) diet by unsaturated fatty acids has been shown to trigger antiinflammatory effects, to reduce body mass and to increase leptin responsiveness.10 It has to be noted that the effect of HF diets is not a matter of caloric intake because we have previously shown that mice on HF diet consume the same amount of energy/calories than their LF counterparts.11
The contribution of leptin resistance to the increase of adipose pads during DIO is consistent with the loss of the auto-/paracrine effect of leptin, which has been shown to limit the size of adipose pads by inhibiting lipogenesis and activating lipolysis.12,13 Nevertheless we observed that the evolution of the relative size of lumbar WAT, as also occurs with mesenteric WAT, slightly declined during dietary treatment (Fig. 2). This could be due to an insulin resistance state and argues against the relevance of leptin resistance on WAT pads enlargement in obesity. It also indicates that an eventual auto-/paracrine effect of leptin would be less relevant than generally assumed in basis to the effect elicited by elevated pharmacological concentrations of the hormone.12,13 As illustrated in Fig. 2, the evolution of the relative size of both lumbar and mesenteric WAT during HF treatment suggests that the ability of WAT to buffer the excess of lipids is limited and could be only functional during relatively short periods of dietary lipid overload. In the opposite, hepatic resistance to leptin was accompanied by an increase of the relative hepatic mass (Fig. 2) together with a raise of TG content. This suggests that, in our model, the liver behaves as a TG trap when WAT fails to buffer the excess of dietary fat. This result leads to speculate about the existence of an adipo-hepatic flux of TGs in advanced steps of DIO, which could account for the development of steatotic liver. This is a very relevant issue because it suggests that ectopic accumulation of fat in liver is the result of the inability of the liver to regulate FA catabolism together with an impaired ability of WAT to store TGs. Although both insulin and leptin action has been implicated in the pathogenesis of steatotic liver, it has been recently reported that failure of leptin action is the major mechanism for hepatic steatosis.14 In addition, hepatic insulin resistance has been shown to develop early after HF treatment in C57BL mice.15 Thus the onset of leptin resistance seems to coincide with TG accumulation. Whether leptin resistance accounts for TGs accumulation in liver is an issue that needs further characterization, but it is striking that the onset of hepatic TG increase is coincident with the disruption of hepatic STAT3 pathway, as previously suggested by us.6
We have observed that HF-evoked leptin resistance does not involve simultaneously all tissues. In addition leptin resistance develops differently depending on the signalling pathway studied. Our study also shows that leptin resistance within the adipose tissue is not accompanied by an increase of adiposity. In contrast hepatic leptin resistance deals with hepatic steatosis. Our results also suggest that this kind of dietary treatments would trigger fat liver without hindering the functionality of the Akt pathway (a signalling pathway also coupled to insulin receptors).6 Whether this process is reversible or not would deserve further research and should alert against diets containing elevated content of fat even in non-diabetic/moderately overweight individuals.
In summary, this study provides a longitudinal characterization of the evolution of some key metabolic parameters during the development of DIO. Our data show that the onset of leptin signalling disruption within the liver and WAT is coincident with the onset of hepatic steatosis and suggest that, in this model, the liver acts as a secondary TG trap which become operative when TG accumulation in WAT is impaired. This study further contributes to characterize metabolic changes occurring in DIO models, which is becoming one of the most widely used model to study metabolic alterations linked to obesity.
Disclosure statementThe authors have nothing to disclose.
FundingMinisterio de Ciencia e Innovación (SAF 2008-02703, SAF 2009-09714 and SAF 2010-19603), Fundación Universitaria San Pablo-CEU and Fundación Mutua Madrileña. RG-R is a fellow from Ceu-Universidad San Pablo. MG-O is supported by a grant of Ministerio de Ciencia e Innovación.
Conflict of interestThe authors have no conflict of interest to declare.
We acknowledge J.M. Garrido, I. Bordallo and J. Bravo for skilful animal care.
