


Serum 25-hydroxyvitamin D [25(OH)D] levels are the best indicator of vitamin D levels in the body. Precision, reproducibility, and lack of standardization are the main problems in such measurements. The aim of this study was to compare the 25(OH)D levels measured using Elecsys Vitamin D Total (Roche) and ADVIA Centaur Vitamin D Total (Siemens).
Materials and methods25(OH)D levels were tested in 166 patients using both methods. Patients were subsequently divided into two groups: a “supplemented group” consisting of patients receiving vitamin D supplements, and an “untreated group” consisting of the rest of patients.
Results25(OH)D mean levels measured by the Roche and Siemens methods in the overall group were 33.6±16.0 and 19.8±12.4ng/mL, respectively. 54.2% of patients were receiving vitamin D supplements. In this group, mean 25(OH)D levels measured by the Roche and Siemens methods were 40.6±14.5 and 25.4±13.1ng/mL, respectively. In the untreated group, the respective values were 24.9±13.2 and 12.8±6.6ng/mL. Prevalence of vitamin D deficiency (serum 25(OH)D levels less than 20ng/mL) was higher in samples analyzed using the Siemens method (60.2%) as compared to those tested using the Roche method (23.5%).
ConclusionThe assays evaluated are not comparable to each other. Laboratory technicians should inform clinicians of the features of the method used for measuring 25(OH)D because this will have a direct impact on interpretation of the results and medical decisions.
La determinación en suero de 25-hidroxivitamina D [25(OH)D] es el mejor indicador del nivel de vitamina D en el organismo. El principal problema en su determinación es la precisión, reproducibilidad y la falta de estandarización de los métodos disponibles. Nuestro objetivo es comparar los resultados de 25(OH)D medidos por Elecsys Vitamin D Total (Roche) y ADVIA Centaur Vitamin D Total (Siemens)
Material y métodosSe analizaron las concentraciones de 25(OH)D en 166 pacientes por ambos métodos. Tras el estudio del total de los pacientes, se consideraron 2 grupos: el grupo suplementado formado por los pacientes que recibían suplementos de vitamina D y el grupo sin tratamiento formado por el resto de pacientes.
ResultadosEl valor medio de 25(OH)D en el grupo general medido por Roche y por Siemens fue 33,6±16,0 y 19,8±12,4ng/ml, respectivamente. El 54,2% de los pacientes recibían suplementos de vitamina D. En este grupo el valor medio de 25(OH)D medido por Roche y por Siemens fue 40,6±14,5 y 25,4±13,1ng/ml; y en el grupo de pacientes sin tratamiento fue 24,9±13,2 y 12,8±6,6ng/ml, respectivamente. La prevalencia de la insuficiencia de vitamina D (concentraciones séricas de 25(OH)D inferiores a 20ng/ml) fue más alta para las muestras medidas por Siemens (60,2%) que para las medidas por Roche (23,5%).
ConclusiónLos análisis evaluados no son comparables entre sí. Los especialistas del laboratorio deben informar a los clínicos de las características del método empleado en la determinación de 25(OH)D ya que tendrá consecuencias directas en la interpretación y decisión médica.
Interest in vitamin D has increased in recent years with advances in our understanding of its effects on both bone and other tissues, which may have significant physiological and pathological implications in different immune diseases, cancer, and cardiovascular disease.1–4
There are two forms of vitamin D, vitamin D3 or cholecalciferol, which is physiological in humans (the most abundant in circulation), and vitamin D2 or ergocalciferol, obtained from diet after eating food of vegetable origin. Both forms are available in pharmacological supplements or fortified foods.
Calcidiol or 25-hydroxyvitamin D [25(OH)D] is the main precursor of calcitriol, a biologically active metabolite of the vitamin D hormonal system. Its half-life and high serum concentration have made it the best marker of vitamin D levels.
The measurement of 25(OH)D poses some challenges, such as the high lipophilicity of the molecule, transport protein binding, the existence of two similar structural forms of different origin (endogenous or exogenous) with multiple metabolites,5 and the precision and reproducibility of the available methods.6
In 2010, Tai et al.7 developed a liquid chromatography–tandem mass spectrometry (LC–MS/MS) method which was later recognized as the reference method for 25(OH)D measurement by the Joint Committee for Traceability in Laboratory Medicine. Its complexity and the need for staff highly specialized in its use make it a procedure of little value in daily practice.
The recent availability of automated immunoassays makes it possible to cope with the increased demand for vitamin D measurement in health care.
The study objective was to compare the 25(OH)D levels measured using two of the currently marketed immunoassays and to check their impact on patient classification in terms of whether patients are regarded as having sufficient, deficient, or insufficient vitamin D levels.
Patients and methodsStudy settingAn observational, descriptive, cross-sectional study conducted at the biological diagnosis area of Hospital Universitario La Ribera (Alzira). This hospital covers a population of 260,000 inhabitants and is located in the Valencian Community (5,111,706 inhabitants).
PatientsSerum samples from 166 patients (57.2% females and 42.8% males; mean age, 64.7±15.5 years) attending Hospital Universitario La Ribera or its primary care center during May and June 2012 for routine blood tests including serum vitamin D measurement were tested. The study sample consisted of patients with chronic renal disease, parathyroid disease, osteoporosis, fractures, endocrine or autoimmune diseases with renal involvement, ricketts, or osteomalacia.
Ninety-two patients (52.4%) were receiving vitamin D supplements.
Samples were stored at −20°C until analysis. They were tested in batches, using a newly frozen aliquot for each test.
Method comparison25(OH)D levels measured using the Elecsys Vitamin D Total assay in a Cobas e411 (Roche) and the ADVIA Centaur Vitamin D Total assay in an Advia Centaur XP (Siemens) were compared. Both methods were performed in accordance with the manufacturer's instructions.
Elecsys Vitamin D Total (Roche, Mannheim, Germany)Elecsys Vitamin D Total (Roche) is a competitive protein binding immunoassay with electrochemiluminescence (ECLIA) detection. The latest version of this assay, marketed after modification by the manufacturer, was used.
Dithiothreitol and sodium hydroxide were used to free 25(OH)D from its binding plasma protein. Samples were then incubated with vitamin D binding protein labelled with ruthenium. Biotinylated 25(OH)D was subsequently added to occupy the vacant sites in the binding protein. When an electrical current is applied to the reading cell, the chemiluminescent reaction occurs.
The functional sensitivity of the assay is 4.0ng/mL (10.0nmol/L). Assay specificity, reflected by the percentage of cross reactivity with other metabolites, is 98% for 25(OH)D3, 81% for 25(OH)D2, and 93% for the C3 epimer of 25(OH)D3.
ADVIA Centaur Vitamin D Total (Siemens, Frimley Camberley, United Kingdom)ADVIA Centaur Vitamin D Total (Siemens) is a one-step competitive immunoassay. This assay uses a releasing agent in saline buffer with sodium azide, an anti-fluorescein mouse monoclonal antibody covalently bound to paramagnetic particles, a mouse anti-25(OH)D monoclonal antibody labeled with acridinium ester, and a vitamin D analogue labeled with fluorescein.
The functional sensitivity of the assay is 3,3ng/mL (8.3nmol/L). Assay specificity, reflected by the percentage of cross reactivity with other metabolites, is 97.4% for 25(OH)D3, 106.2% for 25(OH)D2, and 1% for the C3 epimer of 25(OH)D3.
Statistical analysisThe results of the 166 samples were analyzed using a Bland–Altman plot, Passing-Bablok regression, concordance correlation coefficient (CCC), and kappa (k). Data distribution was analyzed using box plots. 25(OH)D values were expressed in ng/mL (1ng/dL is equivalent to 2.5nmol/L). Medcalc version 12.3.0 software was used for statistical analysis. Values of p<0.005 were considered statistically significant.
After testing all samples, two groups were established: a supplemented group, consisting of the 92 samples of patients receiving supplemental Vitamin D3, and an untreated group consisting of samples from the 74 patients not receiving vitamin D3 supplements. No patient was being treated with vitamin D2 supplements. Patient categorization was done after a literature review which suggested that some assays measuring 25(OH)D may not be able to recognize its exogenous fraction, i.e. 25(OH)D administered with pharmacological supplements or in diet.8
Bland–Altman analysisBland–Altman analysis9,10 is a graphic method for comparing two measurement procedures. In this method, differences (or proportions) between the two procedures are represented against the means of both. The limits of agreement are defined as the mean difference ±1.96 times the standard deviation of the differences. If these limits are not clinically relevant, either procedure may be used.
Passing-Bablok regressionPassing-Bablok regression11 is a linear regression procedure that calculates a regression equation including the 95% confidence interval (CI) of the intercept (A) and slope (B). This procedure requires that the variables are continuous and that a linear relationship exists between the two methods.
A is a measure of constant systematic differences between the two methods. The 95% CI of A may be used to test the hypothesis that A=0. If the hypothesis is rejected, there are constant systematic differences between them.
B is a measure of proportional systematic differences between the two methods. The 95% CI of B may be used to test the hypothesis that B=1. If the hypothesis is rejected, there are proportional systematic differences between them.
The residual standard deviation (RSD) is a measure of random differences between the two methods. Ninety-five percent of random differences are expected to be within the range of ±1.96 times RSD. If this range is wide, theymay not be comparable.
The linearity hypothesis is verified using the cumulative sum linearity test (CUSUM test). A value of p<0.05 suggests a significant deviation from linearity.
Concordance correlation coefficientThe concordance correlation coefficient (CCC)12,13 assesses the degree to which pairs of measurements fall on the line that crosses the origin at a 45° angle. It is the result of the product of Pearson's correlation coefficient (a measure of precision) and the bias correction factor (a measure of accuracy). Results higher than 0.99 suggest excellent concordance; those between 0.99 and 0.95, substantial concordance; values ranging from 0.90 to 0.94, moderate concordance; and those <0.9, poor concordance.14
Assessment of concordance of 25(OH)D concentrationsThe position statement on vitamin D requirements and optimum concentrations prepared by the Spanish Society of Bone and Mineral Metabolism Research (SEIOMM) and other related societies was used as a guide.15 Vitamin D sufficiency was defined as serum 25(OH)D concentrations higher than 30ng/ml (>75nmol/L), vitamin D insufficiency as serum 25(OH)D concentrations ranging from 20 to 30ng/mL (50–75nmol/L), and vitamin D deficiency as serum 25(OH)D concentrations less than 20ng/mL (<50nmol/L).
Inter-assay agreement in assessment of vitamin D status was evaluated using k,16,17 with values of k less than 0.4 indicating poor agreement; values ranging from 0.4 to 0.75, fair to good agreement; and values higher than 0.75, excellent agreement.
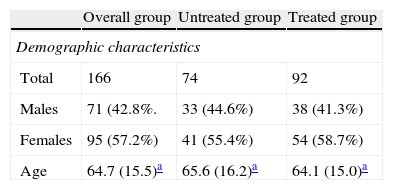
ResultsAssay comparisonTable 1 summarizes the 25(OH)D values measured by Elecsys Vitamin D Total (Roche) and ADVIA Centaur Vitamin D Total (Siemens) and group characteristics. Individual data distribution in the overall group illustrates the significant differences between the assays for these samples (Fig. 1).
Demographic characteristics and statistical parameters of the patient groups studied by 25(OH)D assay.
| Overall group | Untreated group | Treated group | |
| Demographic characteristics | |||
| Total | 166 | 74 | 92 |
| Males | 71 (42.8%. | 33 (44.6%) | 38 (41.3%) |
| Females | 95 (57.2%) | 41 (55.4%) | 54 (58.7%) |
| Age | 64.7 (15.5)a | 65.6 (16.2)a | 64.1 (15.0)a |
| Roche | Siemens | Roche | Siemens | Roche | Siemens | |
| Statistical summary | ||||||
| Mean (ng/mL) | 33.6 | 19.8 | 24.9 | 12.8 | 40.6 | 25.4 |
| 95% CI | 31.2–36.0 | 17.9–21.7 | 21.8.27.9 | 11.3–14.3 | 37.6–43.6 | 22.7–28.1 |
| Variance | 254.5 | 153.4 | 174.4 | 43.0 | 210.2 | 172.3 |
| Standard deviation | 16.0 | 12.4 | 13.2 | 6.6 | 14.5 | 13.1 |
| Median (ng/mL) | 32.2 | 16.2 | 22.5 | 11.1 | 39.9 | 22.7 |
| 95% CI | 29.6–35.1 | 14.0–18.8 | 18.1–26.8 | 9.8–12.2 | 35.8–45.1 | 19.9–26.4 |
| Minimum (ng/mL) | 5.0 | 4.5 | 5.0 | 4.5 | 9.9 | 7.3 |
| Maximum (ng/mL) | 68.5 | 63.3 | 68.1 | 38.7 | 68.5 | 63.3 |
| Normal distribution | 0.0005 | <0.0001 | 0.0108 | <0.0001 | 0.1088 | 0.0051 |
CI: confidence interval.
D concentrations (ng/mL) measured by the Elecsys Vitamin D Total (Roche) and the ADVIA Centaur Vitamin D Total (Siemens) assays.")
Fig. 2 shows, using Bland–Altman analysis, agreement between the results obtained with the Elecsys Vitamin D Total (Roche) and ADVIA Centaur Vitamin D Total (Siemens) assays. The mean value of bias was higher for the treated group (15.2ng/mL [38.0nmol/L]) as compared to the untreated group (12.1ng/mL [30.3nmol/L]). Graphically, greater agreement was seen between the two assays when patients receiving vitamin D supplements were excluded. The scattering of the results obtained (positive trend in both groups) indicated that the degree of agreement decreased the higher the 25(OH)D concentration measured.
. (A) All patients; (B) supplemented group; and (C) group without supplement.")
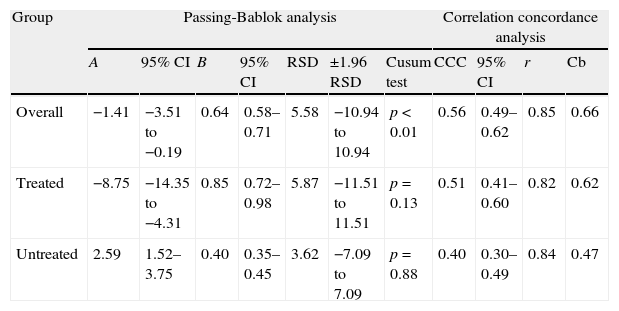
Table 2 shows the results of both Passing-Bablok regression and CCC analysis.
Passing-Bablok and correlation concordance analyses between the Elecsys Vitamin D Total (Roche) and ADVIA Centaur Vitamin D Total (Siemens) assays in all patient groups.
| Group | Passing-Bablok analysis | Correlation concordance analysis | |||||||||
| A | 95% CI | B | 95% CI | RSD | ±1.96 RSD | Cusum test | CCC | 95% CI | r | Cb | |
| Overall | −1.41 | −3.51 to −0.19 | 0.64 | 0.58–0.71 | 5.58 | −10.94 to 10.94 | p<0.01 | 0.56 | 0.49–0.62 | 0.85 | 0.66 |
| Treated | −8.75 | −14.35 to −4.31 | 0.85 | 0.72–0.98 | 5.87 | −11.51 to 11.51 | p=0.13 | 0.51 | 0.41–0.60 | 0.82 | 0.62 |
| Untreated | 2.59 | 1.52–3.75 | 0.40 | 0.35–0.45 | 3.62 | −7.09 to 7.09 | p=0.88 | 0.40 | 0.30–0.49 | 0.84 | 0.47 |
A: intercept; B: slope; Cb: bias correction factor; CCC: concordance correlation coefficient; CI: confidence interval; r: Pearson's correlation coefficient; RSD: residual standard deviation.
A comparison was made of the proportion of samples classified into the different vitamin D states based on serum 25(OH)D concentrations measured by both procedures.
If we consider the three possible vitamin D states proposed by the SEIOMM, similar k values were found both for the overall group and for the treated and untreated groups (k=0.2; k=0.1; k=0.1, respectively). If 20ng/mL (50nmol/L) was only used as the cut-off point, lower values being considered clearly pathological, similar k values were also found both overall and in the treated and untreated groups (k=0.3; k=0.2; k=0.2, respectively).
Siemens proposes different cut-off values for its ADVIA Centaur Vitamin D Total assay (10631296_ES Rev.C, 2011-01). This manufacturer defines vitamin D deficiency as serum 25(OH)D concentrations less than 10ng/mL (<25nmol/L). When this cut-off point was used to classify the results of this assay, similar k values were obtained both in the overall group and in the treated and untreated groups (k=0.8; k=0.7; k=0.8, respectively).
DiscussionIn this study, lower 25(OH)D concentrations (mean value=19.8ng/mL [49.5nmol/L]) were obtained with the ADVIA Centaur Vitamin D Total assay (Siemens) as compared to the Elecsys Vitamin D Total assay (Roche) (mean value=33.6ng/mL [84.0nmol/L]).
Significant differences were found in all the statistical tests performed. The Bland–Altman analysis showed greater bias or systematic error in the group of patients treated with supplements (Fig. 2). Although acceptable values of Pearson's correlation coefficient were found (Table 2), the results of CCC lower than 0.9 found in all groups suggest poor agreement between these two methods. As regards Passing-Bablok regression, proportional and constant errors were simultaneously found in the study groups (Table 2).
These differences between the methods could be due to the assay design itself. If the specificity reported by the manufacturers is analyzed in more detail, special mention should be made of cross-reactivity to the C3 epimer of 25(OH)D3. Cross-reactivity is 93% and 1% for the Roche and Siemens assays, respectively. It is now known that this epimer is present in serum samples from both children and adults. The concentrations found range from 0.1ng/mL to 47.0ng/mL (0.25–117.5nmol/L),18,19 and some authors therefore state that their measurement in adult patients is of special interest when 25(OH)D levels are low.20 In addition, both methods use different pre-treatment steps to release 25(OH)D from vitamin D binding protein, which results in a lower level of 25(OH)D suitable for measurement. The design of the antibodies used in the Siemens assay may also influence the differences found. The monoclonal nature of these antibodies could result in the non-recognition of some derivative of exogenous vitamin D that does not express the epitope against which they were designed.
Our study has some limitations. One limitation was the use of frozen serum samples to compare the methods. Samples were frozen at −20°C and thawed at room temperature only once. However, prior studies on samples subject to multiple freezing–thawing cycles21 show that 25(OH)D concentrations should not have been affected.
An additional limitation was that no measurement was taken using the reference method. This limitation is common to most published studies, because the availability of LC–MS/MS in the clinical setting is restricted due to both the complexity of the method and to the increased demand for this measurement.
In prior studies, both methods showed a good correlation when compared to LC–MS/MS, but the results found with ADVIA Centaur Vitamin D Total (Siemens) showed a negative systematic error (−4.3%), while the results of Elecsys Vitamin D Total (Roche) showed a positive systematic error (17.4%).22
A final limitation was that not all assays available in Spain for 25(OH)D measurement were studied due to the lack of adequate means.
As regards patient classification, no agreement was found between the methods when values proposed by the SEIOMM were used (k<0.4). There were significant differences in the prevalence of vitamin D insufficiency between the tested assays. In all patient groups, a much higher prevalence was found with the Siemens assay (60.2%, 40.2%, and 85.1% in the overall, treated and untreated groups, respectively) as compared to the Roche assay (23.5, 7.6, and 43.2%, respectively). This means that some patients may receive a pharmacological treatment they do not need if the Siemens assay is used, or receive no treatment if the Roche assay is used. Agreement in patient classification improves (k=0.7–0.8) when the reference values for the ADVIA Centaur Vitamin D Total assay proposed by the manufacturer are used, although these do not agree with those proposed by scientific bodies.
It has been widely reported that the prevalence of vitamin D deficiency represents a public health problem affecting more than 50% of the general population.3 The prevalence of vitamin D deficiency in Spain is 28% in young people23 and approximately 65% in healthy adults.24 This generalized hypovitaminosis state may partly be influenced by the testing method used to measure 25(OH)D concentrations.
Because of these discrepancies, the standardization of immunoassays for measuring vitamin D with adequate reference material is an imperative need which has previously been suggested by other groups.25 With the launching of standard reference material (SRM) 972 by the US National Institute of Standards and Technology (NIST) and the implementation in 2010 of the Vitamin D Standardization Program (VDSP), the harmonization of all vitamin D assays is expected.26,27
In conclusion, the assays evaluated in this study are not comparable, despite their acceptable correlation with the reference method shown in prior publications. Patients should therefore be monitored with the same method throughout their treatment.
If the method used to assess vitamin D is changed, the laboratory should inform clinicians on the characteristics of the new method, because differences between the vitamin D levels measured by the different assays will have direct consequences on both medical interpretation and decision making.
Conflicts of interestThe authors state that they have no conflicts of interest.
Please cite this article as: Górriz Pintado S, Estela Burriel PL. Influencia del inmunoensayo empleado en la determinación de vitamina D sérica. Endocrinol Nutr. 2014;61:123–129.
