


To report the prevalence of obesity in a Spanish working population and its changes in recent years.
Material and methodsData were collected from routine medical examinations performed on workers by a national mutual insurance society for occupational accidents and diseases (Ibermutuamur). A structured questionnaire was completed and physical examinations were performed. Overweight was defined as BMI ranging from 25 and 29.9, obesity as BMI of 30–39.9, and morbid obesity as BMI≥40kg/m2.
ResultsData from 1,336,055 medical examinations performed from May 2004 to November 2007 were collected. Prevalence rates in the population examined in 2004 (n=230,684; 73% males; average age, 36.4 years) were: morbid obesity, 0.5% (0.6% males, 0.5% females); obesity, 14.5% (17.0% males, 7.7% females); overweight, 38.4% (44.8% males, 21.3% females). Prevalence rates of obesity and overweight were higher in blue-collar workers (16.4% and 40.5% respectively) as compared to white-collar workers (10.9% and 34.4% respectively). There was a progressive increase in prevalence of obesity during the 4-year study (2004–2007) in both males (17.0%, 17.6%, 17.9%, 18.2%) and females (7.6%, 8.0%, 8.4%, 8.7%).
ConclusionsPrevalence of obesity and overweight in the Spanish working population is high, especially in male blue-collar workers, and is increasing. There is a need to promote early prevention programs and specific treatments for obesity.
Describir la prevalencia de la obesidad y su evolución reciente en una población laboral en España.
Material y métodoSe recogieron los datos de los chequeos médicos rutinarios practicados a trabajadores por la Mutua de Accidentes de Trabajo y Enfermedades Profesionales de la Seguridad Social (Ibermutuamur). Se realizó exploración física y se empleó un formulario estructurado para recoger los datos. Se consideró que un individuo tenía sobrepeso si su índice de masa corporal (IMC) estaba entre 25-29,9, obesidad entre 30-39,9 y obesidad mórbida si era de 40kg/m2 o mayor.
ResultadosSe incluyeron datos de 1.336.055 chequeos médicos realizados entre mayo de 2004 y noviembre de 2007. En los trabajadores examinados en 2004 (n=230.684; 73% hombres; edad promedio, 36,4 años) las prevalencias fueron: obesidad mórbida: 0,5% (0,6% hombres, 0,5% mujeres), obesidad: 14,5% (17,0% hombres, 7,7% mujeres), sobrepeso: 38,4% (44,8% hombres, 21,3% mujeres); las prevalencias de obesidad y sobrepeso fueron mayores entre los trabajadores manuales (16,4 y 40,5%, respectivamente) que entre los trabajadores intelectuales (10,9 y 34,4%, respectivamente). Se observó un incremento progresivo en la prevalencia de obesidad a lo largo de los 4 años evaluados (2004-2007), tanto en hombres (17,0, 17,6, 17,9 y 18,2%) como en mujeres (7,6, 8,0, 8,4 y 8,7%).
ConclusionesLa prevalencia de obesidad y sobrepeso en una población laboral en España es alta, especialmente entre los trabajadores manuales varones, y va en aumento. Es necesario promover programas de prevención temprana y tratamientos específicos para la obesidad.
Obesity represents an increasing health problem because of the continuous increase in its worldwide incidence during the last decades and its impact on morbidity, mortality, quality of life, and healthcare costs.1,2 Lifestyle changes and decreased physical activity are determinant factors of the global impact of obesity.3 Although leisure time physical activity has slightly increased in industrialized countries, current patterns, as well as long-term trends, suggest that an effective decrease of physical activity in general, and specifically of work-related activity is occurring.2,4
Obesity prevalence in Spain is high5 and shows an upward trend, as occurs in all other industrialized countries.2,6 The available epidemiological data come from local7 or regional8–12 studies and from surveys with anthropometric data provided by the surveyed subjects themselves,13 who often underestimate their weight and overestimate their height. The reported obesity data may therefore be lower than the actual data.14 Moreover, the working population is often underrepresented in epidemiological studies conducted in the general population because people are less willing to participate in studies that require them to devote time during working hours.
This study analyzes the prevalence of obesity in a Spanish working population in order to collect up-to-date data and to report its prevalence as a function of the different types of occupation. Data collected during routine medical check-ups performed on active workers throughout Spain for 4 consecutive years allowed these objectives to be explored.
Subjects and methodsStudy designThis was an observational, cross-sectional, epidemiological study including data from routine medical check-ups given to active workers between 2004 and 2007. The sample consisted of workers whose employers had agreements for the provision of health services with Ibermutuamur, a mutual insurance society for occupational accidents and diseases that complements the social security system in Spain. Ibermutuamur covers more than 1,100,000 workers from all Spanish regions, and its Prevention Society performs more than 400,000 medical check-ups every year. This study is part of the Ibermutuamur CArdiovascular RIsk Assessment (ICARIA) plan, which has been applied in all medical check-ups performed at the facilities of the Ibermutuamur Prevention Society since 2004.15
Study population and measurementsWorkers who underwent routine medical check-ups performed by the Ibermutuamur Prevention Society between May 2004 and November 2007 were enrolled into the study. When more than one medical check-up was recorded for the same year, only data from the oldest check-up (the one with the earliest date) were considered. A structured questionnaire was used to transfer data from the clinical records. The physical examination included direct measurements of weight and height (in light clothes and without shoes) to calculate body mass index (BMI), an estimator of body fat mass.
Workers were classified by BMI into the following categories:16
- •
Normal weight, BMI<25kg/m2.
- •
Overweight, BMI≥25kg/m2 and <30kg/m2.
- •
Obesity, BMI≥30kg/m2.
- •
Morbid obesity, BMI≥40kg/m2.
As regards occupation, workers were classified into two main occupational categories based on the Spanish 1994 National Classification of Occupations:17
- •
Manual or blue-collar workers, including those in the restaurant industry and in personal services, protection and security services; shop assistants and similar occupations; craftsmen; skilled workers in the farming and fishing industries; skilled workers in the manufacturing, construction, and mining industries; plant and machinery operators; assembly and non-skilled workers.
- •
Clerical or white-collar workers, including managers from public and private organizations; intellectuals; scientific and technical support staff, and clerks.
This study was conducted in compliance with the principles of the Declaration of Helsinki. The ethics committee of Ibermutuamur approved the study, and each worker signed an informed consent authorizing the use of their data. Data confidentiality was guaranteed in accordance to the applicable Spanish law on personal data protection.
Statistical analysisData were analyzed using statistical SAS software (SAS Institute Inc., Cary, NC Carolina, USA). Categorical variables are given as percentages with 85% confidence intervals (CIs). Continuous variables are given as mean and standard deviation (SD).
ResultsData from the 1,395,398 medical check-ups done between 2004 and 2007 were analyzed. Check-ups with incomplete clinical data on sex, age, occupational information, or BMI were excluded. The first cohort included 230,684 workers examined in 2004. The next cohorts included 380,996 workers examined in 2005; 389,681 in 2006, and 394,037 in 2007.
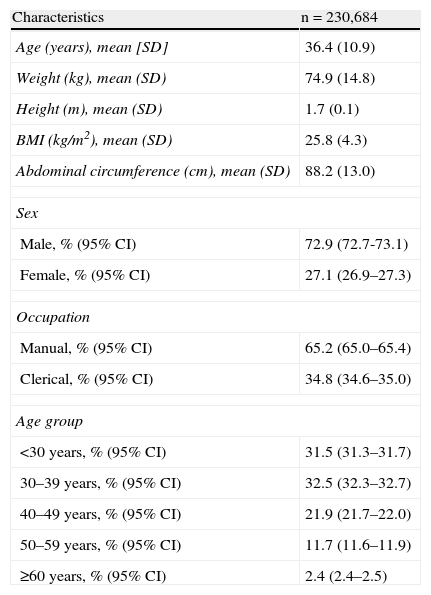
In the 2004 cohort, 72.9% of subjects were men, the mean age was 36.4 years, and approximately two thirds were manual workers. Their sociodemographic and clinical characteristics are shown in Table 1. The proportions of men and subjects in the younger age groups were greater in this sample than in a recent active population survey in Spain, in which 55.7% were men.18
Sociodemographic and clinical characteristics of subjects enrolled into the 2004 cohort.
| Characteristics | n=230,684 |
| Age (years), mean [SD] | 36.4 (10.9) |
| Weight (kg), mean (SD) | 74.9 (14.8) |
| Height (m), mean (SD) | 1.7 (0.1) |
| BMI (kg/m2), mean (SD) | 25.8 (4.3) |
| Abdominal circumference (cm), mean (SD) | 88.2 (13.0) |
| Sex | |
| Male, % (95% CI) | 72.9 (72.7-73.1) |
| Female, % (95% CI) | 27.1 (26.9–27.3) |
| Occupation | |
| Manual, % (95% CI) | 65.2 (65.0–65.4) |
| Clerical, % (95% CI) | 34.8 (34.6–35.0) |
| Age group | |
| <30 years, % (95% CI) | 31.5 (31.3–31.7) |
| 30–39 years, % (95% CI) | 32.5 (32.3–32.7) |
| 40–49 years, % (95% CI) | 21.9 (21.7–22.0) |
| 50–59 years, % (95% CI) | 11.7 (11.6–11.9) |
| ≥60 years, % (95% CI) | 2.4 (2.4–2.5) |
SD: standard deviation; CI: confidence interval; BMI: body mass index.
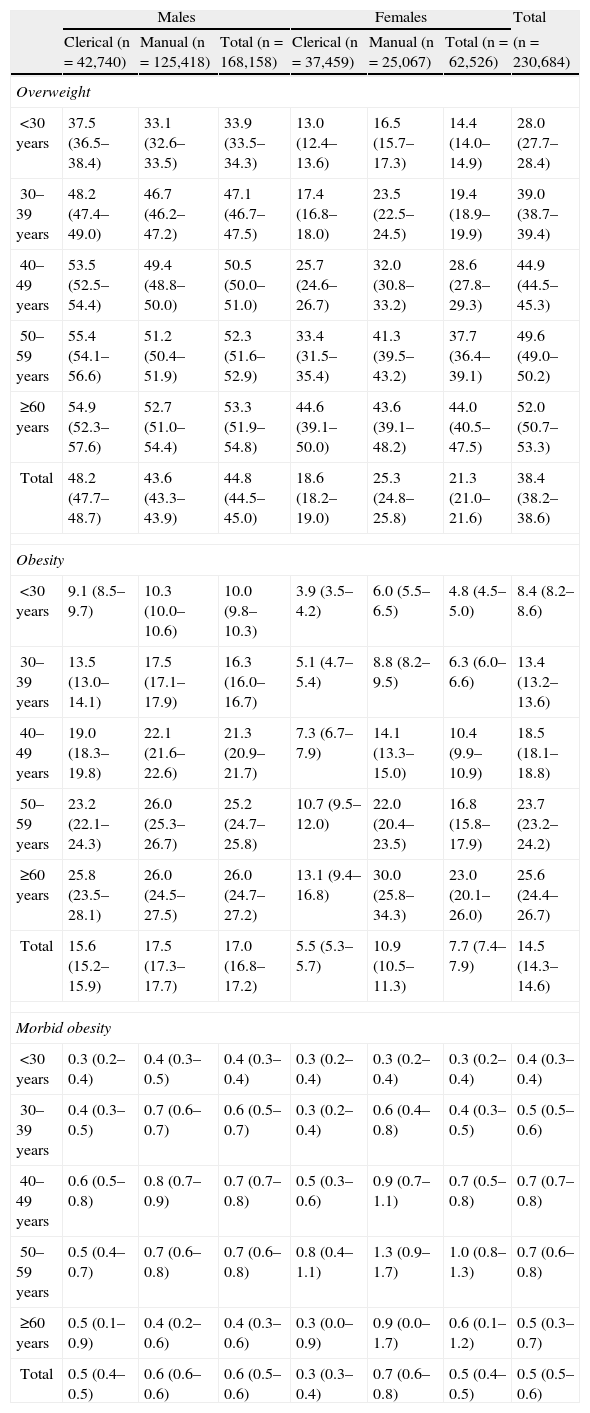
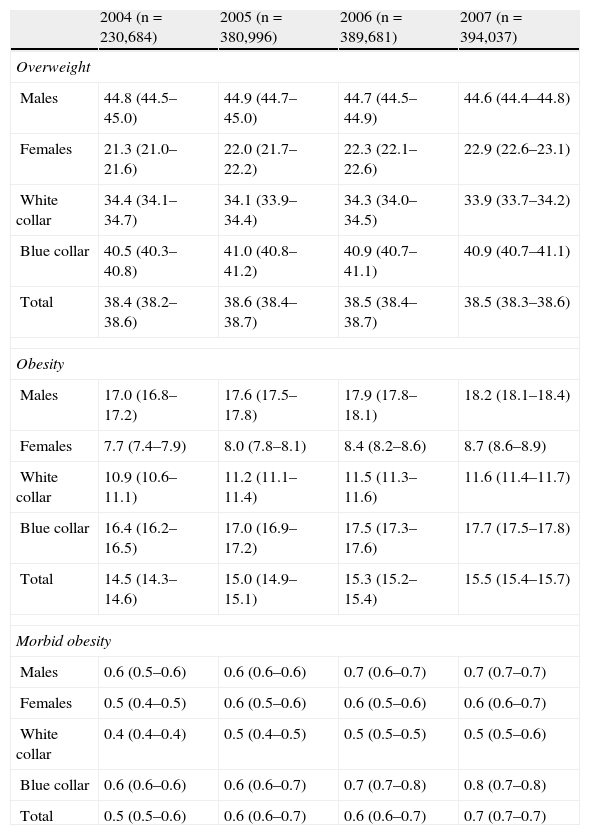
The prevalence of obesity, including morbid obesity, was 14.9% (17.6% and 8.2% in men and women respectively). The prevalence of overweight was 38.4% (44.8% in men and 21.3% in women). A progressive increase in the prevalence of obesity and overweight was seen with age (Table 2). A continued increase in the prevalence of obesity was also seen during the four-year period analyzed. Such increases occurred both in men and women (Table 3). Only women experienced a gradual increase in the prevalence of overweight over the four-year period (Table 3).
Prevalence of overweight and obesity by age, sex, and type of occupation in the 2004 cohort.
| Males | Females | Total | |||||
| Clerical (n=42,740) | Manual (n=125,418) | Total (n=168,158) | Clerical (n=37,459) | Manual (n=25,067) | Total (n=62,526) | (n=230,684) | |
| Overweight | |||||||
| <30 years | 37.5 (36.5–38.4) | 33.1 (32.6–33.5) | 33.9 (33.5–34.3) | 13.0 (12.4–13.6) | 16.5 (15.7–17.3) | 14.4 (14.0–14.9) | 28.0 (27.7–28.4) |
| 30–39 years | 48.2 (47.4–49.0) | 46.7 (46.2–47.2) | 47.1 (46.7–47.5) | 17.4 (16.8–18.0) | 23.5 (22.5–24.5) | 19.4 (18.9–19.9) | 39.0 (38.7–39.4) |
| 40–49 years | 53.5 (52.5–54.4) | 49.4 (48.8–50.0) | 50.5 (50.0–51.0) | 25.7 (24.6–26.7) | 32.0 (30.8–33.2) | 28.6 (27.8–29.3) | 44.9 (44.5–45.3) |
| 50–59 years | 55.4 (54.1–56.6) | 51.2 (50.4–51.9) | 52.3 (51.6–52.9) | 33.4 (31.5–35.4) | 41.3 (39.5–43.2) | 37.7 (36.4–39.1) | 49.6 (49.0–50.2) |
| ≥60 years | 54.9 (52.3–57.6) | 52.7 (51.0–54.4) | 53.3 (51.9–54.8) | 44.6 (39.1–50.0) | 43.6 (39.1–48.2) | 44.0 (40.5–47.5) | 52.0 (50.7–53.3) |
| Total | 48.2 (47.7–48.7) | 43.6 (43.3–43.9) | 44.8 (44.5–45.0) | 18.6 (18.2–19.0) | 25.3 (24.8–25.8) | 21.3 (21.0–21.6) | 38.4 (38.2–38.6) |
| Obesity | |||||||
| <30 years | 9.1 (8.5–9.7) | 10.3 (10.0–10.6) | 10.0 (9.8–10.3) | 3.9 (3.5–4.2) | 6.0 (5.5–6.5) | 4.8 (4.5–5.0) | 8.4 (8.2–8.6) |
| 30–39 years | 13.5 (13.0–14.1) | 17.5 (17.1–17.9) | 16.3 (16.0–16.7) | 5.1 (4.7–5.4) | 8.8 (8.2–9.5) | 6.3 (6.0–6.6) | 13.4 (13.2–13.6) |
| 40–49 years | 19.0 (18.3–19.8) | 22.1 (21.6–22.6) | 21.3 (20.9–21.7) | 7.3 (6.7–7.9) | 14.1 (13.3–15.0) | 10.4 (9.9–10.9) | 18.5 (18.1–18.8) |
| 50–59 years | 23.2 (22.1–24.3) | 26.0 (25.3–26.7) | 25.2 (24.7–25.8) | 10.7 (9.5–12.0) | 22.0 (20.4–23.5) | 16.8 (15.8–17.9) | 23.7 (23.2–24.2) |
| ≥60 years | 25.8 (23.5–28.1) | 26.0 (24.5–27.5) | 26.0 (24.7–27.2) | 13.1 (9.4–16.8) | 30.0 (25.8–34.3) | 23.0 (20.1–26.0) | 25.6 (24.4–26.7) |
| Total | 15.6 (15.2–15.9) | 17.5 (17.3–17.7) | 17.0 (16.8–17.2) | 5.5 (5.3–5.7) | 10.9 (10.5–11.3) | 7.7 (7.4–7.9) | 14.5 (14.3–14.6) |
| Morbid obesity | |||||||
| <30 years | 0.3 (0.2–0.4) | 0.4 (0.3–0.5) | 0.4 (0.3–0.4) | 0.3 (0.2–0.4) | 0.3 (0.2–0.4) | 0.3 (0.2–0.4) | 0.4 (0.3–0.4) |
| 30–39 years | 0.4 (0.3–0.5) | 0.7 (0.6–0.7) | 0.6 (0.5–0.7) | 0.3 (0.2–0.4) | 0.6 (0.4–0.8) | 0.4 (0.3–0.5) | 0.5 (0.5–0.6) |
| 40–49 years | 0.6 (0.5–0.8) | 0.8 (0.7–0.9) | 0.7 (0.7–0.8) | 0.5 (0.3–0.6) | 0.9 (0.7–1.1) | 0.7 (0.5–0.8) | 0.7 (0.7–0.8) |
| 50–59 years | 0.5 (0.4–0.7) | 0.7 (0.6–0.8) | 0.7 (0.6–0.8) | 0.8 (0.4–1.1) | 1.3 (0.9–1.7) | 1.0 (0.8–1.3) | 0.7 (0.6–0.8) |
| ≥60 years | 0.5 (0.1–0.9) | 0.4 (0.2–0.6) | 0.4 (0.3–0.6) | 0.3 (0.0–0.9) | 0.9 (0.0–1.7) | 0.6 (0.1–1.2) | 0.5 (0.3–0.7) |
| Total | 0.5 (0.4–0.5) | 0.6 (0.6–0.6) | 0.6 (0.5–0.6) | 0.3 (0.3–0.4) | 0.7 (0.6–0.8) | 0.5 (0.4–0.5) | 0.5 (0.5–0.6) |
Values are given as percentages (95% CI).
Prevalence of overweight and obesity by sex and type of occupation during the four years analyzed.
| 2004 (n=230,684) | 2005 (n=380,996) | 2006 (n=389,681) | 2007 (n=394,037) | |
| Overweight | ||||
| Males | 44.8 (44.5–45.0) | 44.9 (44.7–45.0) | 44.7 (44.5–44.9) | 44.6 (44.4–44.8) |
| Females | 21.3 (21.0–21.6) | 22.0 (21.7–22.2) | 22.3 (22.1–22.6) | 22.9 (22.6–23.1) |
| White collar | 34.4 (34.1–34.7) | 34.1 (33.9–34.4) | 34.3 (34.0–34.5) | 33.9 (33.7–34.2) |
| Blue collar | 40.5 (40.3–40.8) | 41.0 (40.8–41.2) | 40.9 (40.7–41.1) | 40.9 (40.7–41.1) |
| Total | 38.4 (38.2–38.6) | 38.6 (38.4–38.7) | 38.5 (38.4–38.7) | 38.5 (38.3–38.6) |
| Obesity | ||||
| Males | 17.0 (16.8–17.2) | 17.6 (17.5–17.8) | 17.9 (17.8–18.1) | 18.2 (18.1–18.4) |
| Females | 7.7 (7.4–7.9) | 8.0 (7.8–8.1) | 8.4 (8.2–8.6) | 8.7 (8.6–8.9) |
| White collar | 10.9 (10.6–11.1) | 11.2 (11.1–11.4) | 11.5 (11.3–11.6) | 11.6 (11.4–11.7) |
| Blue collar | 16.4 (16.2–16.5) | 17.0 (16.9–17.2) | 17.5 (17.3–17.6) | 17.7 (17.5–17.8) |
| Total | 14.5 (14.3–14.6) | 15.0 (14.9–15.1) | 15.3 (15.2–15.4) | 15.5 (15.4–15.7) |
| Morbid obesity | ||||
| Males | 0.6 (0.5–0.6) | 0.6 (0.6–0.6) | 0.7 (0.6–0.7) | 0.7 (0.7–0.7) |
| Females | 0.5 (0.4–0.5) | 0.6 (0.5–0.6) | 0.6 (0.5–0.6) | 0.6 (0.6–0.7) |
| White collar | 0.4 (0.4–0.4) | 0.5 (0.4–0.5) | 0.5 (0.5–0.5) | 0.5 (0.5–0.6) |
| Blue collar | 0.6 (0.6–0.6) | 0.6 (0.6–0.7) | 0.7 (0.7–0.8) | 0.8 (0.7–0.8) |
| Total | 0.5 (0.5–0.6) | 0.6 (0.6–0.7) | 0.6 (0.6–0.7) | 0.7 (0.7–0.7) |
Values are given as percentages (95% CI).
By type of occupation, the prevalence rates of obesity (including morbid obesity) and overweight were higher in manual workers (17.0% and 40.5% respectively) than in clerical workers (11.3% and 34.4% respectively) (Table 3). These differences were also seen in women from all age groups (Table 2). The prevalence of obesity was higher among men with manual occupations as compared to those in clerical work; however, overweight was less prevalent in men with manual occupations than in those in clerical work (Table 2). During the four years of the study, the prevalence of obesity increased in parallel in both manual and clerical workers (Table 3). The prevalence of overweight remained stable in both occupational groups during the four-year period (Table 3).
The prevalence of morbid obesity in the 2004 cohort was 0.5%. Table 2 shows these results broken down by age and sex. The prevalence of morbid obesity was higher in men as compared to women, with a progressive increase with age up to the range of ≥60 years, when a decrease was seen (Table 2). Morbid obesity was more prevalent in manual than in clerical workers (Table 2). During the four-year study period, the prevalence of morbid obesity increased slightly (Table 3).
DiscussionThe prevalence of obesity and overweight in the Spanish working population is high and continues to increase. More than half the study workers were overweight or obese. The prevalence of obesity is lower in women as compared to men, and is also lower in clerical workers than in manual workers.
The upward trend in the prevalence of obesity between 2004 and 2007 is similar to that previously seen in other European studies.6 The prevalence of overweight appears to be more constant. However, the four-year period analyzed is short as compared to other studies showing upward trends in the prevalence of overweight in other countries.19
The successive reports of the Spanish National Health Survey issued from 1987 to 2001 show a constant increase in the prevalence of overweight and obesity in all age groups, including their equivalents in the working population.13 Prevalence rates of overweight and obesity have increased in Spain during the past 20 years. To date, updated data show no stabilization or decrease in such rates. Moreover, data on the prevalence of overweight and obesity in Spanish children suggest that this increase has not yet reached its peak.20 Because of the close relationship between obesity and type 2 diabetes mellitus, hypertension, dyslipidemia, and some types of cancer, the prevalence of these latter diseases may also increase in the future. In fact, such an increase has already been shown for type 2 diabetes mellitus.21,22 This study provides strong evidence regarding the magnitude of the increase in obesity in the active Spanish population, but the reasons for this increase have still to be determined.
It should be noted that the data from this study included direct measurements of weight and height performed by healthcare professionals, so avoiding any bias from self-reported measurements.23,24 In addition, the large sample size allowed for more detailed analysis of the results.
The prevalence of obesity was lower in active working women as compared to men. This finding does not agree with prior studies on the general Spanish population,8,9 in which a greater prevalence was found in women, particularly in the groups with low socioeconomic level and advanced age. The active population in our study possibly included women who had a higher socioeconomic level and who were younger on average that the general population, which could account for the lower prevalence.
Obesity prevalence rates remained approximately 50% higher in manual workers as compared to clerical workers throughout the study period, despite the greater physical activity associated with manual occupations. However, differences in type of diet and type of physical activity performed during leisure time may explain these results. In an Australian study on a male population, the prevalence of obesity was lower in farmers than in professional or managerial workers.25 A more specific analysis of the working population in Spain would allow for preventive interventions adapted to specific occupational groups.
On the other hand, the prevalence of obesity increased in both occupational groups throughout the four-year study period. This means that strategies to prevent obesity should be aimed at both groups.26
Of particular note is the high prevalence of obesity seen in women aged 60 years or older with manual occupations as compared to men or the overall group of clerical workers. There was no such difference regarding the prevalence of overweight.
This study was limited to the active population; its data cannot therefore be extrapolated to the general Spanish population without considering occupational status. Moreover, these data are not representative of the older and younger groups of the general population. The prevalence of obesity among the unemployed working population may be even higher than seen in this study. In that case, the aggregate data would be even more alarming.
These findings demonstrate again the need for promoting specific programs to prevent and treat obesity. Medical check-ups of workers are an excellent means of collecting information about the epidemiology and early prevention of obesity and other prevalent conditions.
FundingThis study was funded by Ibermutuamur. The authors acknowledge Irmita Cheung, from the PRIMO Scientific Corporation, for her assistance in the preparation of this manuscript. The writing of the manuscript was funded by Eli Lilly and Company.
Conflicts of interestAlberto Goday-Arnó, Eva Calvo-Bonacho, Miguel-Ángel Sánchez-Chaparro, José-Antonio Gelpi, Juan-Carlos Sainz, Sonia Santamaría, Rosa-Isabel Navarro, Faustino Gutiérrez, and Carlos Sanz state that they have no conflicts of interest. Elena Caveda and Jesús Reviriego are full-time employees of Eli Lilly and Company.
Please cite this article as: Goday-Arnó A, et al. Alta prevalencia de obesidad en una población laboral en España. Endocrinol Nutr. 2013;60:173–8.
