


Hearing loss due to noise is considered within the prevention plans of the most common occupational diseases. In addition to evaluation of working conditions, other personal factors increasing the risk of hypoacusis, such as diabetes, should be taken into account.
ObjectivesTo explore hearing loss in the workplace and its relationship to impaired fasting baseline blood glucose levels.
MethodsAn observational, cross-sectional study enrolling 1636 workers from service companies was conducted. Full audiometric evaluation was performed at different frequencies: high frequency (HF), early loss index (ELI), speech average loss (SAL), and monaural and binaural loss. Results were categorized by baseline blood glucose levels: G1 (<100mg/dl), G2 (100–125mg/dl), and G3 (>125mg/dl).
ResultsBased on both HF and ELI, 11% of workers had clear indication of deafness. Women with G3 levels showed significant differences in the results of HF and ELI indexes as compared to the G1 group (p=.038 and .046, respectively). A positive association was found between hearing loss and G3 blood glucose levels in HF (OR: .338; p=.002), ELI (OR: .407; p=.007), and the monaural test in the left ear (OR: 4.77×10⁻⁵; p=.006).
ConclusionsDespite the methodological limitations of this study, there is evidence for an increased risk of high frequency hearing loss in workers with high baseline blood glucose levels.
La hipoacusia ocupacional por ruido se considera dentro de los planes de prevención de enfermedades profesionales más comunes. Además del examen de las condiciones laborales se deben tener en cuenta otros factores personales que aumentan el riesgo de hipoacusia, como la diabetes.
ObjetivosExplorar la pérdida de audición en el ámbito laboral y su relación con las alteraciones de las cifras de glucemia basal en ayunas.
MétodosSe realizó un estudio observacional y transversal en el que se incluyeron 1.636 trabajadores de empresas del sector servicios. Se hicieron audiometrías tonales completas midiendo: alta frecuencia (AF), índice de pérdida precoz (ELI), índice promedio conversacional (SAL) y pérdida pérdida monoaural y binaural. Los resultados se categorizaron según las cifras de glucemia basal: G1 (<100mg/dl), G2 (100-125mg/dl) y G3 (>125mg/dl).
ResultadosSegún la AF y el ELI el 11% de los trabajadores en cada caso presentaron claro indicio de sordera. Las mujeres con niveles G3 obtuvieron diferencias significativas en los resultados del índice AF y ELI respecto al grupo G1 (p=0,038 y 0,046, respectivamente). Se encontró una asociación positiva de hipoacusia y niveles de glucemia G3 en las pruebas de AF (OR: 0,338; p=0,002), ELI (OR: 0,407; p=0,007) y monoaural del oído izquierdo (OR: 4,77×10⁻⁵; p=0,006).
ConclusionesPese a las limitaciones metodológicas de este estudio, existen indicios para pensar que los trabajadores con niveles elevados de glucemia basal podrían presentar un mayor riesgo de padecer hipoacusia de altas frecuencias.
Occupational hearing loss is characterized by sensorineural deafness caused by continuous exposure to noise with a daily loudness level of 80 decibels or higher in the A scale (dBA).1 Although some ototoxic drugs and exposure to other agents, such as chemical substances and vibrations, may cause deafness in a worker, noise is considered to be the most important factor. Exposure to noise causes trauma in the sensory epithelium of the cochlea.2 Vascular, chemical, and metabolic changes are initially reversible, and hearing is recovered with time. However, if noise exposure persists, irreparable damage occurs due to the permanent loss of stereocilia and the destruction of sensory cells.2 The greatest problem associated with sensorineural deafness is that hearing loss occurs slowly and gradually, and it is therefore difficult for the worker to identify it before it is irreversible.
Some individual characteristics may increase the risk of developing hypoacusis, including advanced age, female sex, and diseases such as diabetes mellitus (DM).3–6 The chronic course of diabetes is usually associated with vascular, neurological, and metabolic complications.3,7 The metabolic consequences of DM with a hearing impact include microangiopathy, primary neuropathy, and a trend to blood hyperviscosity.8,9 Microangiopathy and primary neuropathy are associated with hearing impairment in the longer term and, in patients with DM, lead to bilateral sensorineural damage with progressive loss of the higher frequencies.7,10,11 Some research suggests that diabetes could be related to sudden hearing loss affecting the low and middle frequencies.8 The increased blood viscosity that may suddenly occur in diabetic patients is of significance regarding this effect. The physiology of cochlear circulation is involved in this process, because it consists of narrow, long terminal vascular beds where increased blood viscosity may affect normal flow.8,12
It therefore appears clear that DM should be included among the risk factors associated with hearing loss, and should be taken into account in otoneurological examination protocols as part of the programs for preventing occupational hypoacusis.
The aim of this study was to assess hearing loss parameters in a sample of workers from companies in the services sector in Spain not exposed to noise >80dBA by evaluating audiometric indices in the different frequencies (low, middle, high, and very high), and relating them to fasting baseline blood glucose levels.
Subjects and methodsAn observational, cross-sectional study was conducted from November 2010 to November 2011. Data were collected from workers at a single visit during regular health check-up examinations at services and healthcare companies located in Valencia, Castellón, Palma de Majorca, and Ibiza. Subjects at risk due to occupational risk exposure (>80dBA), intake of ototoxic drugs, or a family history of deafness were excluded. The study was conducted in compliance with the regulations for the prevention of occupational risk applicable in Spain13 and with the knowledge of the safety and health committees of the companies.
After signing an informed consent, patients underwent tone air conduction threshold audiometry in the different frequencies (low, middle, high, and very high) using callibrated audiometric equipment (Sibelmed Mod. AS5-AOM). The procedure for the audiological examination and the analysis of the results has previously been described in technical prevention notes (TPNs) 270, 287, 284, and 28514–17 and in RD 1316/89, of 27 October.18
The response variables measured included: high frequency (HF) audiometry, the early loss index (ELI), speech average loss (SAL), monaural hearing loss in the right (RE) and left ear (LE), and binaural hearing loss. HF uses the highest frequencies, ranging from 8000 to 20,000Hz. The ELI scale measures hearing loss caused by acoustic trauma, mainly in the high frequencies of 4000Hz, with a range from 3000 to 6000Hz. Final results were corrected for presbyacusis, as appropriate. Hearing loss derived from HF and the ELI was categorized as follows: grade A, normal or excellent, when a loss <8dB was recorded; grade B, normal good, when the loss was 8–14dB; grade C, normal with a loss of 15–22dB; grade D, suspected deafness, with a loss of 23–29dB; and grade E, clear evidence of deafness with a loss of >30dB.19
The SAL scale in turn records hearing in the speech frequencies (500, 1000, and 2000Hz) and is assessed as follows: grade A, normal with loss in the worst ear of <16dB; grade B, almost normal with loss of 16–30dB in one ear; grade C, slight impairment with loss of 31–45dB in the best ear; grade D, serious impairment with loss of 46–60dB in the best ear; grade E, severe impairment with loss of 61–90dB in the best ear; and grade F, profound impairment with a decrease in the best ear of >90dB.19 Finally, the loss of monaural hearing in both ears and binaural hearing was estimated as detailed in PTN 136, using the following classification: normal (N) 0–26dB; mild-moderate (M-M) 26–71dB; and severe-profound (S-P) >71dB.19
To determine the relationship between blood glucose and occupational hypoacusis, all participants had a venous blood sample taken for measuring fasting blood glucose levels on the same day as the hearing evaluations. Baseline blood glucose results were categorized into three groups: G1 (<100mg/dL), G2 (100–125mg/dL), and G3 (>125mg/dL). Reference levels indicating elevated baseline blood glucose were identified using the cut-off points usually established for defining normal and altered blood glucose and DM.20 Study subjects previously diagnosed with DM were also identified using the information available in the clinical records.
A Kruskal–Wallis test was used to perform a comparative statistical analysis of the hearing loss parameters selected in the different blood glucose groups. To study the association between hearing loss and baseline blood glucose levels suggesting diabetes, an ordinal multinomial logistic regression model (odds ratio [OR] and a 95% confidence interval [CI]) was used. A value of p<0.05 was considered statistically significant.
Sex, age, work position, and the baseline blood glucose level of every subject were introduced as explicative variables in the model. Akaike's information criterion (AIC) and difference in deviance were used for variable selection in each of the models.
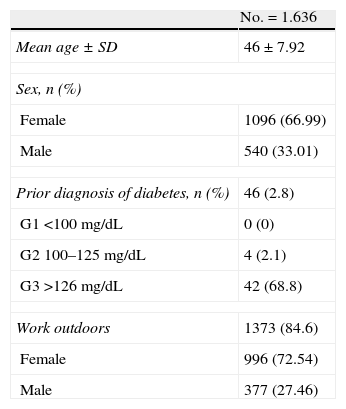
ResultsA total of 1641 participants were enrolled into the study, of which five were excluded for having a family history of deafness. Therefore, data from 1636 subjects were finally analyzed. As regards the baseline characteristics of the study population (Table 1), the mean age was 46±7.92 years, with a higher proportion of females in the final sample (66.99%). Forty-six subjects had a prior diagnosis of DM. Two of these had type 1 DM treated with insulin, and 44 had type 2 DM treated with oral antidiabetic drugs. Group distribution was as follows: in G1 (<100mg/dL), no subject had previously been diagnosed with diabetes; in G2 (100–125mg/dL), four subjects (2.1%) had been diagnosed with diabetes; and in G3 (>125mg/dL) 42 subjects (68.8%) had a prior diagnosis of diabetes. Moreover, 1373 (84.6%) subjects in the study population, 377 males and 996 females, worked outside their work center for part of the day.
Baseline characteristics of the study population.
| No.=1.636 | |
| Mean age±SD | 46±7.92 |
| Sex, n (%) | |
| Female | 1096 (66.99) |
| Male | 540 (33.01) |
| Prior diagnosis of diabetes, n (%) | 46 (2.8) |
| G1 <100mg/dL | 0 (0) |
| G2 100–125mg/dL | 4 (2.1) |
| G3 >126mg/dL | 42 (68.8) |
| Work outdoors | 1373 (84.6) |
| Female | 996 (72.54) |
| Male | 377 (27.46) |
As regards fasting blood glucose measurement, most workers had levels lower than 125mg/dL; specifically, 1384 (84.6%) had levels corresponding to group G1 (<100mg/dL) and 191 (11.7%) to group G2 (100–125mg/dL), while 61 (3.7%) participants had group G3 levels (>125mg/dL).
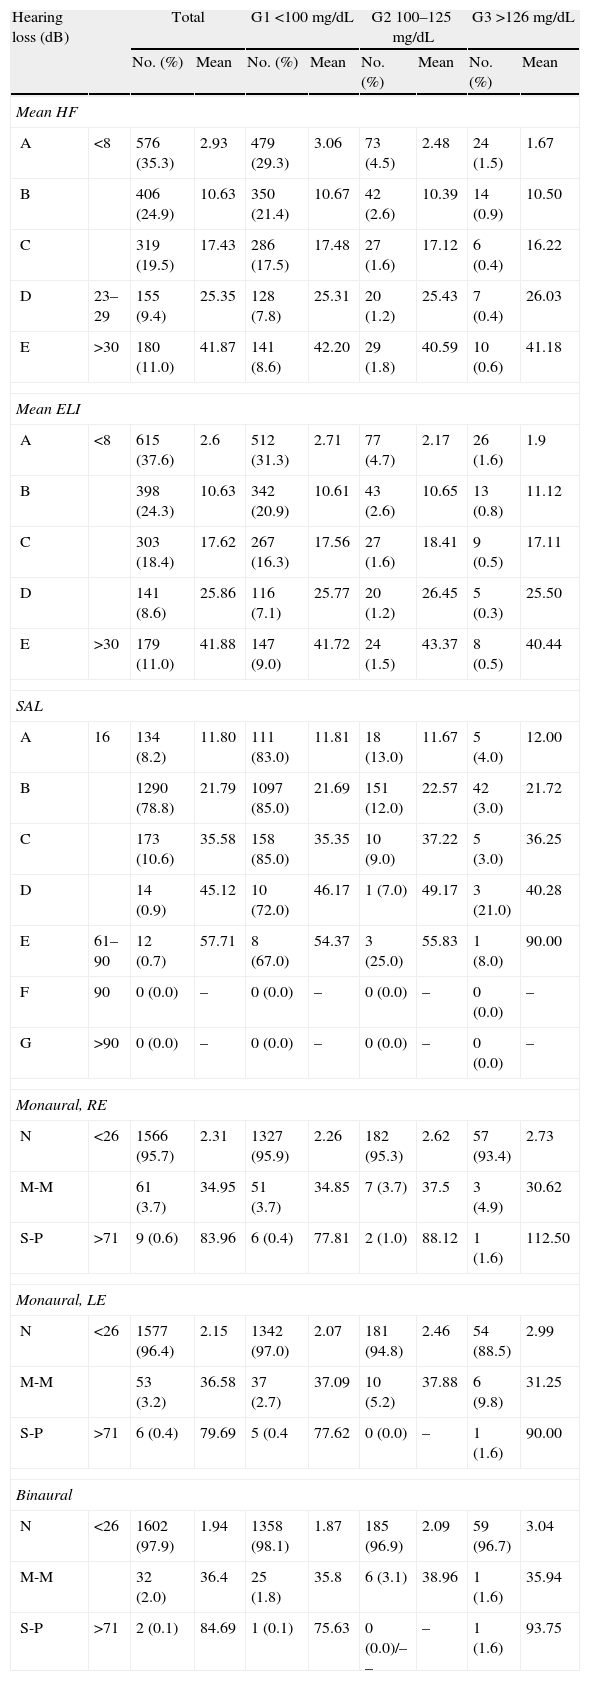
Table 2 shows the distribution of participants by degree of hypoacusis found at the audiometric examinations HF, ELI, SLA, monaural in LE and RE, and binaural, categorized by baseline blood glucose levels. Overall, 180 (11%) workers had clear evidence of deafness (grade E), with a mean hearing loss of 41.87 in the highest frequencies according to HF audiometry, and 179 (11%) had a mean hearing loss of 41.88 according to the ELI. However, no severe hearing loss was detected in SAL speech frequencies. As regards monaural (RE and LE) and binaural results, categorized by blood glucose groups, no severe losses were found either, because the findings were normal (<26dB) in 95.4% of the study population.
Distribution of the study population and mean value of the hypoacusis parameter (measured in dB with correction for presbyacusis) depending on the results in hearing examination and categorized by fasting baseline blood glucose levels.
| Hearing loss (dB) | Total | G1 <100mg/dL | G2 100–125mg/dL | G3 >126mg/dL | |||||
| No. (%) | Mean | No. (%) | Mean | No. (%) | Mean | No. (%) | Mean | ||
| Mean HF | |||||||||
| A | <8 | 576 (35.3) | 2.93 | 479 (29.3) | 3.06 | 73 (4.5) | 2.48 | 24 (1.5) | 1.67 |
| B | 406 (24.9) | 10.63 | 350 (21.4) | 10.67 | 42 (2.6) | 10.39 | 14 (0.9) | 10.50 | |
| C | 319 (19.5) | 17.43 | 286 (17.5) | 17.48 | 27 (1.6) | 17.12 | 6 (0.4) | 16.22 | |
| D | 23–29 | 155 (9.4) | 25.35 | 128 (7.8) | 25.31 | 20 (1.2) | 25.43 | 7 (0.4) | 26.03 |
| E | >30 | 180 (11.0) | 41.87 | 141 (8.6) | 42.20 | 29 (1.8) | 40.59 | 10 (0.6) | 41.18 |
| Mean ELI | |||||||||
| A | <8 | 615 (37.6) | 2.6 | 512 (31.3) | 2.71 | 77 (4.7) | 2.17 | 26 (1.6) | 1.9 |
| B | 398 (24.3) | 10.63 | 342 (20.9) | 10.61 | 43 (2.6) | 10.65 | 13 (0.8) | 11.12 | |
| C | 303 (18.4) | 17.62 | 267 (16.3) | 17.56 | 27 (1.6) | 18.41 | 9 (0.5) | 17.11 | |
| D | 141 (8.6) | 25.86 | 116 (7.1) | 25.77 | 20 (1.2) | 26.45 | 5 (0.3) | 25.50 | |
| E | >30 | 179 (11.0) | 41.88 | 147 (9.0) | 41.72 | 24 (1.5) | 43.37 | 8 (0.5) | 40.44 |
| SAL | |||||||||
| A | 16 | 134 (8.2) | 11.80 | 111 (83.0) | 11.81 | 18 (13.0) | 11.67 | 5 (4.0) | 12.00 |
| B | 1290 (78.8) | 21.79 | 1097 (85.0) | 21.69 | 151 (12.0) | 22.57 | 42 (3.0) | 21.72 | |
| C | 173 (10.6) | 35.58 | 158 (85.0) | 35.35 | 10 (9.0) | 37.22 | 5 (3.0) | 36.25 | |
| D | 14 (0.9) | 45.12 | 10 (72.0) | 46.17 | 1 (7.0) | 49.17 | 3 (21.0) | 40.28 | |
| E | 61–90 | 12 (0.7) | 57.71 | 8 (67.0) | 54.37 | 3 (25.0) | 55.83 | 1 (8.0) | 90.00 |
| F | 90 | 0 (0.0) | – | 0 (0.0) | – | 0 (0.0) | – | 0 (0.0) | – |
| G | >90 | 0 (0.0) | – | 0 (0.0) | – | 0 (0.0) | – | 0 (0.0) | – |
| Monaural, RE | |||||||||
| N | <26 | 1566 (95.7) | 2.31 | 1327 (95.9) | 2.26 | 182 (95.3) | 2.62 | 57 (93.4) | 2.73 |
| M-M | 61 (3.7) | 34.95 | 51 (3.7) | 34.85 | 7 (3.7) | 37.5 | 3 (4.9) | 30.62 | |
| S-P | >71 | 9 (0.6) | 83.96 | 6 (0.4) | 77.81 | 2 (1.0) | 88.12 | 1 (1.6) | 112.50 |
| Monaural, LE | |||||||||
| N | <26 | 1577 (96.4) | 2.15 | 1342 (97.0) | 2.07 | 181 (94.8) | 2.46 | 54 (88.5) | 2.99 |
| M-M | 53 (3.2) | 36.58 | 37 (2.7) | 37.09 | 10 (5.2) | 37.88 | 6 (9.8) | 31.25 | |
| S-P | >71 | 6 (0.4) | 79.69 | 5 (0.4 | 77.62 | 0 (0.0) | – | 1 (1.6) | 90.00 |
| Binaural | |||||||||
| N | <26 | 1602 (97.9) | 1.94 | 1358 (98.1) | 1.87 | 185 (96.9) | 2.09 | 59 (96.7) | 3.04 |
| M-M | 32 (2.0) | 36.4 | 25 (1.8) | 35.8 | 6 (3.1) | 38.96 | 1 (1.6) | 35.94 | |
| S-P | >71 | 2 (0.1) | 84.69 | 1 (0.1) | 75.63 | 0 (0.0)/–– | – | 1 (1.6) | 93.75 |
HF: high frequency audiometry; dB: decibels; ELI: early loss index; G1, G2, and G3: fasting blood glucose levels in study participants; SAL: speech average loss.
HF and ELI indices (mean of both ears): grade A, normal or excellent, when a loss <8dB was recorded; grade B, normal good, when loss was 8–14dB; grade C, normal with loss of 15–22dB; grade D, suspected deafness, with loss of 23–29dB; and grade E, clear evidence of deafness for losses >30dB.
SAL index: grade A, normal with loss in the worst ear of <16dB; grade B, almost normal with loss of 16–30dB in one ear; grade C, slight impairment with loss of 31–45dB in the best ear; grade D, serious impairment with loss of 46–60dB in the best ear; grade E, severe impairment with loss of 61–90dB in the best ear; and grade F, profound impairment with a decrease in the best ear >90dB.
Monaural and binaural indices: grade N with loss <26dB; grade L-M with loss ranging from 26 to 71dB; and grade S-P, with loss >71dB.
The negative values obtained in each of the parameters examined were replaced by null values.
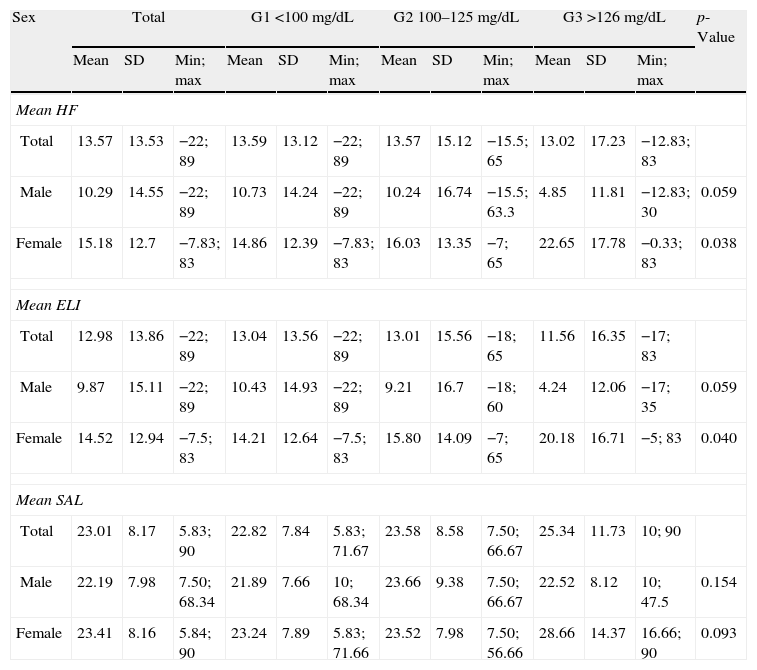
Table 3 describes hearing parameters based on the results of the Kruskal–Wallis test for the blood glucose and sex categories. Females showed differences in the HF index for the mean of both ears (with correction for presbyacusis) (p=0.038), and graphic representation showed that workers with a G3 level of blood glucose had a significantly greater hearing loss in the high frequencies as compared to group G1 (p=0.038 [Fig. 1A]). By contrast, no significant differences were found in males (p=0.059) (Fig. 1A). Similarly, analysis of the results of the ELI revealed significant differences in females with G3 blood glucose levels (p=0.046), while no statistical significance was found for males at this frequency (p=0.092) (Fig. 1B). No significant differences were detected in the SAL index in either sex (p=0.154 and 0.093, respectively; Fig. 1C).
Description of hearing parameters HF, ELI, and SAL (mean of left and right ears) by total patients examined and baseline blood glucose categories considered in the study.
| Sex | Total | G1 <100mg/dL | G2 100–125mg/dL | G3 >126mg/dL | p-Value | ||||||||
| Mean | SD | Min; max | Mean | SD | Min; max | Mean | SD | Min; max | Mean | SD | Min; max | ||
| Mean HF | |||||||||||||
| Total | 13.57 | 13.53 | −22; 89 | 13.59 | 13.12 | −22; 89 | 13.57 | 15.12 | −15.5; 65 | 13.02 | 17.23 | −12.83; 83 | |
| Male | 10.29 | 14.55 | −22; 89 | 10.73 | 14.24 | −22; 89 | 10.24 | 16.74 | −15.5; 63.3 | 4.85 | 11.81 | −12.83; 30 | 0.059 |
| Female | 15.18 | 12.7 | −7.83; 83 | 14.86 | 12.39 | −7.83; 83 | 16.03 | 13.35 | −7; 65 | 22.65 | 17.78 | −0.33; 83 | 0.038 |
| Mean ELI | |||||||||||||
| Total | 12.98 | 13.86 | −22; 89 | 13.04 | 13.56 | −22; 89 | 13.01 | 15.56 | −18; 65 | 11.56 | 16.35 | −17; 83 | |
| Male | 9.87 | 15.11 | −22; 89 | 10.43 | 14.93 | −22; 89 | 9.21 | 16.7 | −18; 60 | 4.24 | 12.06 | −17; 35 | 0.059 |
| Female | 14.52 | 12.94 | −7.5; 83 | 14.21 | 12.64 | −7.5; 83 | 15.80 | 14.09 | −7; 65 | 20.18 | 16.71 | −5; 83 | 0.040 |
| Mean SAL | |||||||||||||
| Total | 23.01 | 8.17 | 5.83; 90 | 22.82 | 7.84 | 5.83; 71.67 | 23.58 | 8.58 | 7.50; 66.67 | 25.34 | 11.73 | 10; 90 | |
| Male | 22.19 | 7.98 | 7.50; 68.34 | 21.89 | 7.66 | 10; 68.34 | 23.66 | 9.38 | 7.50; 66.67 | 22.52 | 8.12 | 10; 47.5 | 0.154 |
| Female | 23.41 | 8.16 | 5.84; 90 | 23.24 | 7.89 | 5.83; 71.66 | 23.52 | 7.98 | 7.50; 56.66 | 28.66 | 14.37 | 16.66; 90 | 0.093 |
SD: standard deviation.
p-Values from the Kruskal–Wallis test for each hearing loss parameter and by sex and baseline blood glucose levels. Data are given as mean value of the hearing loss parameter.
 or ototoxic drugs and with no family history of deafness (n=1636). (A) High frequency audiometry (HF). Median HF index in the two ears, quartiles, and maximum and minimum are plotted. Fasting baseline blood glucose levels: G1 (<100mg/dL), G2 (100–125mg/dlL), and G3 (>125mg/dL). In females, statistically significant differences were found between groups G1 and G3 of baseline blood glucose (p=0.038). (B) Early loss index audiometry (ELI). Median ELI index in the two ears, quartiles, and maximum and minimum are plotted. Fasting baseline blood glucose levels: G1 (<100mg/dL), G2 (100–125mg/dL), and G3 (>125mg/dL). In females, statistically significant differences were found between groups G1 and G3 of baseline blood glucose (p=0.046). (C) Speech average loss (SAL) audiometry. Median SAL index in the two ears, quartiles, and maximum and minimum are plotted. Fasting baseline blood glucose levels: G1 (<100mg/dL), G2 (100–125mg/dL), and G3 (>125mg/dL). No statistically significant differences were seen between the different blood glucose groups for the SAL index in males and females (p=0.154 and 0.093, respectively).")
Result of audiometry in relation to baseline blood glucose levels in active workers from companies of the service sectors not exposed to persistent noise (<80dBA) or ototoxic drugs and with no family history of deafness (n=1636). (A) High frequency audiometry (HF). Median HF index in the two ears, quartiles, and maximum and minimum are plotted. Fasting baseline blood glucose levels: G1 (<100mg/dL), G2 (100–125mg/dlL), and G3 (>125mg/dL). In females, statistically significant differences were found between groups G1 and G3 of baseline blood glucose (p=0.038). (B) Early loss index audiometry (ELI). Median ELI index in the two ears, quartiles, and maximum and minimum are plotted. Fasting baseline blood glucose levels: G1 (<100mg/dL), G2 (100–125mg/dL), and G3 (>125mg/dL). In females, statistically significant differences were found between groups G1 and G3 of baseline blood glucose (p=0.046). (C) Speech average loss (SAL) audiometry. Median SAL index in the two ears, quartiles, and maximum and minimum are plotted. Fasting baseline blood glucose levels: G1 (<100mg/dL), G2 (100–125mg/dL), and G3 (>125mg/dL). No statistically significant differences were seen between the different blood glucose groups for the SAL index in males and females (p=0.154 and 0.093, respectively).
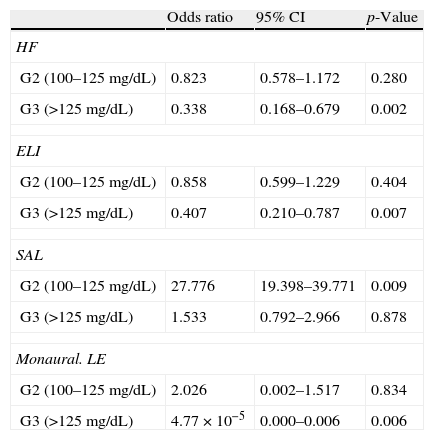
Table 4 shows the results of the logistic regression analysis. A positive association with hypoacusis was found in the higher frequencies according to HF and ELI audiometry in the group categorized with levels >125mg/dL) (OR: 0.338; 95% CI: 0.168–0.679; p=0.002 and OR: 0.407; 95% CI: 0.210–0.787; p=0.007, respectively). The effect on monaural LE audiometry was also significant (OR: 4.77×10⁻⁵; 95% CI: 0.000–0.006; p=0.006). A statistically significant effect was also seen for hearing loss in the SAL index in the group of participants with G2 levels (p=0.009).
Effect of baseline blood glucose levels of study participants on the different audiometric indices examined.
| Odds ratio | 95% CI | p-Value | |
| HF | |||
| G2 (100–125mg/dL) | 0.823 | 0.578–1.172 | 0.280 |
| G3 (>125mg/dL) | 0.338 | 0.168–0.679 | 0.002 |
| ELI | |||
| G2 (100–125mg/dL) | 0.858 | 0.599–1.229 | 0.404 |
| G3 (>125mg/dL) | 0.407 | 0.210–0.787 | 0.007 |
| SAL | |||
| G2 (100–125mg/dL) | 27.776 | 19.398–39.771 | 0.009 |
| G3 (>125mg/dL) | 1.533 | 0.792–2.966 | 0.878 |
| Monaural. LE | |||
| G2 (100–125mg/dL) | 2.026 | 0.002–1.517 | 0.834 |
| G3 (>125mg/dL) | 4.77×10⁻⁵ | 0.000–0.006 | 0.006 |
HF: high frequency audiometry; ELI: early loss index; G2 and G3: baseline blood glucose levels of study participants; CI: confidence interval; LE: left ear; SAL: speech average loss.
p-Values correspond to comparisons versus G1 (<100 mg/dL).
In this ordinal multinomial logistic model, the mean of each index with its ordinal classification categories was used to test the effect of baseline blood glucose levels (data shown), as well as age, sex, and workplace (data not shown).
Hearing is of vital importance in human communication, and its loss affects the process of reasoning, mental health, and educational and professional prospects, thus promoting the social isolation of people who suffer from it. According to WHO data reported at the workshop “Hearing contamination” in the 33rd Congress of the Pan-American Society of Otolaryngology and Head and Neck Surgery, 76% of the population living in urban areas suffer an acoustic impact much higher than recommended.21 The occupational sectors most exposed to persistent noise are construction, the manufacturing industry, and agriculture. However, these high-risk groups have been studied more extensively, and data about them are available in the current literature.22–24 The services sector was therefore selected for this study because it encompasses a wide range of activities (transport, trade, tourism, health, education, and so on) and has an ever increasing proportion of workers (especially women),25 as shown by our results (66.99%).
Sensorineural loss in workers was assessed thoroughly in this study by evaluating frequencies ranging from 500 to 8000Hz, as usually reported in the literature, but HF audiometry in frequencies ranging from 8000 to 20,000Hz was also performed.
There are also some non-occupational factors, such as DM, advanced age, and female sex, which may increase the risk of hearing loss. This study focused on the analysis of audiometric results depending on baseline fasting blood glucose levels measured in venous blood. Data were therefore categorized into three groups: G1 (<100mg/dL), G2 (100–125mg/dL), and G3 (>125mg/dL). The values were obtained from a single venous blood sample, which may represent a limitation when their validity is interpreted, because repeat measurement is recommended to confirm the results.20 This may explain the low prevalence of subjects with fasting blood glucose levels >125mg/dL (3.7%), which contrasts with estimates recently published in the literature (31–45 years: 6.68% in males and 2.2% in females, and 46–60 years: 23.8% in males and 10.9% in females).26 However, 68.8% of subjects in group 3 had previously been diagnosed with diabetes, and were able to serve as a positive control, although the time since disease onset was unknown. It should, however, be noted that this study was conducted during a routine health check-up of workers, and short-time monitoring would have involved a substantial increase in its costs.
According to our data, women in group G3 of fasting blood glucose levels had statistically significant decreases in hearing in the higher frequencies, according to HF and ELI audiometry, as compared to women in group G1. This result was also found in the logistic regression analysis, where a positive association was seen between hypoacusis in high frequencies in HF, ELI, and G3 blood glucose levels. Prior studies had already reported this association between diabetic changes and the loss of high frequencies up to 8000Hz.7,10,11,27,28 However, these studies were conducted in patients being treated for diabetes diagnosed several years before, so making comparison with our study, which enrolled a large sample but only a small proportion of subjects with glucose levels suggesting diabetes, of limited value. There is no clear explanation for the greater association of audiometric changes in women, although these occur in women who work outside offices at least half of their working time. High blood glucose levels in women should not be explained by outdoor work only. The literature available relates hearing loss in diabetics to aspects such as disease duration, type of diabetes, glycosylated hemoglobin values or efficacy of control, and even with patient age.27,29–31 In addition, few studies monitoring audiometric impairment over time in diabetic patients are available. García Callejo et al. conducted a comparative study on a small sample of diabetic workers and healthy controls subjected to a daily acoustic level equivalent to 80dB.12 Baseline audiometric examination six months after starting work found no significant differences, while at five years of follow-up, significantly higher binaural impairment and evidence of deafness according to the ELI (type E) was shown in diabetic subjects.12
In the future, therefore, it would be interesting to have additional studies comparing healthy and diabetic patients in order to collect relevant information about diabetes itself, such as type of diabetes, measurement of HbA1, disease duration, treatment, or comorbidities, as well as hearing impairment over time. According to the literature, the minimal duration of diabetes associated with some hearing deficiency is five years for type 2 DM11 and ten years for type 1 DM.32 In addition, some authors have correlated the presence of diabetes associated with coronary artery disease or retinopathy to a significantly higher risk of hypoacusis.7
To sum up, occupational hearing loss is a highly common disease in Spanish workers with a considerable socioeconomic impact, mainly because it is already irreversible when detected by the worker. It may be inferred from our results that changes in carbohydrate metabolism assessed by baseline blood glucose are a risk factor for hearing impairment in the high frequencies in a working population not exposed to excess noise (<80dB), which gives an added value to these data because they probably better reflect the general population.
Thus, along with the collection of information about the workplace and the risk of noise, it is important to identify other aggravating or conditioning non-occupational factors such as elevated blood glucose levels suggesting diabetes. Overall assessment of these data by a multidisciplinary team of specialists, including an occupational physician, would allow for coordinated action to improve the use of the available resources and, possibly, to achieve better mid- and long-term results in the prevention of hypoacusis.
FundingThe authors thank Irantzu Izco-Basurko and Teresa Hernando (COCIENTE S.L.) for their support in the writing of the manuscript. This study was funded by Novo Nordisk Pharma S.A.
Conflicts of interestThe authors state that they have no conflicts of interest.
Please cite this article as: Vicente-Herrero MT, Lladosa Marco S, Ramírez-Iñiguez de La Torre MV, Terradillos-García MJ, López-González ÁA. Evaluación de los parámetros de hipoacusia laboral en trabajadores activos y su relación con los niveles de glucemia basal. Endocrinol Nutr. 2014;61:255–263.
