


To assess the estimated glucose disposal rate (eGDR), insulin dose, and lipoprotein profile in children with type 1 diabetes mellitus (T1DM) and overweight or obesity as compared to children with T1DM and normal weight.
MethodsA total of 115 patients (aged 5–16 years) with T1DM on intensive insulin therapy were recruited. The following parameters were measured: weight, height, body mass index, waist and hip circumference, insulin dose, eGDR, glycosylated hemoglobin, blood pressure, and lipoprotein profile. Results were stratified by sex and age.
ResultsNo significant differences were found in eGDR between children with normal weight, overweight, and obesity. However, obese children older than 11 years had lower eGDR values (9.3±1.3 vs 10.1±0.8mgkg−1min−1; p<0.01). Insulin dose was higher in overweight and obese children, especially in IU/m2/day (37.7 vs 36.1 vs 29.4 respectively; p<0.01). Obese children had higher low-density lipoprotein cholesterol levels than children with overweight and normal weight (106.5 vs 91.7 vs 91.5mg/dL respectively; p<0.01). No correlation was found between waist circumference and the different markers of insulin resistance.
ConclusionsValues of eGDR values were lower in obese children with T1DM older than 11 years, and this may therefore be considered a marker of insulin resistance. Insulin dose was higher in diabetic patients with overweight or obesity, especially in IU/m2/day. Obese children with T1DM had a lipoprotein profile of cardiovascular risk.
Comparar la tasa estimada de disposición de glucosa (TeDG), la dosis de insulina y el perfil lipoproteico en niños con diabetes mellitus tipo 1 (DM1) y sobrepeso-obesidad frente a niños con DM1 de peso normal.
MétodosSe seleccionaron 115 pacientes (5–16 años) con DM1 e insulinoterapia intensiva. Se determinaron: peso, talla, índice de masa corporal, perímetro abdominal y de cadera, dosis de insulina, hemoglobina glucosilada, presión arterial y perfil lipoproteico. Los resultados se estratificaron por sexo y edad.
ResultadosNo se encontraron diferencias en la TeDG entre los pacientes con peso normal, sobrepeso y obesidad. No obstante, los niños obesos mayores de 11 años mostraron valores inferiores en la TeDG (9,3±1,3 vs 10,1±0,8mgkg−1min; p<0,01). Los niños con obesidad y sobrepeso precisaban dosis de insulina superiores a aquellos con peso normal, especialmente en UI/m2/día (37,7 vs 36,1 vs 29,4, respectivamente; p<0,007). Los niños con obesidad presentaban concentraciones de colesterol de las lipoproteínas de baja densidad superiores a aquellos con sobrepeso y peso normal (1065 vs 91,7 vs 91,5mg/dl, respectivamente; p<0,01). Asimismo, no se encontró correlación entre el perímetro abdominal y los distintos marcadores de resistencia a la insulina.
ConclusionesLa TeDG es inferior en niños obesos mayores de 11 años con DM1, por lo que podría considerarse como un marcador de resistencia a la insulina. Las necesidades de insulina son mayores en pacientes con sobrepeso-obesidad, especialmente cuando se cuantifican en UI/m2/día. Los pacientes obesos con DM1 presentan un perfil lipoproteico de riesgo cardiovascular.
Increased body adiposity induces a cytokine-mediated systemic inflammatory response and elevated circulating free fatty acids which trigger insulin resistance (IR), a state considered as the central event of metabolic syndrome (MS) and all comorbidities associated with it.1 It has been noted that, although intensive insulin therapy has decreased the frequency of microangiopathic complications, it has not reduced the macrovascular complications derived from increases in cardiovascular risk factors,2 so that the anthropometric and metabolic characteristics of patients with type 1 diabetes mellitus (T1DM) are increasingly similar to those of patients with type 2 diabetes mellitus (T2DM).3
Because of the morbidity and mortality associated with IR, it is essential to establish its presence in overweight and obese patients with T1DM. However, IR is not easy to assess, because the so-called hyperinsulinemic–euglycemic clamp (the gold standard for studying IR) is difficult to perform in clinical practice, the HOMA-IR (homeostasis model assessment of insulin resistance) or QUICKI (quantitative insulin sensitivity check index) indices are poorly assessable in patients with endogenous insulin deficiency, as occurs in T1DM, and the calculation of daily insulin requirements is not accurate and depends on multiple factors. This has led to the development in recent years of the estimated glucose disposal rate (eGDR), a marker showing a good correlation with the hyperinsulinemic–euglycemic clamp4 which is obtained using the following equation: eGDR (as mgkg−1min−1)=24.31−12.22 (waist–hip ratio)−3.29 (presence of arterial hypertension; if yes=1, if no=0)−0.57 (glycosylated hemoglobin value).4 It is a model whose values are inversely correlated to the degree of IR, with adult patients diagnosed with MS having lower eGDR values than those with no MS criteria.1,3–6 eGDR has also been shown to be more effective than insulin quantification for predicting the development of vascular complications.1,5 To date, eGRD has not been tested in samples consisting only of patients under 18 years with T1DM. The objective of this study was therefore to compare eGDR values and daily insulin requirements (in IU/kg/day and IU/m2/day) in patients younger than 18 years with T1DM with overweight–obesity and with normal weight.
Subjects and methodsStudy design and populationA cross-sectional, observational, descriptive study was conducted on patients diagnosed with T1DM attending the pediatric endocrinology outpatient clinic of Hospital General Universitario de Ciudad Real. Data were prospectively collected for 11 months. Consecutive non-randomized sampling was used to recruit the study population. According to statistics of our own department and taking into consideration the selection period, a sample size of 119 patients was estimated.
Inclusion criteria were as follows: a diagnosis of T1DM (positive anti-insulin and/or anti-glutamic acid decarboxylase and/or anti-tyrosine phosphatase antibodies), age ranging from 5 to 16 years, and intensive insulin therapy regimen (defined as at least three daily subcutaneous insulin doses or continuous insulin infusion systems). Exclusion criteria were as follows: other forms of diabetes, age under five or over 16 years, a requirement of less than three daily subcutaneous insulin doses, and diabetes diagnosis less than one year before.
Study variablesSex and type of insulin were collected as qualitative variables, while the quantitative variables collected included age, time since diagnosis of T1DM, daily insulin dose (in IU/kg and IU/m2), weight, height, body mass index (BMI), abdominal and hip circumference, blood pressure (BP), glycosylated hemoglobin (HbA1c), eGDR, and lipoprotein profile, including total cholesterol (TC), high density lipoprotein cholesterol (HDL), low density lipoprotein cholesterol (LDL), and triglycerides (TG).
Weight was measured using an electronic scale with a scale ranging from 0 to 120kg and with a precision of 100g with the patients in underwear. Height was measured in barefoot patients using a rigid wall-mounted stadiometer with a scale ranging from 60 to 200cm and a precision of 0.1cm.
Following the recommendations of the “Clinical practice guidelines on the prevention and treatment of obesity in children and adolescents” of the Spanish Ministry of Health,7 BMI was assessed taking as reference the graphs of the semilongitudinal study by Hernández et al.,8 who defined overweight as BMI equal to or higher than the 90th percentile (90th P) for age and sex, and obesity as BMI equal to or higher than the 90th percentile (90th P) for age and sex (97th P).
Abdominal circumference was measured at the end of expiration, with the patients standing, at the midpoint between the lower costal margin and the iliac crest. Charts reported by Fernández et al.9 were used as reference, and values were expressed as standard deviations (SD) from the mean.
BP was measured with patients in a supine position using the auscultatory method and a certified sphygmomanometer. Three measurements were performed, the lowest of which was recorded. High blood pressure (HBP) was defined as systolic and/or diastolic BP greater than the 95th percentile (95th P) for age, sex, and height percentile. The reference charts used were those of the National High Blood Pressure Education Program Working Group on High Blood Pressure in Children and Adolescents.10
MS was defined based on specific criteria for children established by the International Diabetes Federation (IDF).11
HbA1c was measured in blood under fasting conditions, and the results were expressed based on equivalence for the procedure used in the Diabetes Control and Complications Trial (DCCT). An ADAMS A1c model HA-8160 analyzer (Menarini Diagnóstica SA), using high-performance liquid chromatography, was used.
Statistical analysisSPSS® software for Windows was used for statistical analysis. Descriptive statistics were performed for qualitative and quantitative variables. The results were expressed using frequency distribution tables and as median and interquartile range. An inferential statistical analysis was also performed using a Pearson's correlation test (between quantitative variables). The results were expressed using the r coefficient, a t test for means difference (between qualitative and quantitative variables) with the results given as mean and standard deviations, and an analysis of variance (between qualitative and quantitative variables) for which the results were given as mean and variance. All the data analyzed were stratified by sex and age groups: children under 11 years of age (mostly prepubertal) and children aged 11 years or older (most of them with different grades of pubertal development). A value of p<0.05 was considered statistically significant in all cases.
Ethical and confidentiality issuesThis study was conducted in accordance with the principles of the Declaration of Helsinki and its amendments relating to research in humans, and after receiving the favorable opinion of the Clinical Research Ethics Committee of Hospital General Universitario de Ciudad Real. The parents of the patients had to sign the informed consent to authorize recruitment of their children into the study.
ResultsData from 115 of the initially planned 119 patients were collected using the described methods. Males predominated in the sample: 69 boys (60%) and 46 girls (40%). Median age was 12.6 years (10.5–15.4), with 23 patients (20%) being younger than 11 years, while 92 (80%) were 11 years or older. The median time from the diagnosis of T1DM was 4.2 years (2.1–6.8). Among the Lente insulins, insulin glargine was the most commonly used (72.1%; n=86); the remaining patients used NPH or insulin detemir. Insulin aspart was the most commonly used rapid insulin (80.9%; n=93). The remaining patients used insulin lispro and regular insulin. There were no differences in the distribution of use of the different insulin types by age group.
The proportion of overweight–obese patients (BMI equal to or greater than the 90th P) was 28.6% (n=33), while obese patients (BMI equal to or greater than the 97th P) represented 18.2% of the sample. Sex stratification showed a higher prevalence of overweight in females (39.1%; n=18), almost double as compared to males (21.7%; n=15) (p=0.03). An even greater difference was seen in the prevalence of obesity, which was approximately threefold higher in females (28.2%; n=13) as compared to males (11.5%; n=8) (p=0.001). No significant differences were seen when patients were stratified by age group. The frequency of overweight–obesity was 30.3% and 28% respectively in the younger (<11 years) and older groups. Obesity rates in these same groups were 18.1% and 18.2% respectively.
MS criteria were found in 6.4% of patients aged 10–16 years, and 83.3% of patients meeting MS criteria were females.
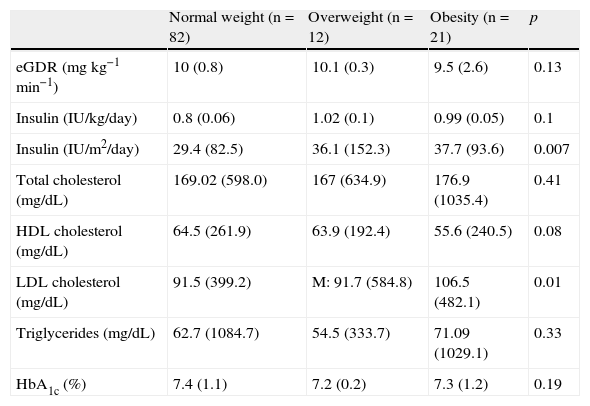
Table 1 shows insulin resistance, glycemic control, and lipid profile values of patients in the three weight groups.
Values of estimated glucose disposal rate, insulin dose, lipoprotein profile, and glycosylated hemoglobin in the different study groups distributed by weight.
| Normal weight (n=82) | Overweight (n=12) | Obesity (n=21) | p | |
| eGDR (mgkg−1min−1) | 10 (0.8) | 10.1 (0.3) | 9.5 (2.6) | 0.13 |
| Insulin (IU/kg/day) | 0.8 (0.06) | 1.02 (0.1) | 0.99 (0.05) | 0.1 |
| Insulin (IU/m2/day) | 29.4 (82.5) | 36.1 (152.3) | 37.7 (93.6) | 0.007 |
| Total cholesterol (mg/dL) | 169.02 (598.0) | 167 (634.9) | 176.9 (1035.4) | 0.41 |
| HDL cholesterol (mg/dL) | 64.5 (261.9) | 63.9 (192.4) | 55.6 (240.5) | 0.08 |
| LDL cholesterol (mg/dL) | 91.5 (399.2) | M: 91.7 (584.8) | 106.5 (482.1) | 0.01 |
| Triglycerides (mg/dL) | 62.7 (1084.7) | 54.5 (333.7) | 71.09 (1029.1) | 0.33 |
| HbA1c (%) | 7.4 (1.1) | 7.2 (0.2) | 7.3 (1.2) | 0.19 |
HbA1c, glycosylated hemoglobin; HDL, high density lipoprotein; LDL, low density lipoprotein; eGDR, estimated glucose disposal rate.
Values are given as mean (M) are variance (V).
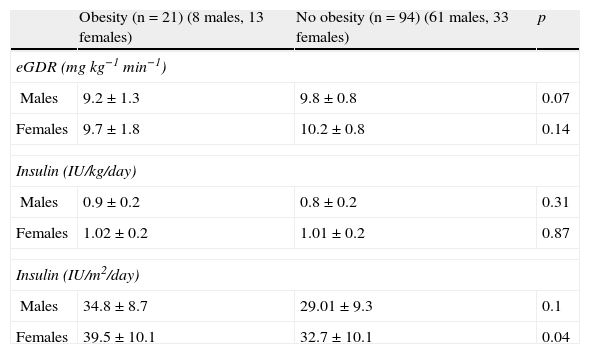
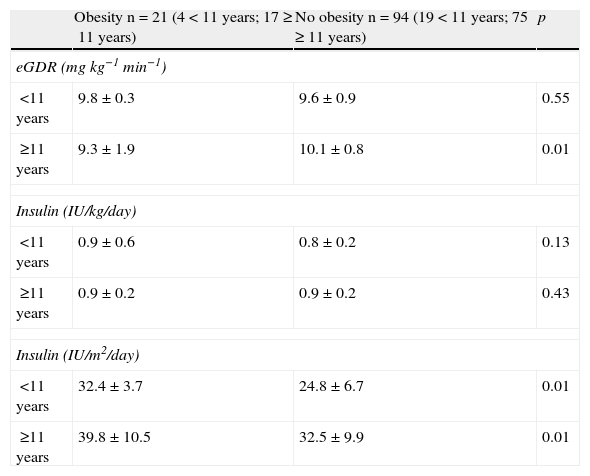
No correlation was seen between BMI and eGDR (r=−0.158; p=0.006). No statistically significant differences were found in eGDR between the groups with normal weight, overweight, and obese (Table 1). When patients were stratified by sex, no statistically significant differences were found either in eGDR between those with obesity and the rest of the sample (Table 2). However, age stratification showed that obese patients with T1DM aged 11 years or older had significantly lower eGDR as compared to patients with T1DM but no obesity (Table 3). By contrast, no statistically significant differences were seen in patients under 11 years of age (Table 3).
Insulin resistance markers by sex.
| Obesity (n=21) (8 males, 13 females) | No obesity (n=94) (61 males, 33 females) | p | |
| eGDR (mgkg−1min−1) | |||
| Males | 9.2±1.3 | 9.8±0.8 | 0.07 |
| Females | 9.7±1.8 | 10.2±0.8 | 0.14 |
| Insulin (IU/kg/day) | |||
| Males | 0.9±0.2 | 0.8±0.2 | 0.31 |
| Females | 1.02±0.2 | 1.01±0.2 | 0.87 |
| Insulin (IU/m2/day) | |||
| Males | 34.8±8.7 | 29.01±9.3 | 0.1 |
| Females | 39.5±10.1 | 32.7±10.1 | 0.04 |
eGDR, estimated glucose disposal rate.
Values are given as mean and standard deviation.
Insulin resistance markers by age.
| Obesity n=21 (4<11 years; 17≥11 years) | No obesity n=94 (19<11 years; 75≥11 years) | p | |
| eGDR (mgkg−1min−1) | |||
| <11 years | 9.8±0.3 | 9.6±0.9 | 0.55 |
| ≥11 years | 9.3±1.9 | 10.1±0.8 | 0.01 |
| Insulin (IU/kg/day) | |||
| <11 years | 0.9±0.6 | 0.8±0.2 | 0.13 |
| ≥11 years | 0.9±0.2 | 0.9±0.2 | 0.43 |
| Insulin (IU/m2/day) | |||
| <11 years | 32.4±3.7 | 24.8±6.7 | 0.01 |
| ≥11 years | 39.8±10.5 | 32.5±9.9 | 0.01 |
eGDR, estimated glucose disposal rate.
Values are given as mean and standard deviation.
No correlation was seen between BMI and insulin dose, expressed as IU/kg/day (r=0.075; p=0.003) or as IU/m2/day (r=0.290; p=0.034). When daily insulin dose in IU/kg/day was quantified, no significant differences were noted between patients with normal weight, overweight, and obesity (Table 1), as occurred after stratification by sex (Table 2) or age (Table 3).
On the other hand, when insulin dose per m2 body surface was quantified, significant differences were found between the groups of patients with normal weight, overweight, and obesity (Table 1), between females with obesity and all others (Table 2), and between obese and non-obese patients from the two age groups (Table 3).
Abdominal circumference, estimated glucose disposal rate, and insulin doseIn the study sample, no correlation was shown between abdominal circumference, eGDR, and insulin dose. The results were as follows: r=−0.271 (p=0.15) for eGDR, r=0.092 (p=0.004) for insulin dosage in IU/kg/day, and r=0.312 (p=0.02) for insulin dosage in IU/m2/day. No correlation was seen either between abdominal circumference and the above parameters after sex and age stratification.
Estimated glucose disposal rate and lipoprotein profileNo correlation was found between eGDR and plasma levels of TC, HDL-C, LCL-D, and TG. The results were as follows: r=−0.168 (p=0.23) for TC; r=−0.014 (p=0.08) for HDL-C; r=−0.132 (p=0.10) for LDL-C; and r=−0.278 (p=0.12) for TG.
Overweight, obesity, and lipoprotein profileAs regards the presence of a lipoprotein profile of cardiovascular risk and its relationship to overweight or obesity, significantly higher LDL-C levels were found in the group of obese patients as compared to the rest (Table 1). No significant differences in TC, HDL-C, and TG were seen between the different groups.
On the other hand, no correlation was found between increased abdominal circumference and the presence of a lipoprotein profile of cardiovascular risk (increased TC, LDL-C and TG, and decreased HDL-C). The results were as follows: r=−0.017 (p=0.05) for TC; r=−0.304 (p=0.17) for HDL-C; r=−0.143 (p=0.25) for LDL-C; and r=−0.206 (p=0.04) for TG.
Estimated glucose disposal rate, insulin dose, and glycosylated hemoglobinNo linear correlation was seen between the different IR markers analyzed and HbA1c. The results were as follows: r=−0.195 (p=0.08) for eGDR; r=0.089 (p=0.1) for insulin dosage in IU/kg/day; and r=0.250 (p=0.06) for insulin dosage in IU/m2/day.
Overweight, obesity, and glycosylated hemoglobinFinally, no significant differences were seen in HbA1c between the groups with normal weight, overweight, and obesity (Table 1).
DiscussionAlthough eGDR is a better predictor of the risk of vascular complications than insulin quantification,1,5,12 the studies were all conducted on patients older than 18 years. Thus, one of the limitations is that eGDR was obtained from an adult population only,4 so that the values defining high blood pressure were different from those used for pediatric patients.10 In addition, an increased waist–hip ratio in prepubertal children is not always related to an increase in visceral adiposity, but is often due to the greater relative size of intra-abdominal organs.13
Patients with overweight or obesity had lower eGDR values than the rest, but the differences were not significant. However, only 6.4% of our population aged 10–16 years met MS criteria, in contrast to the higher prevalence reported by Kilpatrick et al.,1 Chillaron et al.,5 Pambianco et al.,6 and Thorn et al.14 As regards the vascular complications of T1DM and the predicting role of eGDR, Chillaron et al.5 noted that patients with vascular complications have eGDR values less than 8.16mgkg−1min−1. Thorn et al.14 reported that patients with T1DM and elevated microalbuminuria have lower eGDR values, and Orchard et al.15 found a lower eGDR in patients with coronary changes. Although the population of this study had no vascular complications, patients with MS have a mean eGDR of 8.15mgkg−1min−1, similar to the value reported by Chillaron et al.5
Although a greater prevalence of overweight or obesity was found in girls in this study, there are no sex-related differences in eGDR. However, when patients were stratified by age, those aged 11 years with obesity had lower eGDR than all other patients. Considering that HBP had in our group little influence on eGDR, the waist–hip ratio determined its value to a great extent. Thus, in patients with pubertal development, in whom adipose pattern is similar to that of adults, an increase in abdominal circumference may be associated with increased intra-abdominal adiposity, which may in turn induce IR. While the stratification of eGDR by Tanner stage would allow for changes to be seen as puberty progresses, it could not be done in this study due to inadequate sample size. Stratification by age group was therefore intended to differentiate predominantly prepubertal patients from those with pubertal development.
As regards insulin dose in IU/kg/day, no significant differences were found in our study between patients with normal weight and those with overweight and obesity, and no correlation was found between insulin dose and BMI. Similarly, Shenoy et al.16 and Chillaron et al.5,17 found no differences either in insulin requirements between patients with overweight–obesity and all others. Ferrante et al.18 noted an increase in insulin dose but showed no correlation with weight. Although insulin dose varied depending on the regimen used, it does not appear to have been a relevant aspect in our patients because insulin glargine and insulin aspart are predominantly used as slow and rapid action analogs respectively. With regard to insulin quantification of IU/m2/day, Reinehr et al.19 showed that increased BMI correlated to an increase in the dose expressed in m2 of body surface, and concluded that the dose in IU/m2/day reflects the influence of overweight on IR in T1DM in pediatric patients better than the dose expressed in IU/kg/day. The current study also showed significant differences between the groups with normal weight, overweight, and obesity, which would confirm that this parameter is more sensitive than insulin dosage in IU/kg/day to reflect changes in insulin sensitivity induced by overweight. On the other hand, no correlation was found in this population between insulin dose and abdominal circumference, which would suggest that this parameter, although related in many pediatric studies with the development of IR and MS,20–24 does not appear to be in itself a marker of insulin sensitivity in diabetic patients younger than 18 years.
Although lipoprotein changes are common in adults with T1DM,25 only five patients (4.3%) in this study had HDL-C levels less than 40mg/dL, and only three patients (2.6%) had TG levels higher than 150mg/dL, which are the values defining MS according to the IDF.11 It should also be noted that mean LDL-C levels are significantly higher in obese as compared to all other patients, representing an additional cardiovascular risk. In this regard, patients with T1DM and IR have been shown to have a more atherogenic profile, with higher LDL-C levels and lower HDL-C levels.26 Our group showed no correlation either between abdominal circumference and the different lipoproteins, in contrast to other studies.27 On the other hand, the absence of a correlation between eGDR and plasma levels of the different lipoproteins may have been due to the low prevalence of lipid profile changes in this population.
As occurred in other studies conducted in children with T1DM,16 our study found no significant weight-related differences in HbA1c. In this regard, mention should be made of the importance for glycemic control of other factors not addressed in this study, such as self-measurement frequency, the correction of hyperglycemia with additional insulin doses, dietary transgressions, physical exercise, intercurrent diseases, and individual variability.
In conclusion, patients older than 11 years with T1DM and obesity have lower eGDR values than non-obese patients of the same age group with T1DM. eGDR may be an IR marker in these patients, and its assessment may be considered to establish strategies that allow for optimum metabolic control. However, further studies are needed in pediatric patients with T1DM to ascertain the role of eGDR in the development of IR.
FundingThis study was awarded a grant for research groups on health sciences from the Fundación Sociosanitaria de Castilla-La Mancha (reference AN-2010/49), and was also funded by the Fundación Sociedad Española de Endocrinología Pediátrica.
Conflicts of interestThe authors state that they have no conflicts of interest.
Please cite this article as: Palomo Atance E, Ballester Herrera MJ, Giralt Muiña P, Ruiz Cano R, León Martín A, Giralt Muiña J. Tasa estimada de disposición de glucosa en pacientes menores de 18 años con diabetes mellitus tipo 1 y sobrepeso-obesidad. Endocrinol Nutr. 2013;60:379–385.
