


Spanish National Health Surveys do not establish synergistic relations between variables. The purpose of this study was to perform a deeper historical analysis of body mass index (BMI) and its relation to other parameters included in the questionnaire for children.
Material and methodsData from interviews conducted (between 1987 and 2006) to parents and guardians of schoolchildren aged 9–15 years were analyzed. Height and weight reported by parents were selected and used to calculate BMI. Subjects were stratified by age, gender, time spent sleeping and watching television and, finally, frequency of physical activity. The historical trend of BMI and its dependence on the above factors were analyzed using ANOVA tests.
Results and conclusionsSignificant weight and height increases were seen, which were more marked in boys aged 12–15 years. Influence of physical activity on BMI was shown, but decreased (p<.001) as exercise time increased. By contrast, BMI increased (p<.001) as time spent watching television increased. On the other hand, the role of sleep as modulator of body size was confirmed, since schoolchildren aged 9–11 years who slept over 9h had lower BMIs (p<.001). In subjects aged 12–15, BMI decreased (p<.001) from 6h of sleep.
Las Encuestas Nacionales de Salud no establecen relaciones sinérgicas entre variables. El propósito del presente trabajo es profundizar en el análisis secular del índice de masa corporal (IMC) y su relación con otros parámetros contenidos en el cuestionario de menores.
Material y métodosSe analizan datos de las entrevistas realizadas (entre 1987 y 2006) a padres o tutores de escolares de 9 a 15 años. Se seleccionaron talla y peso declarados por los progenitores, calculando posteriormente el IMC. Se establecen categorías en función del sexo y edad, tiempo dedicado al sueño y a ver televisión y, por último, frecuencia de la actividad física. Mediante pruebas de ANOVA se analiza la evolución secular del IMC y su dependencia de los factores mencionados.
Resultados y conclusionesSe verifica un significativo aumento secular del peso y talla que, entre los 12 y 15 años, es de mayor intensidad en la serie masculina. Se constata la influencia de la actividad física sobre el IMC, que disminuye al aumentar las sesiones destinadas al ejercicio (p<0,001). En contraposición, dicho índice se eleva (p<0,001) con el tiempo dedicado a ver televisión. Se confirma también el papel del descanso nocturno como modulador del tamaño corporal, ya que los escolares de 9 a 11 años que duermen más de 9h tienen un IMC menor (p<0,001) que los que descansan menos. Entre los 12 y 15 años el IMC disminuye (p<0,001) a partir de las 6h de sueño.
Obesity is a multifactorial disease which has become a growing public health problem because of its relation to the main causes of morbidity and mortality in both developed and developing countries. Obesity is especially alarming in children and adolescents, and studies focused on such populations aimed at analyzing its incidence and course are therefore frequently published.
Thus, data from different research projects conducted since 2000 may be found for Spain. These include the Cuenca study,1 reporting overweight and obesity rates of 26.6% and 3.9% respectively in schoolchildren aged 9–12 years, the EnKid2 study, reporting rates of 12.4% and 13.9% respectively in subjects aged 2–24 years, and the project Alimentación y Valoración del Estado Nutricional de los Adolescentes (AVENA),3 reporting excess weight in 25.69% of Spanish males and 19.13% of females aged 13–18.5 years. More recent and complex studies in samples greater than 7000 subjects demonstrate that excess weight in children has not slowed down. Thus, our research group4 found that 27.4% of boys and 21.5% of girls aged 6–12 years were overweight or obese. Similarly, the study Alimentación, Actividad física, Desarrollo Infantil y Obesidad (ALADINO)5 reported excess weight in 34.1% of boys and 28.6% of girls aged 6–9 years.
Large scale research studies financed by the EU aimed at achieving a deeper understanding of the genetic and environmental aspects causing childhood obesity in order to establish guidelines for health promotion and disease prevention are also available. Examples of this include the project Healthy Lifestyle in Europe by Nutrition in Adolescence (HELENA),6 a meta-analysis of all studies indexed in PubMed published between 1990 and 2007, and the so-called Identification and prevention of Dietary-and lifestyle-induced health EFfects In Children and infantS (IDEFICS).7 The purpose of these ambitious researches was to establish effective strategies which, while respecting the cultural differences at European level, would slow down this dangerous problem in children as much as possible.
Most of the abovementioned epidemiological studies were conducted on large samples and using baseline anthropometric measures taken directly from the participants. This procedure is not always possible for reasons of time and budget. Because of this, self-reported biometric information is sometimes used. This was the method used in the so-called National Health Surveys (Encuestas Nacionales de Salud, ENS), started in Spain in 1987 and published with varying regularity until 2006.
Studies in children or adolescents using this approach show some disagreement between measures taken directly from the subjects and those perceived by them. Thus, a study conducted in a Madrid population8 and another study in a Valencian population9 both showed a tendency to underestimate weight and overestimate height. Outside Spain, studies conducted in Chinese adolescents10 and Israeli schoolchildren11 in which BMI values were estimated from data reported by the subjects were lower than the actual values directly obtained using anthropometric measurements. Despite the conflicting results, most of the studies mentioned suggest a greater agreement between objective and self-reported values in the male series.
This disagreement between actual and self-reported data does not represent a disadvantage in achieving the goal of this study, which is not to estimate exact overweight or obesity rates, but to analyze the trend of excess weight over time and to quantify the influence of certain factors that determine overweight. The specific aim of this study was to ascertain the secular evolution of weight, height, and the body mass index (BMI), as well as the effect of exercise, sleep time, and time spent watching television (TV) on the BMI.
Subjects and methodsData recorded in the ENS for the years 1987, 1993, 1995, 1997, 2001, 2003 and 2006,12 collected at interviews with the parents or guardians of minors, were used. It should be noted that only subjects aged 9–15 years were selected and analyzed in this research. All the information was requested by the Spanish Ministry of Health, which provided the files in a compact text format where the answers to each question was coded with a number occupying one or several columns. Processing this information was complex because it required identification of the position and coding system of each question, which also changed in each edition. A script in Perl language specific for each year was programmed to process data files, extracting the columns corresponding to the questions of interest and saving data in a new delimited text file. This file was opened with Microsoft Excel, which allowed for its inspection, and was subsequently exported to SPSS software (version 17.0) for statistical analysis. Filtering to eliminate incomplete or abnormal data was performed in Excel or SPSS.
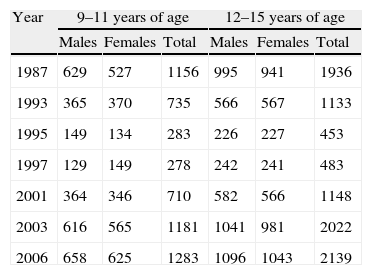
It should be noted that the format of the ENS was not consistent over time. Thus, questions were added, removed, or reformulated in successive editions, which makes secular analysis difficult. Similarly, the number of subjects in the sample significantly varied in the different surveys (Table 1). Specifically, clearly smaller subject samples were used for the 1995 and 1997 surveys as compared to all other ENSs. In addition, clearly abnormal data were seen (for some variables) in the files provided, which required a clearance process before mathematical treatment. Thus, subjects with no assigned age, sex, or essential anthropometric data such as weight and height were excluded.
Number of subjects interviewed in the different editions of the National Health Survey.
| Year | 9–11 years of age | 12–15 years of age | ||||
| Males | Females | Total | Males | Females | Total | |
| 1987 | 629 | 527 | 1156 | 995 | 941 | 1936 |
| 1993 | 365 | 370 | 735 | 566 | 567 | 1133 |
| 1995 | 149 | 134 | 283 | 226 | 227 | 453 |
| 1997 | 129 | 149 | 278 | 242 | 241 | 483 |
| 2001 | 364 | 346 | 710 | 582 | 566 | 1148 |
| 2003 | 616 | 565 | 1181 | 1041 | 981 | 2022 |
| 2006 | 658 | 625 | 1283 | 1096 | 1043 | 2139 |
These interviews addressed multiple variables, of which only some were selected for analysis in this study. Specifically, height and weight were reported in response to the following question asked to parents or guardians: what is the height and weight of the child? The BMI was calculated from these data. Questions about sleep time during the night and time spent watching TV were also analyzed. Three sleep time categories (6–7, 8–9, and 10–11h of sleep, which may be equated to short, normal, and longer than average sleep times) were established. As regards the time spent watching TV, five levels (occasional, 1, 2, 3, and more than 3h) were established based on the distribution of the variable. Finally, the practice of physical exercise was also included, respecting the categories assigned by the ENS (none, occasional, several times per week or per month).
After dividing the sample by sex and age group (9–11 and 12–15 years of age), descriptive statistics were calculated for the above variables. Subsequently, an ANOVA was performed, using age as a co-variate, to test secular changes and check the effect on the BMI of sleep time, time watching TV, and physical exercise time. Finally, multiple regression analysis was performed using the BMI as the dependent variable and physical activity time, sleep time, and time spent watching TV as independent variables.
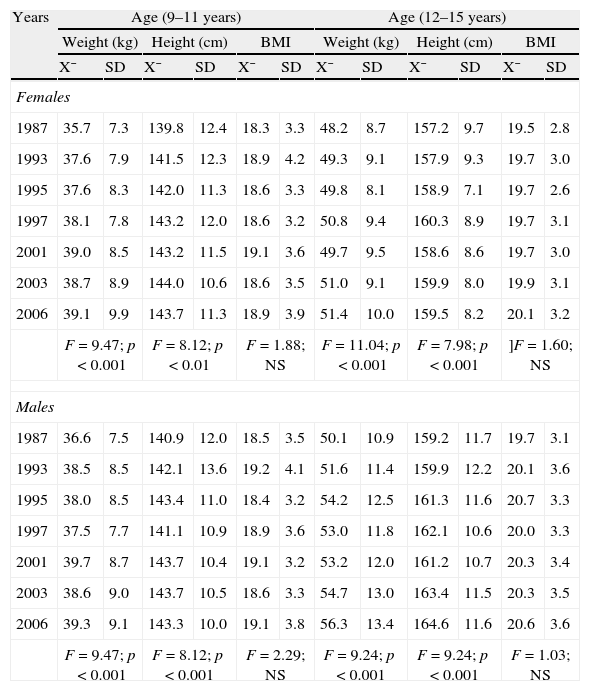
ResultsTable 2 shows the changes in the anthropometric characteristics analyzed from 1987 to 2006. Height and weight significantly increased (p<0.001) in both males and females and in both age groups. However, no significant change was seen in the BMI. It may also be seen that between 9 and 11 years of age, the small sexual dimorphism inherent to age was maintained over the same period, while gender differences secularly increased between 12 and 15 years as the result of a greater weight and height increase in the male series.
Changes over time in weight, height, and the body mass index (data reported).
| Years | Age (9–11 years) | Age (12–15 years) | ||||||||||
| Weight (kg) | Height (cm) | BMI | Weight (kg) | Height (cm) | BMI | |||||||
| X¯ | SD | X¯ | SD | X¯ | SD | X¯ | SD | X¯ | SD | X¯ | SD | |
| Females | ||||||||||||
| 1987 | 35.7 | 7.3 | 139.8 | 12.4 | 18.3 | 3.3 | 48.2 | 8.7 | 157.2 | 9.7 | 19.5 | 2.8 |
| 1993 | 37.6 | 7.9 | 141.5 | 12.3 | 18.9 | 4.2 | 49.3 | 9.1 | 157.9 | 9.3 | 19.7 | 3.0 |
| 1995 | 37.6 | 8.3 | 142.0 | 11.3 | 18.6 | 3.3 | 49.8 | 8.1 | 158.9 | 7.1 | 19.7 | 2.6 |
| 1997 | 38.1 | 7.8 | 143.2 | 12.0 | 18.6 | 3.2 | 50.8 | 9.4 | 160.3 | 8.9 | 19.7 | 3.1 |
| 2001 | 39.0 | 8.5 | 143.2 | 11.5 | 19.1 | 3.6 | 49.7 | 9.5 | 158.6 | 8.6 | 19.7 | 3.0 |
| 2003 | 38.7 | 8.9 | 144.0 | 10.6 | 18.6 | 3.5 | 51.0 | 9.1 | 159.9 | 8.0 | 19.9 | 3.1 |
| 2006 | 39.1 | 9.9 | 143.7 | 11.3 | 18.9 | 3.9 | 51.4 | 10.0 | 159.5 | 8.2 | 20.1 | 3.2 |
| F=9.47; p<0.001 | F=8.12; p<0.01 | F=1.88; NS | F=11.04; p<0.001 | F=7.98; p<0.001 | ]F=1.60; NS | |||||||
| Males | ||||||||||||
| 1987 | 36.6 | 7.5 | 140.9 | 12.0 | 18.5 | 3.5 | 50.1 | 10.9 | 159.2 | 11.7 | 19.7 | 3.1 |
| 1993 | 38.5 | 8.5 | 142.1 | 13.6 | 19.2 | 4.1 | 51.6 | 11.4 | 159.9 | 12.2 | 20.1 | 3.6 |
| 1995 | 38.0 | 8.5 | 143.4 | 11.0 | 18.4 | 3.2 | 54.2 | 12.5 | 161.3 | 11.6 | 20.7 | 3.3 |
| 1997 | 37.5 | 7.7 | 141.1 | 10.9 | 18.9 | 3.6 | 53.0 | 11.8 | 162.1 | 10.6 | 20.0 | 3.3 |
| 2001 | 39.7 | 8.7 | 143.7 | 10.4 | 19.1 | 3.2 | 53.2 | 12.0 | 161.2 | 10.7 | 20.3 | 3.4 |
| 2003 | 38.6 | 9.0 | 143.7 | 10.5 | 18.6 | 3.3 | 54.7 | 13.0 | 163.4 | 11.5 | 20.3 | 3.5 |
| 2006 | 39.3 | 9.1 | 143.3 | 10.0 | 19.1 | 3.8 | 56.3 | 13.4 | 164.6 | 11.6 | 20.6 | 3.6 |
| F=9.47; p<0.001 | F=8.12; p<0.001 | F=2.29; NS | F=9.24; p<0.001 | F=9.24; p<0.001 | F=1.03; NS | |||||||
NS: not significant.
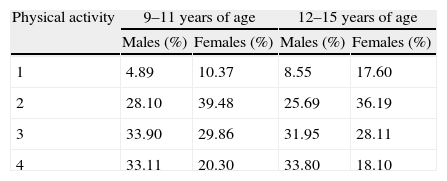
Table 3 shows that males, mainly the older ones, spent more time doing sport than girls, and that the proportion of subjects who practiced no physical activity increased with age, particularly in the female subjects. It may be noted that a certain amount of exercise had a great impact on the BMI in both sexes and age groups, as may clearly be seen in the younger group (Fig. 1). Thus, the BMI gradually and significantly decreased as a function of the time devoted to physical activity. For example, in boys aged 9–11 years, BMI values ranged from 21.2 (in those with no physical activity) to 18.6 (in those doing intense exercise).
Proportion of schoolchildren who perform physical activity.
| Physical activity | 9–11 years of age | 12–15 years of age | ||
| Males (%) | Females (%) | Males (%) | Females (%) | |
| 1 | 4.89 | 10.37 | 8.55 | 17.60 |
| 2 | 28.10 | 39.48 | 25.69 | 36.19 |
| 3 | 33.90 | 29.86 | 31.95 | 28.11 |
| 4 | 33.11 | 20.30 | 33.80 | 18.10 |
1=no exercise; 2=occasional exercise; 3=regular exercise (several times per month); 4=intense exercise (several times per week).

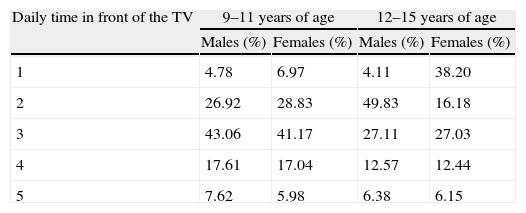
TV watching is undoubtedly associated with a sedentary lifestyle. Our results show that the time spent watching TV decreased with age in both sexes, although this trend was more evident in girls. However, separate analysis of both sexes showed (Table 1) that the time spent watching TV had a significant impact on the BMI (p<0.001) in both sexes and age groups, as shown in Fig. 2.

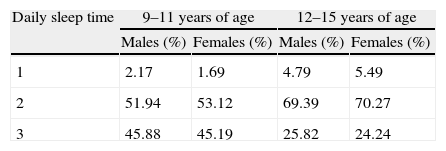
As regards sleep time during the night, the data were very similar for both sexes within the same age group. However, as was expected, the older subjects slept less. When sleep time was related to the BMI, the latter significantly decreased (p<0.001) as sleep time increased in both males and females (Fig. 3). It should also be noted that this occurred in the youngest subjects from 9h of sleep, while in older subjects the decrease was always gradual (Tables 4 and 5).

Proportion of children by time spent watching television.
| Daily time in front of the TV | 9–11 years of age | 12–15 years of age | ||
| Males (%) | Females (%) | Males (%) | Females (%) | |
| 1 | 4.78 | 6.97 | 4.11 | 38.20 |
| 2 | 26.92 | 28.83 | 49.83 | 16.18 |
| 3 | 43.06 | 41.17 | 27.11 | 27.03 |
| 4 | 17.61 | 17.04 | 12.57 | 12.44 |
| 5 | 7.62 | 5.98 | 6.38 | 6.15 |
1=occasionally; 2=less than 1h; 3=from 1 to 2h; 4=from 2 to 3h; 5=more than 3h.
Regression analysis showed that when the effects of exercise, sleep, and time watching TV were simultaneously analyzed, the same pattern seen for each separate variable was maintained. Thus, when the time devoted to the first two activities considered was decreased, the BMI significantly decreased, while watching TV increased the BMI (hours of physical activity: β=−0.309, p<0.001; sleep time: β=−0.194, p<0.001; time watching TV: β=0.257; p<0.001).
DiscussionThe problem with the ENSs is that they include very extensive information which has not been processed and analyzed in adequate depth, because the results published are mainly descriptive in nature and often do not establish synergistic relations between the different variables. In addition, some biometric data recorded were not measured directly in subjects, but were reported by the person interviewed, and may therefore have differed from the actual values. This potential deviation has been demonstrated in multiple studies also focused on the ENSs13 as well as those conducted on both Spanish14 and American15,16 populations.
However, such eventual changes may be irrelevant depending on the study objective. Thus, some authors processed data from these interviews to assess height changes in Spain from 18 years of age,17 or analyzed the prevalence of adult obesity based on the 1987 ENS.18 This problem was also unimportant in this study because its objective was, in addition to examining changes in weight and the BMI from 1987 to 2006, to establish the impact of specific factors determining excess weight.
Leaving out these disadvantages, it is extremely interesting to make use of the valuable information contained in all editions of these ENSs to conduct new analyses from a longitudinal and multivariate perspective. This is why this research studied this question in greater depth and, focusing on the study of the data contained in the questionnaires, led to the results discussed in the previous section.
The data obtained here regarding how the BMI decreased depending on the time devoted to physical activity agree with those reported in two previous studies by this same research group, so further demonstrating the effect of exercise on the reduction of adiposity levels. One of those studies,19 in which somatotypes were analyzed, showed that the endomorphic component was reduced in schoolchildren of both sexes as a function of exercise time, and that mesomorphism was also significantly increased in males. In the other study, much more recent,20 a significant decrease in percent body fat was found in female adolescents aged 13–19 years depending on exercise time, ranging from 26.9% in the most sedentary girls to 20.7% in the most active girls, i.e. those who practiced exercise more than 9h per week. Other studies where accelerometers were used to estimate the level of physical activity also reported its positive effect on adipose tissue reduction. Thus, a large study on US adolescents21 noted that a single minute of strenuous physical activity resulted in a decrease of 0.05kg/m2 in the BMI and of fat by 0.12%.
In relation to the foregoing, this research has shown that a sedentary lifestyle has a significant impact on the BMI. In this regard, the time spent watching TV is a factor predisposing to excess weight. Indeed, as reported and discussed in some articles,22 TV acts as a mediator between consumerism and obesity because of the widespread habit of eating in front of the TV and nibbling while watching it. Moreno and Toro22 reported that 81% of Mexican children of school age watch the TV while eating and 80% eat some snack while watching it. Many studies reported similar findings. Thus, one of the first such studies23 analyzed a population of US children and showed significant differences in the BMI between children who watched TV for longer than 4h daily and those who watched it for less than 2h. Other studies24 along this same line analyzed in great detail the influence of TV on dietary habits and overweight in children and even established its relation to the occurrence of eating disorders.
Among the multiple studies conducted on the subject, mention should be made of the HELENA group study,25 which supported the finding that TV has a more harmful effect than video games or the computer on the development of overweight in children. Cano Garcinuño et al.26 working in primary care clinics in Palencia, analyzed the potential impact of multiple socioeconomic and family factors on the risk of child obesity. Their conclusions were that sitting in front of the TV set for longer than 2h daily is, together with parental overweight, almost the only factor with a significant impact. Santomauro et al.27 verified the combined effect of moderate physical exercise and a reduction in time spent watching TV or playing video games on BMI decrease and some comorbidities associated with obesity, such as fatty liver, in adolescents with excess weight enrolled in a one-year program which aimed at changing their lifestyle.
The previous section also showed that an inversely proportional association exists between sleep time and predisposition to overweight during childhood and adolescence. Various researchers have reached the same conclusion. Thus, a longitudinal study28 demonstrated that a night-time rest shorter than 12h during the first two years of life was significantly related to greater skinfold thickness and a higher BMI at 3 years of age. In agreement with this, meta-analyses performed in preschool children29,30 and studies by other authors in schoolchildren aged 30 months to 15 years31–33 demonstrated a significant increase in obesity risk depending on the decrease in sleep time.
We may now wonder what the true relationship is between a lack of sleep and a trend to overweight or obesity. Some authors34 who have addressed this question suggest that obese children have a night-time rest of poorer quality than children with normal weight. On the other hand, other studies35–37 have shown that subjects who sleep less hours have low leptin and high ghrelin levels. Leptin and ghrelin are hormones involved in the hypothalamic regulation of appetite.
ConclusionsThe ENSs are a good tool for obtaining an overview of the relationship between lifestyle and body size, expressed through the BMI. They also allow for a comparative analysis of the behavior of this relationship over time. However, the lack of uniform criteria in the sampling and design of the questions in the different editions partly limits their value for conducting research of a secular nature.
Despite this, this study reveals that data taken from the ENSs demonstrate a significant increase in weight and height reported for schoolchildren between 1987 and 2006, an increase which is greater in males as compared to females. This means that sex differences in BMI increased over the study period.
The impact of exercise on the BMI, which gradually decreases as the time usually devoted to physical activity increases, was shown in both sexes. By contrast, the BMI significantly increased as a function of the number of hours spent watching TV. On the other hand, the role played by sleep time as an element modulating body size was confirmed by the fact that schoolchildren aged 9–11 years who slept more than 9h had a significantly lower BMI than those who slept less. In older children (12–15 years of age), the effect of night-time rest occurs earlier, so that the BMI decreases from 6h of sleep.
Conflicts of interestThe authors state that they have no conflicts of interest.
Please cite this article as: González Montero de Espinosa M, Herráez Á, Marrodán Serrano MD. Factores determinantes del índice de masa corporal en escolares españoles a partir de las Encuestas Nacionales de Salud. Endocrinol Nutr. 2013;60:371–378.
