


Exenatide, a GLP-1 receptor agonist for adjuvant treatment of type 2 diabetes mellitus (T2DM), has been shown to be as effective as insulin glargine (IG) for reducing glycated hemoglobin levels combined with metformin or/and sulfonylureas. Exenatide is associated to weight reduction and a higher incidence of gastrointestinal adverse events.
The objective of this study was to assess the cost-effectiveness of exenatide as compared to IG in obese patients with T2DM not achieving an adequate blood glucose control from the perspective of the Spanish healthcare system.
MethodsPharmacoeconomic model inputs were obtained from an obese subpopulation (BMI≥30kg/m2) of an international, randomized, controlled clinical trial comparing exenatide with IG in poorly controlled T2DM patients, and were supplemented with country-specific data.
ResultsExenatide was associated to improvements in life-years gained and quality-adjusted life years (QALYs) by 0.11 and 0.62, respectively, versus IG. Direct costs were €9306 higher as compared to IG (€47,010 versus €37,704, with increased pharmacy costs as the main driver). Exenatideís incremental cost-effectiveness ratio was €15,068 per QALY gained versus IG.
ConclusionsExenatide was associated to greater clinical benefits and higher costs in obese T2DM patients as compared to IG. Considering a willingness-to-pay threshold of €30,000 per QALY gained in the Spanish setting, exenatide represents an efficient option in comparison with IG.
Exenatida es un agonista del receptor de GLP-1 empleado como tratamiento adyuvante en la diabetes mellitus tipo 2 (DM2), que ha demostrado ser tan eficaz como insulina glargina (IG) reduciendo la concentración de hemoglobina glucosilada, cuando se administra en combinación con metformina o/y sulfonilureas. Exenatida se asocia a una reducción de peso y a una mayor incidencia de acontecimientos adversos de tipo gastrointestinal.
El objetivo de este estudio fue evaluar el coste-efectividad de exenatida frente a IG en pacientes obesos con DM2, que no alcanzan un control glucémico adecuado, desde la perspectiva del sistema nacional de salud.
Material y métodosSe utilizó un modelo farmacoeconómico que incluyó información procedente de un ensayo clínico internacional, aleatorizado y controlado, que comparaba exenatida con IG, en pacientes con un inadecuado control de la glucosa, en concreto de la subpoblación de pacientes obesos (IMC≥30kg/m2), y de datos específicos del país.
ResultadosExenatida se asocia con un incremento de años de vida ganados y años de vida ajustados por calidad (AVAC) (0,11 y 0,62, respectivamente), frente a IG. Los costes directos se incrementaron 9.306 € en comparación con IG (47.010 frente a 37.704 €) siendo los costes farmacológicos los más importantes. Esto se tradujo en un coste-efectividad incremental de 15.068 €/AVAC de exenatida frente a IG.
ConclusionesEn pacientes obesos con DM2, exenatida se asocia con mayores beneficios clínicos y mayores costes que IG. Considerando el umbral de disposición a pagar de 30.000 € /AVAC para España, exenatida representa una opción eficiente en comparación con IG.
The chronic and progressive nature of type 2 diabetes mellitus (T2DM) represents a significant challenge for the Spanish healthcare system. The current prevalence of diabetes in Spain is estimated at 8.7%,1 and T2DM accounts for 90% of the cases of diabetes.2 In terms of overall impact on population mortality, diabetes represented in 2006 the eighth leading cause of death in Spain.3 As regards to financial impact, diabetes treatment accounts for approximately 6% of total annual costs in each of the 17 Spanish regions.4 Treatment of complications and hospitalizations are probably the main factors accounting for this financial impact. Different options are available to control blood glucose in patients with T2DM. A new drug class, GLP-1 (glucagon like peptide-1) receptor agonists, has recently been launched into the market. The first member of this class marketed, exenatide, an injectable synthetic peptide, has been shown to decrease not only blood glucose (to a similar extent to current insulin analogues) but also weight (an effect not seen with insulins).5 Exenatide has also been shown to decrease postprandial glucose levels and to delay gastric emptying.6 In addition, data from different long-term, open-label studies have shown exenatide to have a sustained effect (for a period of 3 years) on glycosylated hemoglobin (HbA1c) levels.7
Because of the growing population of diabetic patients and the increasing healthcare costs, new interventions developed to improve patient health have to be effective and show a good cost-effectiveness ratio. Financial evaluations comparing exenatide and insulin glargine (IG) have recently been reported.8–10 However, none of these evaluations assessed the efficiency of exenatide in the subpopulation of Spanish obese patients with T2DM. In view of this need, the study objective was to assess the cost-effectiveness of exenatide and to compare it to IG in the Spanish healthcare setting in patients with obesity and T2DM from the perspective of the healthcare provider.
Patients and methodsModelThe IMS CORE Diabetes Model was used in this analysis.11,12 Long-term clinical and financial outcomes were estimated, taking as reference the data collected in a multinational, randomized clinical trial conducted by Heine et al.5 (Clinical Trials.gov identifier: NCT00082381). This 26-week study enrolled patients with T2DM not achieving a HbA1c value <7.0% despite administration of maximum effective doses of metformin and/or a sulfonylurea. Patients were randomized to treatment with exenatide (twice daily) or IG (once daily), administered in combination with the oral antidiabetic the patient was taking. HbA1c concentration was measured as 12 and 26 weeks of randomization.
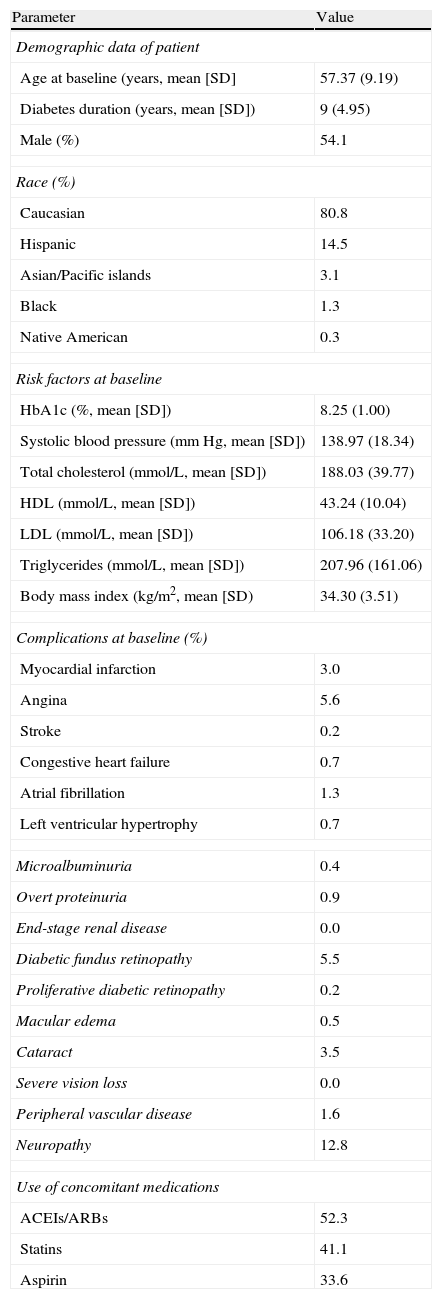
Characteristics of cohorts and treatment efficacyBaseline demographic data, complications, and the most relevant concomitant medications were considered to define a patient cohort representative of this whole patient subgroup, with a body mass index (BMI) ≥30kg/m2, taken from the two treatment groups of the intent-to-treat population of the Heine et al. clinical trial5 (n=318) (Table 1). Based on these data, long-term results were estimated using a hypothetical population of 1000 patients (with each of whom 1000 simulations were performed in the model), 54.1% males, with a mean age at baseline of 57.4 years. At baseline, mean diabetes duration was 9 years, mean HbA1c concentration was 8.25%, and mean BMI was 34.3kg/m2. In this analysis it was assumed that patients would continue to receive the same treatment throughout the simulation (i.e. for 35 years or until patient death).
Patient characteristics, complications, and treatments at baseline.
| Parameter | Value |
| Demographic data of patient | |
| Age at baseline (years, mean [SD] | 57.37 (9.19) |
| Diabetes duration (years, mean [SD]) | 9 (4.95) |
| Male (%) | 54.1 |
| Race (%) | |
| Caucasian | 80.8 |
| Hispanic | 14.5 |
| Asian/Pacific islands | 3.1 |
| Black | 1.3 |
| Native American | 0.3 |
| Risk factors at baseline | |
| HbA1c (%, mean [SD]) | 8.25 (1.00) |
| Systolic blood pressure (mmHg, mean [SD]) | 138.97 (18.34) |
| Total cholesterol (mmol/L, mean [SD]) | 188.03 (39.77) |
| HDL (mmol/L, mean [SD]) | 43.24 (10.04) |
| LDL (mmol/L, mean [SD]) | 106.18 (33.20) |
| Triglycerides (mmol/L, mean [SD]) | 207.96 (161.06) |
| Body mass index (kg/m2, mean [SD) | 34.30 (3.51) |
| Complications at baseline (%) | |
| Myocardial infarction | 3.0 |
| Angina | 5.6 |
| Stroke | 0.2 |
| Congestive heart failure | 0.7 |
| Atrial fibrillation | 1.3 |
| Left ventricular hypertrophy | 0.7 |
| Microalbuminuria | 0.4 |
| Overt proteinuria | 0.9 |
| End-stage renal disease | 0.0 |
| Diabetic fundus retinopathy | 5.5 |
| Proliferative diabetic retinopathy | 0.2 |
| Macular edema | 0.5 |
| Cataract | 3.5 |
| Severe vision loss | 0.0 |
| Peripheral vascular disease | 1.6 |
| Neuropathy | 12.8 |
| Use of concomitant medications | |
| ACEIs/ARBs | 52.3 |
| Statins | 41.1 |
| Aspirin | 33.6 |
ARBs: angiotensin II receptor blockers; SD: standard deviation; HbA1c: glycosylated hemoglobin; HDL: high-density lipoprotein; ACEIs: angiotensin-converting enzyme inhibitors; LDL: low-density lipoprotein.
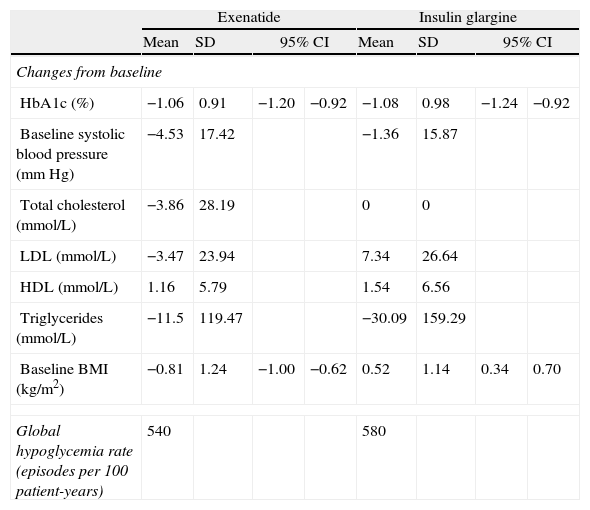
In simulations, effects of intervention were based on the results obtained in the same patient subgroup from the clinical trial as used for the simulation cohort (i.e. those with a BMI≥30kg/m2) (Table 2). Treatment with exenatide was associated to a 1.06% decrease in HbA1c compared to baseline, while treatment with IG resulted in a 1.08% reduction. The most marked difference between treatments was seen in BMI change from baseline: while exenatide caused a 0.81kg/m2 reduction, IG was associated to a 0.52kg/m2 increase in BMI. No severe hypoglycemic episodes occurred during the study, and rates of mild hypoglycemic episodes were similar in both treatment groups.
Summary of results of interventions.
| Exenatide | Insulin glargine | |||||||
| Mean | SD | 95% CI | Mean | SD | 95% CI | |||
| Changes from baseline | ||||||||
| HbA1c (%) | −1.06 | 0.91 | −1.20 | −0.92 | −1.08 | 0.98 | −1.24 | −0.92 |
| Baseline systolic blood pressure (mmHg) | −4.53 | 17.42 | −1.36 | 15.87 | ||||
| Total cholesterol (mmol/L) | −3.86 | 28.19 | 0 | 0 | ||||
| LDL (mmol/L) | −3.47 | 23.94 | 7.34 | 26.64 | ||||
| HDL (mmol/L) | 1.16 | 5.79 | 1.54 | 6.56 | ||||
| Triglycerides (mmol/L) | −11.5 | 119.47 | −30.09 | 159.29 | ||||
| Baseline BMI (kg/m2) | −0.81 | 1.24 | −1.00 | −0.62 | 0.52 | 1.14 | 0.34 | 0.70 |
| Global hypoglycemia rate (episodes per 100 patient-years) | 540 | 580 | ||||||
SD: standard deviation; HbA1c: glycosylated hemoglobin; HDL: high-density lipoprotein cholesterol; CI: confidence interval; BMI: body mass index; LDL: low-density lipoprotein cholesterol.
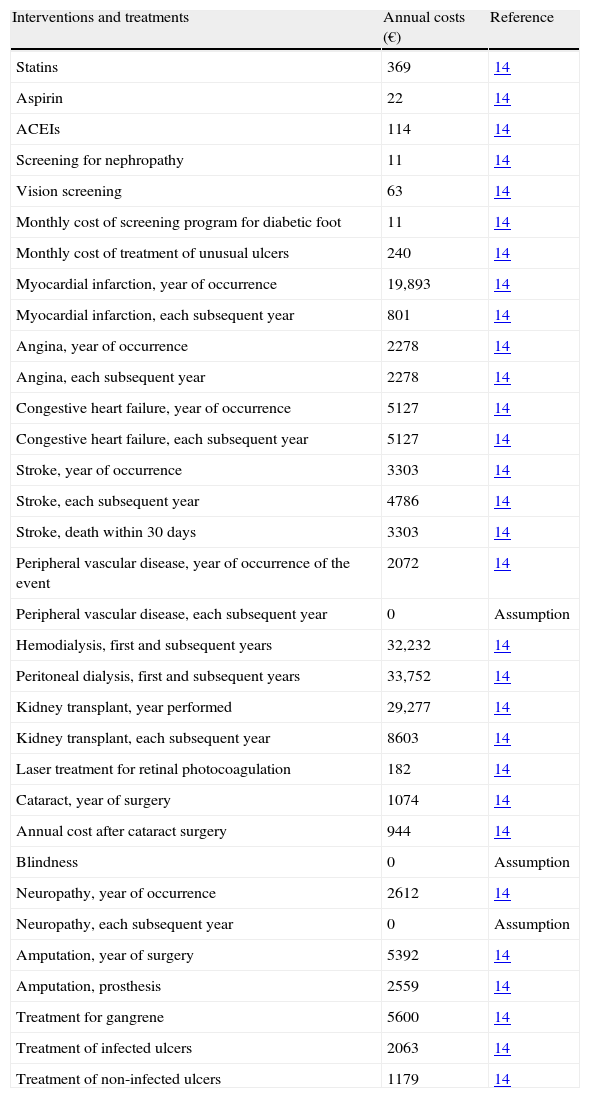
In the analysis performed from the perspective of the healthcare provider, specific cost data for Spain were included (Table 3). Direct healthcare costs (drug costs and costs derived from complications), together with clinical benefits, were discounted at 3% annually according to recommendations for the Spanish healthcare setting.13 Costs derived from complications and those related to screening programs were collected from published sources,14 taking the 2007 figures, and increasing the figures from previous years when needed using the consumer price indices published by the Spanish National Statistics Institute (http://www.ine.es/en/welcome_en.htm). A time horizon of 35 years was established for the base case of analysis in order to take into account the main long-term complications, associated costs, and the impact on life-years gained and quality of life.
Drug and complication-derived costs in euros (€) for 2007.
| Interventions and treatments | Annual costs (€) | Reference |
| Statins | 369 | 14 |
| Aspirin | 22 | 14 |
| ACEIs | 114 | 14 |
| Screening for nephropathy | 11 | 14 |
| Vision screening | 63 | 14 |
| Monthly cost of screening program for diabetic foot | 11 | 14 |
| Monthly cost of treatment of unusual ulcers | 240 | 14 |
| Myocardial infarction, year of occurrence | 19,893 | 14 |
| Myocardial infarction, each subsequent year | 801 | 14 |
| Angina, year of occurrence | 2278 | 14 |
| Angina, each subsequent year | 2278 | 14 |
| Congestive heart failure, year of occurrence | 5127 | 14 |
| Congestive heart failure, each subsequent year | 5127 | 14 |
| Stroke, year of occurrence | 3303 | 14 |
| Stroke, each subsequent year | 4786 | 14 |
| Stroke, death within 30 days | 3303 | 14 |
| Peripheral vascular disease, year of occurrence of the event | 2072 | 14 |
| Peripheral vascular disease, each subsequent year | 0 | Assumption |
| Hemodialysis, first and subsequent years | 32,232 | 14 |
| Peritoneal dialysis, first and subsequent years | 33,752 | 14 |
| Kidney transplant, year performed | 29,277 | 14 |
| Kidney transplant, each subsequent year | 8603 | 14 |
| Laser treatment for retinal photocoagulation | 182 | 14 |
| Cataract, year of surgery | 1074 | 14 |
| Annual cost after cataract surgery | 944 | 14 |
| Blindness | 0 | Assumption |
| Neuropathy, year of occurrence | 2612 | 14 |
| Neuropathy, each subsequent year | 0 | Assumption |
| Amputation, year of surgery | 5392 | 14 |
| Amputation, prosthesis | 2559 | 14 |
| Treatment for gangrene | 5600 | 14 |
| Treatment of infected ulcers | 2063 | 14 |
| Treatment of non-infected ulcers | 1179 | 14 |
ACEIs: angiotensin-converting enzyme inhibitors.
Costs of medication were taken from the database of the Spanish General Council of Pharmaceutical Associations.15 Exenatide cost was based on its retail price, which was consistently applied to all the years of the simulation (1.625,32€/year), assuming a constant dose of 10μg twice daily. Patients given IG were assumed to receive 25IU/day in the first year of treatment and 40IU/day in subsequent years (according to the different recommendations16), which resulted in annual costs of 468.60 and 749.47€, respectively (based on the retail price of IG). Based on clinical practice, annual costs of test strips for blood glucose monitoring were also included for both treatments. Use of 24.16 and 38.48 test strips/month was assumed for exenatide and IG, respectively, with a cost of 0.78€ per strip. Frequency of use of test strips was taken from a physician survey conducted in the United Kingdom.17
Health state utilitiesHealth state utilities applied in the model were obtained, whenever possible, from the United Kingdom Prospective Diabetes Study (UKPDS)18 to reflect preferences of T2DM patients. When deemed necessary, such data were complemented with information from other published sources.19,20
In an attempt to explain the changes seen in BMI and reports of nausea in the clinical trial, utilities were applied as described in the cost-effectiveness analysis of exenatide performed by Ray et al.8
Scatter plots and willingness to payPharmacoeconomic analysis was performed using a simulated cohort of 1000 patients in which the mean and standard deviation of costs, life-years gained (LYGs), and quality-adjusted life years (QALYs) gained were calculated. Average outcomes of the 1000 simulations included in the base case of analysis were used to generate scatter plots by which differences seen in clinical outcomes and associated costs between exenatide and its comparator were compared. Such scatter plots were used to generate acceptability curves, calculating the proportion of points below a number of willingness-to-pay thresholds.
Sensitivity analysisUnivariate sensitivity analyses were performed to identify the main analysis variables and to investigate the impact of uncertainty upon key parameters and assumptions. In order to assess the degree of uncertainty in the base cases of analysis in relation to the population cohort and treatment efficacy, the baseline characteristics of patients and the effect of treatments were assessed based on the mean and standard deviations calculated from the clinical trial data.
In the base case of analysis, it was assumed that mean HbA1c values of simulated patients with both treatments followed the same long-term trend as seen in the UKPDS21 study one year after application of the effects of each intervention. In two different sensitivity analyses it was assumed that the gradual increase in HbA1c levels in the exenatide group did not occur until the second or third year of simulation (an assumption supported by data from open-label clinical trials at 2 and 3 years7,22).
The time horizon of the simulation was reduced to 5 and 10 years.
The discount rate for clinical outcomes and costs was changed from 0% to 6% annually.
In the base case of analysis, a simulation based on the average change in HbA1c levels seen in both treatment groups of the clinical trial was performed. In four separate sensitivity analyses, the effects derived from interventions were established at:
- –
The upper limit of the 95% confidence interval for exenatide.
- –
The lower limit of the 95% confidence interval for exenatide.
- –
The upper limit of the 95% confidence interval for IG.
- –
The lower limit of the 95% confidence interval for IG.
A sensitivity analysis was performed including no cost associated to use of blood glucose monitoring test strips by patients.
Sensitivity analyses were done modifying the base case assumption relating to the change in utility applied for body weight and nausea. The following analyses were performed:
- –
Excluding utilities for weight change and nausea.
- –
Including utilities for weight change equivalent to the values recorded in the CODE-2 study and assuming that no episode of nausea would occur.
As regards to costs associated to IG included in the one-way sensitivity analysis, it was assumed that patients would receive 40IU of insulin daily throughout their lives.
A subgroup from the population of the Heine et al. clinical trial 5 with a BMI >30kg/m2 was included in the base case of analysis. In another sensitivity analysis, the mean values of patient characteristics and efficacy of treatments of both groups were used to calculate the long-term results. No change was made in assumptions relating to costs.
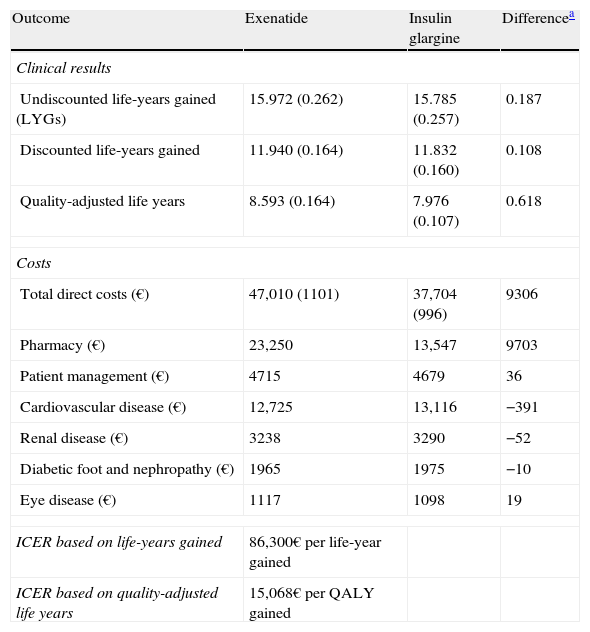
ResultsFor exenatide-treated patients, an increase in LYGs and QALYs as compared to IG was predicted (Table 4). Mean increases in LYGs and QALYs during the life of exenatide-treated patients were 0.11 and 0.62 years, respectively, as compared to IG.
Summary of the outcomes of the exenatide versus insulin glargine base case.
| Outcome | Exenatide | Insulin glargine | Differencea |
| Clinical results | |||
| Undiscounted life-years gained (LYGs) | 15.972 (0.262) | 15.785 (0.257) | 0.187 |
| Discounted life-years gained | 11.940 (0.164) | 11.832 (0.160) | 0.108 |
| Quality-adjusted life years | 8.593 (0.164) | 7.976 (0.107) | 0.618 |
| Costs | |||
| Total direct costs (€) | 47,010 (1101) | 37,704 (996) | 9306 |
| Pharmacy (€) | 23,250 | 13,547 | 9703 |
| Patient management (€) | 4715 | 4679 | 36 |
| Cardiovascular disease (€) | 12,725 | 13,116 | −391 |
| Renal disease (€) | 3238 | 3290 | −52 |
| Diabetic foot and nephropathy (€) | 1965 | 1975 | −10 |
| Eye disease (€) | 1117 | 1098 | 19 |
| ICER based on life-years gained | 86,300€ per life-year gained | ||
| ICER based on quality-adjusted life years | 15,068€ per QALY gained | ||
LYG: life-year gained; QALY: quality-adjusted life year; ICER: incremental cost-effectiveness ratio.
A lower cumulative incidence of all cardiovascular complications was seen with exenatide as compared to IG, and although the projections in the model relating to most other complications followed a similar trend, the cumulative incidence of proliferative retinopathy, severe vision loss, cataract, nephropathy-related death, recurrence of diabetic foot ulcers, and a first amputation was higher for exenatide. In terms of relative incidence, a delay in time to occurrence of all complications was predicted for patients treated with exenatide as compared to IG. Mean total costs per patient were 47,010€ (exenatide) and 37,704€ (IG), with a difference of 9306€ (Table 4). When distribution of these costs was assessed, the main reason for such difference between the treatments was shown to be the increased drug costs associated to exenatide (23,250 versus 13,547€, a difference of 9703€).
Interpretation of the results of the base case of analysis as an incremental cost-effectiveness ratio (ICER) showed that, when exenatide and IG were compared, ICER was 86,300€ per life year gained and 15,068€/QALY gained. To visually depict the findings of this analysis, a scatter plot of incremental cost-effectiveness was generated. In representation of incremental costs and effectiveness during the patient lifetime, all points were located in the right upper quadrant of the cost-effectiveness plane, suggesting a greater effectiveness, associated to an increase in costs (Fig. 1). The same data were used to generate an acceptability curve, determining the proportion of points in the scatter plot below the line representing the range of willingness-to-pay values (Fig. 2). When cost-effectiveness ratio was analyzed in terms of QALYs, estimating a willingness-to-pay threshold of 30,000€/QALY,23 there was a 98.6% chance that exenatide was considered cost-effective as compared to IG.


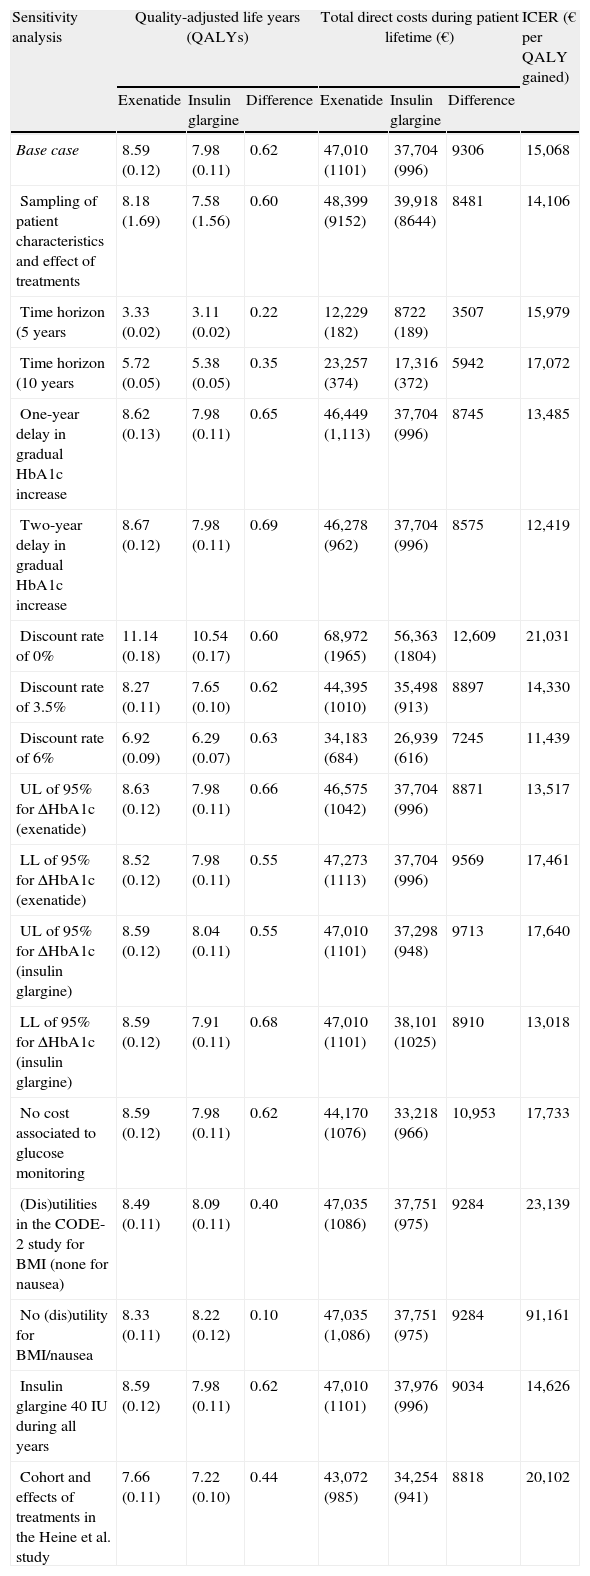
The various sensitivity analyses performed in this study showed results to be more sensitive to changes in utility values applied to change in body weight and incidence of nausea, and also to the consideration of results without applying the discount rate (Table 5). Modification of the different assumptions relating to change in time horizon, effects of interventions upon HbA1c concentration, daily dose of IG, inclusion of costs associated to blood glucose monitoring by patients, and consideration of the effects of treatment in all patients from the Heine et al. study5 had little effect upon relative results, with a change seen in ICER from 11,439€ to 20,102/QALY gained with exenatide as compared to IG. Similarly, in a probabilistic sensitivity analysis done to assess uncertainty in the model parameters, uncertainty was associated to an ICER of 14,106/QALY gained for exenatide as compared to IG.
Summary of the results of the sensitivity analysis of exenatide versus insulin glargine.
| Sensitivity analysis | Quality-adjusted life years (QALYs) | Total direct costs during patient lifetime (€) | ICER (€ per QALY gained) | ||||
| Exenatide | Insulin glargine | Difference | Exenatide | Insulin glargine | Difference | ||
| Base case | 8.59 (0.12) | 7.98 (0.11) | 0.62 | 47,010 (1101) | 37,704 (996) | 9306 | 15,068 |
| Sampling of patient characteristics and effect of treatments | 8.18 (1.69) | 7.58 (1.56) | 0.60 | 48,399 (9152) | 39,918 (8644) | 8481 | 14,106 |
| Time horizon (5 years | 3.33 (0.02) | 3.11 (0.02) | 0.22 | 12,229 (182) | 8722 (189) | 3507 | 15,979 |
| Time horizon (10 years | 5.72 (0.05) | 5.38 (0.05) | 0.35 | 23,257 (374) | 17,316 (372) | 5942 | 17,072 |
| One-year delay in gradual HbA1c increase | 8.62 (0.13) | 7.98 (0.11) | 0.65 | 46,449 (1,113) | 37,704 (996) | 8745 | 13,485 |
| Two-year delay in gradual HbA1c increase | 8.67 (0.12) | 7.98 (0.11) | 0.69 | 46,278 (962) | 37,704 (996) | 8575 | 12,419 |
| Discount rate of 0% | 11.14 (0.18) | 10.54 (0.17) | 0.60 | 68,972 (1965) | 56,363 (1804) | 12,609 | 21,031 |
| Discount rate of 3.5% | 8.27 (0.11) | 7.65 (0.10) | 0.62 | 44,395 (1010) | 35,498 (913) | 8897 | 14,330 |
| Discount rate of 6% | 6.92 (0.09) | 6.29 (0.07) | 0.63 | 34,183 (684) | 26,939 (616) | 7245 | 11,439 |
| UL of 95% for ΔHbA1c (exenatide) | 8.63 (0.12) | 7.98 (0.11) | 0.66 | 46,575 (1042) | 37,704 (996) | 8871 | 13,517 |
| LL of 95% for ΔHbA1c (exenatide) | 8.52 (0.12) | 7.98 (0.11) | 0.55 | 47,273 (1113) | 37,704 (996) | 9569 | 17,461 |
| UL of 95% for ΔHbA1c (insulin glargine) | 8.59 (0.12) | 8.04 (0.11) | 0.55 | 47,010 (1101) | 37,298 (948) | 9713 | 17,640 |
| LL of 95% for ΔHbA1c (insulin glargine) | 8.59 (0.12) | 7.91 (0.11) | 0.68 | 47,010 (1101) | 38,101 (1025) | 8910 | 13,018 |
| No cost associated to glucose monitoring | 8.59 (0.12) | 7.98 (0.11) | 0.62 | 44,170 (1076) | 33,218 (966) | 10,953 | 17,733 |
| (Dis)utilities in the CODE-2 study for BMI (none for nausea) | 8.49 (0.11) | 8.09 (0.11) | 0.40 | 47,035 (1086) | 37,751 (975) | 9284 | 23,139 |
| No (dis)utility for BMI/nausea | 8.33 (0.11) | 8.22 (0.12) | 0.10 | 47,035 (1,086) | 37,751 (975) | 9284 | 91,161 |
| Insulin glargine 40IU during all years | 8.59 (0.12) | 7.98 (0.11) | 0.62 | 47,010 (1101) | 37,976 (996) | 9034 | 14,626 |
| Cohort and effects of treatments in the Heine et al. study | 7.66 (0.11) | 7.22 (0.10) | 0.44 | 43,072 (985) | 34,254 (941) | 8818 | 20,102 |
Mean values and standard deviation (in brackets) are shown.
QALYs: quality-adjusted life year; CODE-2: Costs of Type 2 Diabetes in Europe; HbA1c: glycosylated hemoglobin; BMI: body mass index; LL: lower limit of the 95% confidence interval; UL: upper limit of the 95% confidence interval; ICER: incremental cost-effectiveness ratio.
However, the most significant change in ICER was seen when costs and simulates clinical outcomes were expressed as undiscounted values. In this case, a small difference was seen as compared to the base case in terms of the incremental QALY (0.60 versus 0.62, respectively), although mean incremental costs during the patient lifetime were higher when a discount rate (12,609€) was not applied as compared to the base case (9306€). This results in an ICER of 21,031/QALY gained for exenatide as compared to IG. When the set of utility values used for the base case of analysis (taken from Matza et al.24 and the CODE-2 study) were only replaced by the values from the CODE-2 study (in relation to weight change only, assuming that no episode of nausea occurred), a reduction in QALYs was seen, resulting in an ICER of 23,139€/QALY gained for exenatide as compared to IG. When all utilities applied to the weight change and nausea were removed from the analysis, the ICER for exenatide was 91,161 €/QALY gained as compared to IG.
DiscussionResults of this analysis show that, as compared to IG, exenatide is associated to increases in costs, QALYs, and LYGs in patients with obesity and T2DM who do not achieve an adequate control with oral antidiabetics. A comparison of chronic treatment with exenatide versus IG in the Spanish healthcare setting shows that treatment with exenatide would involve an incremental cost-effectiveness of 15,068€/QALY and 86,300€/LYG.
Sensitivity analysis showed the study to be robust, and that conclusions (particularly in terms of QALY and lifetime costs of the patient) were mostly unaffected by changes in most parameters. The projected results were more sensitive to changes made in the discount rate and utility values applied to change in body weight and occurrence of nausea. In the specific case of potential body weight changes or occurrence of nausea, while it is evident from the CODE-2 and Matza et al.24 studies that significant implications exist in relation to changes experienced in weight, the sensitivity analysis was evaluated in a very conservative scenario where no utility value related to quality of life was applied to weight change or nausea. In such scenario, exenatide continued to be associated to an improvement in QALYs, with an ICER of 91,161€/QALY gained as compared to IG. The weight loss seen during exenatide treatment in clinical trials is a key factor in terms of the potential impact on clinical variables at study end and quality of life estimates. While the base case of this analysis only assessed the results in the subgroup of obese patients from a larger clinical study, a sensitivity analysis including data from the whole population provided similar final results (Table 5). Although exenatide was associated to improved results (LYGs and QALYs), there was a greater incidence of diabetes-related complications with this drug as compared to IG. In some cases, such as deaths of a renal origin, this represents an example of the survival paradox. That is, since simulated included in the group treated with exenatide have a greater increase in LYGs than those in the IG group, they also have a greater risk of experiencing adverse events.
In simulations corresponding to the IG group, patients were assumed to receive 25IU/day of insulin during the first year and 40IU/day during the rest of the year, an assumption that was reflected in the corresponding costs. These estimates may be considered conservative, as the mean insulin dose per patient at the end of the study was 28.9IU. In order to assess uncertainty in this regard, a sensitivity analysis was performed using a mean dose of 40IU for both the first and subsequent years. This resulted in an increase in total costs during the patient lifetime of 272€ (IG), and in a final ICER of 14,626€/QALY gained for exenatide as compared to IG. Although no simulations were made with higher insulin doses, a patient cohort with a mean BMI of 34.30kg/m2 before treatment could possibly have a higher insulin demand than considered in this analysis.
Findings made in this study are consistent with other pharmacoeconomic evaluations which have compared exenatide and IG in different healthcare settings (United Kingdom, Germany, and Switzerland).8–10 While the abovementioned studies did not establish any restrictions for the subpopulation of patients with obesity and T2DM to be enrolled, their results were similar to those obtained in our study (with ICERs in the scenario considered in the base case of 22.420£, 13.746€, and 19.450 Swiss francs, respectively, per QALY gained with exenatide treatment as compared to IG). An analysis performed in the US healthcare setting in which treatment with exenatide was compared to no treatment reported an ICER of 36,133$/QALY gained.25 However, different results were found in the economic evaluation performed by Woehl et al. (2008), with IG being the dominant option in all cases.26 The differences seen in the Woehl et al. study were mainly due to use of different models for predicting long-term costs and effectiveness associated to exenatide, as compared to IG, in T2DM patients. Although the results of the randomized clinical trial comparing exenatide to IG showed statistically significant differences between the treatment groups in the change seen in body weight, as well as no difference in the rate of severe hypoglycemic episodes, Woehl did not apply any incremental utility for the weight loss associated to exenatide. He also estimated that exenatide treatment would be associated to a higher number of severe hypoglycemic episodes as compared to IG. These different approaches taken by Woehl led him to predict that treatment with exenatide would result in a lower number of QALYs than expected, and to a higher number of QALYs for IG.
The study has a number of limitations. The results reported here were obtained from a modelization study, and are therefore subject to the limitations inherent to such studies. In particular, short-term results were extrapolated to estimate clinical data and long-term costs. In addition, potential changes in treatment schemes that may occur during the time horizon of modelization were not considered. An additional limitation is use of an approximation model in a therapeutic area where unexpected results are found even in clinical trials such as the Measures to control cardiovascular risk in diabetes trial. Here, assessment of glycemic control was terminated early due to unexpected results.27 This emphasizes the need for long-term studies and confirms that models are subject to limitations.
The weight loss associated to exenatide treatment, confirmed in different clinical trials, is a key attribute of this drug because of its potential impact on clinical endpoints and quality of life estimates. This is particularly relevant in the Spanish healthcare setting, in which, according to the most recent data, the prevalence of obesity reported by patients (which may possibly lead to underreporting) increased in the 1993–2003 period from 20% to 29.8%.28 These data agree with other reported estimates in the Spanish healthcare setting29,30 and represent a usual global observation.
To sum up, when costs of drugs and potential complications are taken into account, exenatide is considered as an efficient option based on a willingness-to-pay threshold of 30,000€/QALY gained.
FundingEli Lilly Spain funded the whole study.
Conflicts of interestGordon Goodall and Jayne Smith-Palmer are employees of IMS Health, and received the corresponding consultant honoraria from Eli Lilly and Company. María Costi, Louise Timlin, Jesús Reviriego, José Sacristán, and Tatiana Dilla are employees of Eli Lilly and Company.
Please cite this article as: Goodall G, et al. Coste-efectividad de exenatida en comparación con insulina glargina en pacientes con obesidad y diabetes mellitus tipo 2 en España. Endocrinol Nutr. 2011; 58:331–40.
