


To assess the clinical features, length of stay, incidence rate, mortality, and hospital admissions of patients with episodes of diabetic ketoacidosis (DKA).
PatientsIt was conducted retrospective, cross-sectional study of 164 consecutive admissions of adult patients (2008–August 2012), with type 1 or type 2 diabetes already known or new onset.
ResultsMortality rate was 1.2%. The DKA episodes were mild (18.9%), moderate (31.7%), or severe (49.4%). The cumulative incidence was 2.66 cases/1000 patients with diabetes (DM) in 4.5 years. The most common causes triggering DKA were infection (33.2%) and dietary transgression and/or insulin dose omission (30.7%). A total of 12.8% of patients had new onset DM, 56.7% type 1, and 26.8% type 2 DM. Patients with type 2 DM were older and had at admission higher creatinine, BUN, osmolality, sodium, and anion gap levels. Patients with new-onset of DM had higher levels of glucose and sodium, but lower potassium levels. No differences were found in pH or bicarbonate. Admission to the intensive care unit (ICU) was required in >50% of cases (p<0.001), and 86.6% of patients were finally admitted to a medical ward (p=0.005). The length of stay at the ICU (p<0.001) and hospital (p=0.013) was significantly different depending on DKA severity.
ConclusionsMost DKA episodes require hospital admission, but mortality is <2%, and length of stay at the ER and medical ward depends on type of DM and initial severity of the episode.
Se investigaron las características clínicas, la duración, la tasa de incidencia, la mortalidad y los ingresos de episodios de cetoacidosis diabética (CAD).
PacientesSe realizó un estudio retrospectivo, transversal, con 164 admisiones consecutivas de adultos (2008–agosto 2012), con diabetes (DM) tipo 1 y 2 ya conocida o debut diabético.
ResultadosLa tasa de mortalidad fue del 1,2%. Los episodios de CAD fueron leves (18,9%), moderados (31,7%) y graves (49,4%). La incidencia acumulada fue de 2,66 casos/1.000 pacientes con DM en 4,5 años. Las causas desencadenantes más frecuentes fueron las infecciones (33,2%) y la transgresión dietética y/u omisión de la dosis de insulina (30,7%). El 12,8% tuvieron un debut diabético, 56,7% eran DM tipo 1 y el 26,8% tipo 2. Los casos con DM tipo 2 tenían mayor edad y presentaban al ingreso mayores niveles de creatinina, BUN, osmolaridad, sodio y anion GAP. El debut diabético presentaba niveles más elevados de glucosa y sodio, pero valores más bajos de potasio. No se encontró ninguna diferencia en el pH o bicarbonato. La admisión en la unidad de cuidados intensivos (UCI) se requirió en más del 50% de los casos (p<0,001) y un 86,6% fue finalmente ingresado en una planta de hospitalización médica (p=0,005). La duración de las estancias en la UCI (p<0,001) y en el hospital (p=0,013) fueron significativamente diferentes según la gravedad de la CAD.
ConclusionesLa mayoría de las crisis de CAD requieren de ingreso, pero la mortalidad es inferior al 2%, variando la duración de la estancia en urgencias y hospitalización dependiendo del tipo de DM y la gravedad inicial del episodio.
The prevalence of diabetes mellitus (DM) is having a dramatic rise in the last decades. Wild et al.1 estimated that in developed countries would be a 54% increase of this disease by 2030 (9% of the total population), becoming this increasing even higher (up to 80%) in those older than 65 years old.
Although there are well-defined criteria for both diabetic ketoacidosis (DKA) and hyperglycaemic hyperosmolar state (HHS), it could also be found hyperglycaemic states with mixed features, depending on each given case and the underlying cause of decompensation.2 The mortality of DKA and HHS ranges from less than 5 to 11%, respectively.2,3 Moreover, patients with type 2 DM could also have DKA crises under certain acute stress catabolic circumstances such trauma, surgery or infection.4–6
Some authors7 have previously reported data on our community about patients admitted to the emergency department (ED) of a tertiary teaching hospital. They reported an incidence of 8.09 episodes of DKA in 105 inhabitants and a mortality rate of 6.52%. More recently other authors have also notified a lower DKA mortality rate at 28 days, ranging between 3.4%8 and 2.65%.9 Perhaps, these percentages might be more similar to what could be a priori expected in current day-by-day clinical practice. However, most available data on this issue came from cited manuscripts prior to 1985.2,3 Therefore, there are not recent studies that show the real impact of improvements in the therapy on mortality in adults with DKA.
The principal objective of the current study is to know the mortality rate of DKA in the ED and after any hospital admission in a university tertiary hospital. In addition, we also aim to obtain the cumulative incidence (cI) of DKA in our health's community scope, the length of stay in ED, which category of DKA is more associated with admission in the intensive care station (ICS) or general medical ward and length of stay in these hospital sections, and, finally, if there are any differences between DKA episodes in patients with type 2 and type 1 DM.
Patients and methodsWe designed a retrospective, single-center and cross-sectional study of consecutive admissions of patients in the ED of the University Hospital Ramon y Cajal. The recent study Dia@bet.es10 estimated, in turn, a DM prevalence in Spain of 13.8% per 100 inhabitants over 18 years old. So, in our area, the target population was approximately 61,698 people (according to data of health area in 2011). According to previous articles of similar scope,4,6 the incidence of DKA ranges from 4.6 to 8 episodes per 1000 patients with diabetes. The calculation of the sample size was carried out to achieve a 3% of precision in estimating a proportion using a bilateral, normal and asymptotic confidence interval (95%), and assuming that the ratio of DKA cases is 4% per 1000 patients with diabetes. These calculations result in 164 experimental cases to get a power of 0.8.
Then, we reviewed the electronic medical records of the emergency and endocrinology departments of the center between January 2008 and August 2012. We recorded symptoms at admission and their correlation with clinical judgments issued. To be included in the study, patients had to be older than 18 years old and meet the DKA criteria proposed by the American Diabetes Association (ADA) guidelines of 2009.3 The exclusion criteria were age under 18, voluntary discharge, simple hyperglycaemia, non-ketonic crises, HHS (except when DKA criteria were met and the plasma osmolality was >295mmol/kg) and all those acidosis states that could be justified by any other aetiology. All included patients were treated according to current medical societies guidelines. The local ethics committee approved the study protocol.
The laboratory variables included in the study were as follows (SI units): plasma glucose, serum creatinine, urea nitrogen, sodium (Na+) both total and corrected (according to the following approximation: if plasma glucose was between 5.55 and 22.2mmol/l, then it is was applied a correction ratio of 1mmol/l of Na+ per every 2.33mmol/l of glucose increase; but if the plasma glucose was over 22.2mmol/l, then the applied correction ratio was 1mmol/l of Na+ per every 1.38mmol/l of glucose increase),11 potassium (K+), effective (calculated) serum osmolality (mmol/kg), serum calcium (Ca2), total proteins, anion GAP, ketonemia (according to the nitroprusside method reaction), ketonuria (measured in a single urine sample), blood pH (arterial, venous, automatized),12 serum bicarbonate (HCO3−), pCO2, HbA1c (at admission or previous six months value). Other biochemical and haematological parameters related to hepatic function and vital signs (body temperature (°C), oxygen saturation on room air (pulse oximetry, % O2), cardiac (beats per minute) and respiratory (breaths per minute) frequencies and blood pressure) were also collected (supplementary material). The registered clinical data were gender, reason or symptom for medical consultation, type and dose of used insulin (total IU per day), patient's age at time of their care, age of diagnosis of DM, type of DM (diabetes onset, type 1 or 2, or other), years of DM evolution, level of consciousness (alert, somnolence, stupor and coma), if the hospital income was required, the length of stay (in days) in medical wards and/or intensive care station (ICS), length of stay in ED (in hours), the aetiology of the DKA crises and the degree of severity, and, finally, the number of deaths per episode. It was also analyzed readmission rate at 28 days in the same center (defined as further emergency consultation and/or rehospitalization conditioned by any metabolic abnormalities linked to DM) and mortality at 90 days. The severity of DKA was defined according to ADA recommendations as mild (plasma glucose>13.87mmol/l, pH 7.25–7.3, HCO3− 15–18mmol/l, anion GAP>10mmol/l and alert), moderate (plasma glucose>13.87mmol/l, pH 7.00–7.24, HCO3− 10–15mmol/l, anion GAP>12mmol/l and alert or sleepy) and severe (plasma glucose >13.87mmol/l, pH <7, HCO3−<10mmol/l, anion GAP>12mmol/l and stupor or coma). When there were mixed features between each category (two or more), it was chosen the more severe category to classify the given episode.
Statistical analysisWe estimated the frequency of qualitative and normally distributed quantitative variables and their means (and its standard deviation, SD) or median (interquartile range (IQR) or Ip25–75), if no such condition were found. The normal distribution of variables was checked by the Kolgomorov–Smirnov test. The possible association between the type of DKA and ICS or general medical room admission was accomplished by Pearson's chi-square test (χ2), or exact Fisher's test when appropriated. The association of the types of DKA and the total length of stay, days at ICS and hours in the ED was done using the non-parametric Kruskal–Wallis (for all three groups) and the Mann–Whitney U tests for each combination of two. To investigate the differences between type 1 and 2 DM, we used a two-sided Student's test for independent samples or Mann–Whitney U test, when the given variables had got a non-normal distribution.
It was established a statistical significance of p value <0.05 (bilateral) for all analysis. All data were analyzed with the statistical program Statistical Package for Social Science (SPSS) (Chi, IL, USA) version 18.0. The sample size for a proportion was estimated using the program Ene, version 2.0.
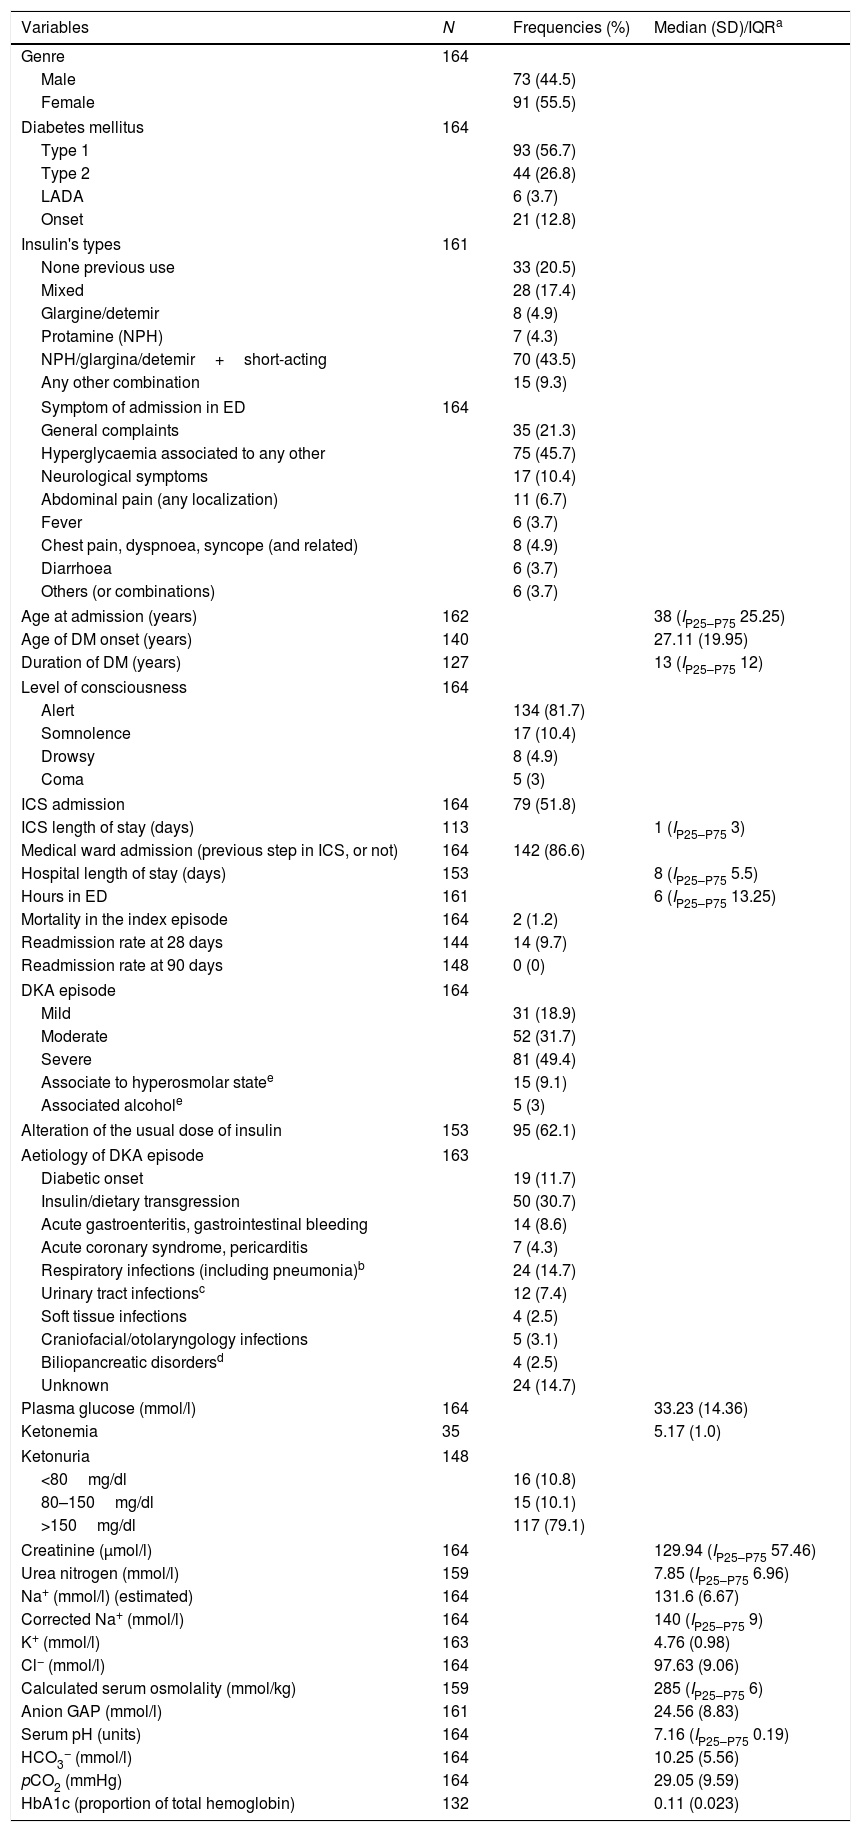
ResultsIt was achieved the predetermined power for the study after analyzing 195 cases (164 met the inclusion criteria). The median age at the first ED admission was 38 years (IP25–P75 25.25), with a female:male ratio of 1.25. The median years of DM evolution was 13 (IP25–P75 12), with an average age at DM diagnosis of 27.11 years (SD 19.95). The mortality rate achieved was 1.2% (n=2, one case died due to acute coronary syndrome and another of bronchoaspirative pneumonia and low level of consciousness; in both cases was detected severe DKA. One of them was a diabetes onset and the other patient had known type 2 DM). The readmission rate at 28 days reached 9.7% (without any deaths). Up to 20.5% of the patients had not used insulin at any time prior to admission (of them, 27.9% had type 2 DM). Among those patients who just were under insulin regimens, the basal-bolus schema was the most frequently used (43.5%). Of the total analyzed patients, 56.7% had type 1 DM and 26.8% had type 2 DM. The DKA episode supposed diabetes onset in 12.8% cases. The main laboratory values are summarized in Table 1.
Main clinical variables analyzed among patients with diabetic ketoacidosis.
| Variables | N | Frequencies (%) | Median (SD)/IQRa |
|---|---|---|---|
| Genre | 164 | ||
| Male | 73 (44.5) | ||
| Female | 91 (55.5) | ||
| Diabetes mellitus | 164 | ||
| Type 1 | 93 (56.7) | ||
| Type 2 | 44 (26.8) | ||
| LADA | 6 (3.7) | ||
| Onset | 21 (12.8) | ||
| Insulin's types | 161 | ||
| None previous use | 33 (20.5) | ||
| Mixed | 28 (17.4) | ||
| Glargine/detemir | 8 (4.9) | ||
| Protamine (NPH) | 7 (4.3) | ||
| NPH/glargina/detemir+short-acting | 70 (43.5) | ||
| Any other combination | 15 (9.3) | ||
| Symptom of admission in ED | 164 | ||
| General complaints | 35 (21.3) | ||
| Hyperglycaemia associated to any other | 75 (45.7) | ||
| Neurological symptoms | 17 (10.4) | ||
| Abdominal pain (any localization) | 11 (6.7) | ||
| Fever | 6 (3.7) | ||
| Chest pain, dyspnoea, syncope (and related) | 8 (4.9) | ||
| Diarrhoea | 6 (3.7) | ||
| Others (or combinations) | 6 (3.7) | ||
| Age at admission (years) | 162 | 38 (IP25–P75 25.25) | |
| Age of DM onset (years) | 140 | 27.11 (19.95) | |
| Duration of DM (years) | 127 | 13 (IP25–P75 12) | |
| Level of consciousness | 164 | ||
| Alert | 134 (81.7) | ||
| Somnolence | 17 (10.4) | ||
| Drowsy | 8 (4.9) | ||
| Coma | 5 (3) | ||
| ICS admission | 164 | 79 (51.8) | |
| ICS length of stay (days) | 113 | 1 (IP25–P75 3) | |
| Medical ward admission (previous step in ICS, or not) | 164 | 142 (86.6) | |
| Hospital length of stay (days) | 153 | 8 (IP25–P75 5.5) | |
| Hours in ED | 161 | 6 (IP25–P75 13.25) | |
| Mortality in the index episode | 164 | 2 (1.2) | |
| Readmission rate at 28 days | 144 | 14 (9.7) | |
| Readmission rate at 90 days | 148 | 0 (0) | |
| DKA episode | 164 | ||
| Mild | 31 (18.9) | ||
| Moderate | 52 (31.7) | ||
| Severe | 81 (49.4) | ||
| Associate to hyperosmolar statee | 15 (9.1) | ||
| Associated alcohole | 5 (3) | ||
| Alteration of the usual dose of insulin | 153 | 95 (62.1) | |
| Aetiology of DKA episode | 163 | ||
| Diabetic onset | 19 (11.7) | ||
| Insulin/dietary transgression | 50 (30.7) | ||
| Acute gastroenteritis, gastrointestinal bleeding | 14 (8.6) | ||
| Acute coronary syndrome, pericarditis | 7 (4.3) | ||
| Respiratory infections (including pneumonia)b | 24 (14.7) | ||
| Urinary tract infectionsc | 12 (7.4) | ||
| Soft tissue infections | 4 (2.5) | ||
| Craniofacial/otolaryngology infections | 5 (3.1) | ||
| Biliopancreatic disordersd | 4 (2.5) | ||
| Unknown | 24 (14.7) | ||
| Plasma glucose (mmol/l) | 164 | 33.23 (14.36) | |
| Ketonemia | 35 | 5.17 (1.0) | |
| Ketonuria | 148 | ||
| <80mg/dl | 16 (10.8) | ||
| 80–150mg/dl | 15 (10.1) | ||
| >150mg/dl | 117 (79.1) | ||
| Creatinine (μmol/l) | 164 | 129.94 (IP25–P75 57.46) | |
| Urea nitrogen (mmol/l) | 159 | 7.85 (IP25–P75 6.96) | |
| Na+ (mmol/l) (estimated) | 164 | 131.6 (6.67) | |
| Corrected Na+ (mmol/l) | 164 | 140 (IP25–P75 9) | |
| K+ (mmol/l) | 163 | 4.76 (0.98) | |
| Cl− (mmol/l) | 164 | 97.63 (9.06) | |
| Calculated serum osmolality (mmol/kg) | 159 | 285 (IP25–P75 6) | |
| Anion GAP (mmol/l) | 161 | 24.56 (8.83) | |
| Serum pH (units) | 164 | 7.16 (IP25–P75 0.19) | |
| HCO3− (mmol/l) | 164 | 10.25 (5.56) | |
| pCO2 (mmHg) | 164 | 29.05 (9.59) | |
| HbA1c (proportion of total hemoglobin) | 132 | 0.11 (0.023) | |
Variables with normal distribution according to the Kolgomorov–Smirnov test are noted with average and standard deviation (SD). If data have not got normal distribution, then it is annotated as median and interquartile p25–p75 (Ip25–p75, or interquartile range, IQR).
The cI of DKA in our population was 2.66 cases per 1000 diabetics in 4 years (that is, approximately 0.59 cases per 1000 diabetics per year). The DKA episodes were mild in 18.9%, moderate in 31.7% and severe in 49.4% of admissions. The most frequent causes (globally considered) of DKA were infections (33.2%) and dietary transgression and/or insulin dose omission (30.7%). Moreover, in 92 cases was detected a modification in daily dose of insulin, prior to admission, with or without direct bearing to the cause of DKA.
The median length of stay of patients admitted in the ED was 6h (IP25–P75 13.25). Over half of the patients (51.8%, n=79) were firstly admitted in the ICS. There, the median length of stay was 1 day (IP25–P75 3). The 86.6% of the cases were admitted to the medical general ward – with or without prior step in ICS – and mostly in the endocrinology department (data not shown), with a median duration of the staying of 8 days (IP25–P75 5.5). The rest of patients were discharged from the ED (13.4%). The length of stay in the ICS (mild 0 (0–3), moderate 0 (1–5), severe 2 (0–8); χ2 29.747; p<0.001) and hospitalization (mild 7 (Ip25–p75 5), moderate 7 (Ip25–p75 3), severe 9.5 (Ip25–p75 6); χ2 8.709, p=0.013) were different among DKA's categories, due to a statistical significance difference between mild or moderate and severe DKA episodes (Suppl. material Table 2). No statistical difference was found between groups of mild and moderate DKA (p=0.31). The length of stay in ED was significantly higher in patients with mild (11 (Ip25–p75 13) or moderate (10 (Ip25–p75 15) DKA than in severe cases (3 (Ip25–p75 7) (p<0.001 and p=0.003, respectively). Finally, it was also found significant differences between the three DKA categories in admission to ICS (mild, 3 (9.7%), moderate 14 (26.9%), severe 62 (76.5%); χ2 53.918, p<0.001) or in medical ward (mild, 22 (71%), moderate 50 (96.2%), severe 70 (86.4%); χ2 10.611, p=0.005).
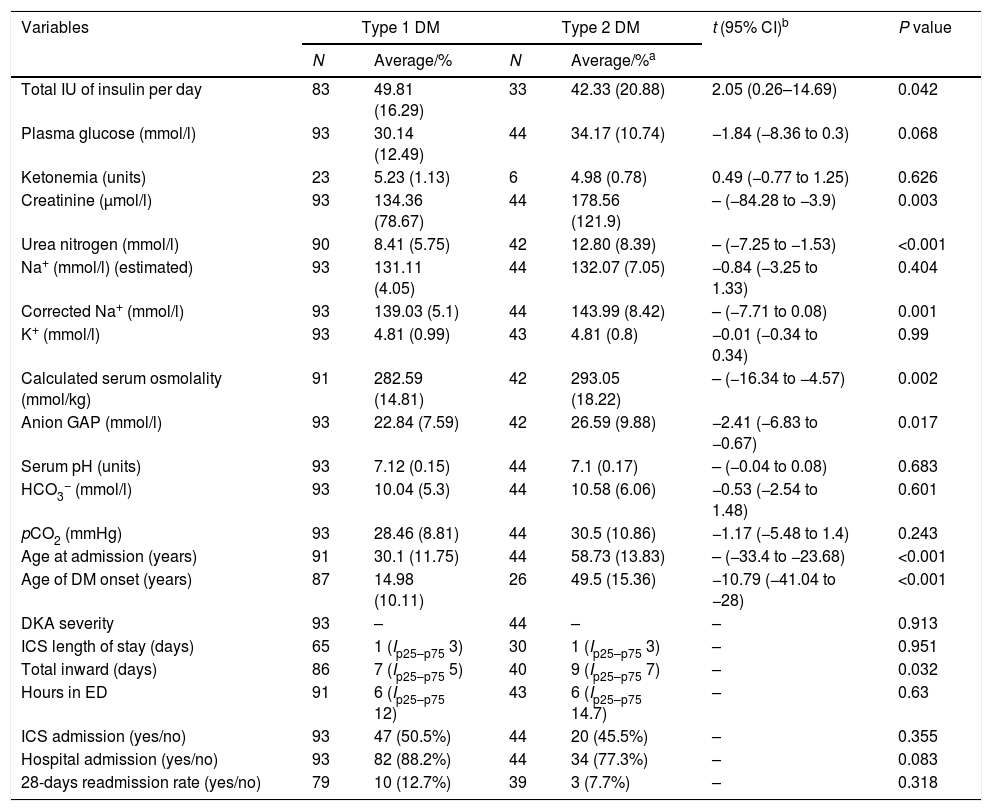
Almost one third of the collected cases had got type 2 DM. The next clinical features distinct them from type 1 DM (Table 2): total insulin dose per day [DM1, 42.33 (20.88) vs. DM2, 49.81 (16.29); t=2.05, 95% CI (0.26–14.69), p=0.042], creatinine [DM1, 134.36 (78.67) vs. DM2, 178.56 (121.9), p=0.003], urea nitrogen [DM1, 8.41 (5.75) vs. DM2, 12.80 (8.39), p<0.001], serum osmolality [DM1, 282.59 (14.81) vs. DM2, 293.05 (18.22), p=0.002], corrected Na+ [DM1, 139.03 (5.1) vs. DM2, 143.99 (8.42), p=0.001], anion GAP [DM1, 22.84 (7.59) vs. DM2, 26.59 (9.88); t=−2.41, 95% CI (−6.83 to −0.67); p=0.017], age at admission [DM1, 30.1 (11.75) vs. DM2, 58.73 (13.83), p<0.001] and age at diagnosis [DM1, 14.98 (10.11) vs. DM2, 49.5 (15.36); t=−10.79 (−41.04 to −28), p<0.001]. It was not found any differences in the plasma glucose levels [DM1, 30.14 (12.49) vs. DM2, 34.17 (10.73); t=−1.84, 95% CI −1.84 (−8.36–0.3), p=0.068], serum pH [DM1, 7.12 (0.15) vs. DM2, 7.1 (0.17), p=0.683], and HCO3− [DM1, 10.04 (5.3) vs. DM2, 10.58 (6.06); t=−0.53, 95% CI (−2.54–1.48), p=0.601]. Moreover, it was also found a longer length of stay in the hospital in the type 2 DM [DM1, 7 (Ip25–p75 5) vs. DM2, 9 (Ip25–p75 7); χ2=4.59, p=0.032]. No statistical differences were detected in the length of stay in ED or ICS.
Main differences between type 1 and type 2 DM in these variables directly related to DKA, length of stay and admission rates in ICS and general medical ward.
| Variables | Type 1 DM | Type 2 DM | t (95% CI)b | P value | ||
|---|---|---|---|---|---|---|
| N | Average/% | N | Average/%a | |||
| Total IU of insulin per day | 83 | 49.81 (16.29) | 33 | 42.33 (20.88) | 2.05 (0.26–14.69) | 0.042 |
| Plasma glucose (mmol/l) | 93 | 30.14 (12.49) | 44 | 34.17 (10.74) | −1.84 (−8.36 to 0.3) | 0.068 |
| Ketonemia (units) | 23 | 5.23 (1.13) | 6 | 4.98 (0.78) | 0.49 (−0.77 to 1.25) | 0.626 |
| Creatinine (μmol/l) | 93 | 134.36 (78.67) | 44 | 178.56 (121.9) | – (−84.28 to −3.9) | 0.003 |
| Urea nitrogen (mmol/l) | 90 | 8.41 (5.75) | 42 | 12.80 (8.39) | – (−7.25 to −1.53) | <0.001 |
| Na+ (mmol/l) (estimated) | 93 | 131.11 (4.05) | 44 | 132.07 (7.05) | −0.84 (−3.25 to 1.33) | 0.404 |
| Corrected Na+ (mmol/l) | 93 | 139.03 (5.1) | 44 | 143.99 (8.42) | – (−7.71 to 0.08) | 0.001 |
| K+ (mmol/l) | 93 | 4.81 (0.99) | 43 | 4.81 (0.8) | −0.01 (−0.34 to 0.34) | 0.99 |
| Calculated serum osmolality (mmol/kg) | 91 | 282.59 (14.81) | 42 | 293.05 (18.22) | – (−16.34 to −4.57) | 0.002 |
| Anion GAP (mmol/l) | 93 | 22.84 (7.59) | 42 | 26.59 (9.88) | −2.41 (−6.83 to −0.67) | 0.017 |
| Serum pH (units) | 93 | 7.12 (0.15) | 44 | 7.1 (0.17) | – (−0.04 to 0.08) | 0.683 |
| HCO3− (mmol/l) | 93 | 10.04 (5.3) | 44 | 10.58 (6.06) | −0.53 (−2.54 to 1.48) | 0.601 |
| pCO2 (mmHg) | 93 | 28.46 (8.81) | 44 | 30.5 (10.86) | −1.17 (−5.48 to 1.4) | 0.243 |
| Age at admission (years) | 91 | 30.1 (11.75) | 44 | 58.73 (13.83) | – (−33.4 to −23.68) | <0.001 |
| Age of DM onset (years) | 87 | 14.98 (10.11) | 26 | 49.5 (15.36) | −10.79 (−41.04 to −28) | <0.001 |
| DKA severity | 93 | – | 44 | – | – | 0.913 |
| ICS length of stay (days) | 65 | 1 (Ip25–p75 3) | 30 | 1 (Ip25–p75 3) | – | 0.951 |
| Total inward (days) | 86 | 7 (Ip25–p75 5) | 40 | 9 (Ip25–p75 7) | – | 0.032 |
| Hours in ED | 91 | 6 (Ip25–p75 12) | 43 | 6 (Ip25–p75 14.7) | – | 0.63 |
| ICS admission (yes/no) | 93 | 47 (50.5%) | 44 | 20 (45.5%) | – | 0.355 |
| Hospital admission (yes/no) | 93 | 82 (88.2%) | 44 | 34 (77.3%) | – | 0.083 |
| 28-days readmission rate (yes/no) | 79 | 10 (12.7%) | 39 | 3 (7.7%) | – | 0.318 |
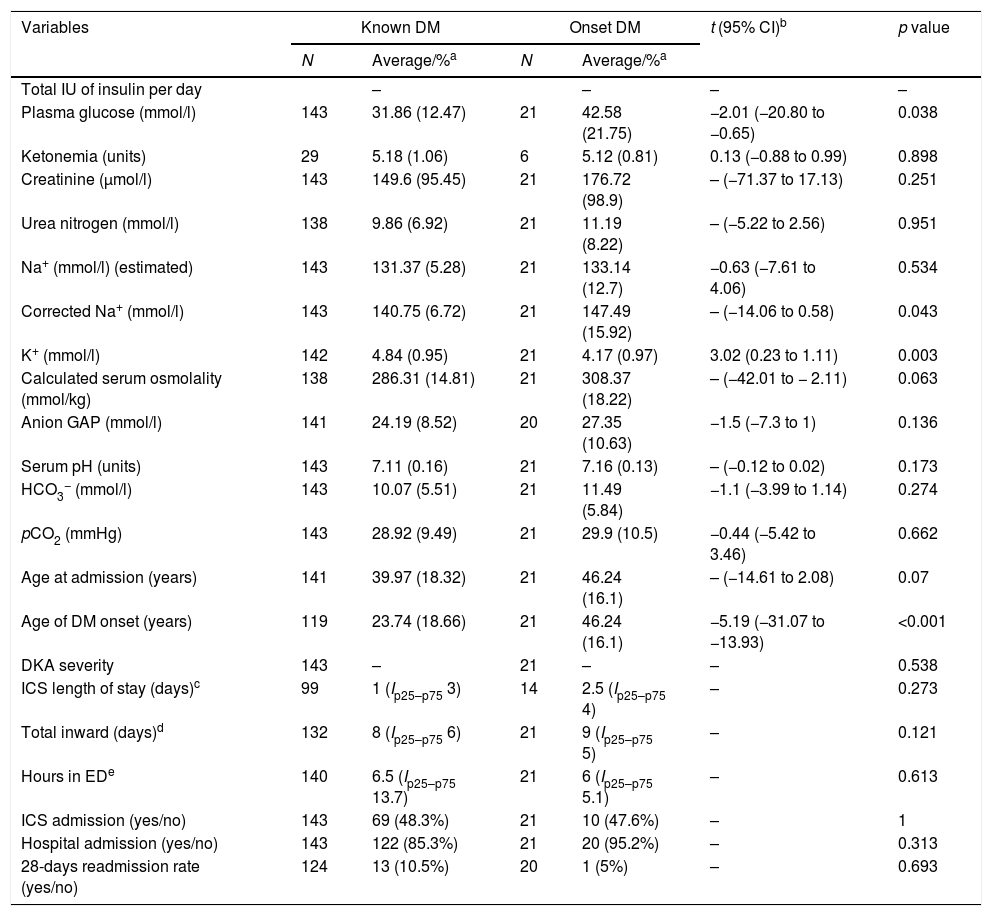
Patients with DM onset (Table 3) was found to be older [46.24 (16.1) vs. 23.74 (18.66); t=−5.19, 95% CI (−31.07 to −13.93), p<0.001] and to have higher plasma glucose values [42.58 (21.75) vs. 31.85 (12.47); t=−2.01, 95% CI (−20.80 to −0.65), p=0.038], corrected Na+ levels [147.49 (15.92) vs. 140.75 (6.72), p=0.043] and lower K+ values [4.17 (0.97) vs. 4.84 (0.95); t=3.02, 95% CI (0.23–1.11), p=0.003]. Interestingly, in subgroup's analysis (type 1 DM or type 2 versus DM onset), it was found a difference in the length of total hospital stay in the subgroup of type 1 DM [DM1, 7 (Ip25−p75 5) vs. onset, 9 (Ip25–p75 5), p=0.022].
Main differences in the onset of diabetes mellitus in variables directly related to DKA, length of stay and admission rates in ICS and general medical ward.
| Variables | Known DM | Onset DM | t (95% CI)b | p value | ||
|---|---|---|---|---|---|---|
| N | Average/%a | N | Average/%a | |||
| Total IU of insulin per day | – | – | – | – | ||
| Plasma glucose (mmol/l) | 143 | 31.86 (12.47) | 21 | 42.58 (21.75) | −2.01 (−20.80 to −0.65) | 0.038 |
| Ketonemia (units) | 29 | 5.18 (1.06) | 6 | 5.12 (0.81) | 0.13 (−0.88 to 0.99) | 0.898 |
| Creatinine (μmol/l) | 143 | 149.6 (95.45) | 21 | 176.72 (98.9) | – (−71.37 to 17.13) | 0.251 |
| Urea nitrogen (mmol/l) | 138 | 9.86 (6.92) | 21 | 11.19 (8.22) | – (−5.22 to 2.56) | 0.951 |
| Na+ (mmol/l) (estimated) | 143 | 131.37 (5.28) | 21 | 133.14 (12.7) | −0.63 (−7.61 to 4.06) | 0.534 |
| Corrected Na+ (mmol/l) | 143 | 140.75 (6.72) | 21 | 147.49 (15.92) | – (−14.06 to 0.58) | 0.043 |
| K+ (mmol/l) | 142 | 4.84 (0.95) | 21 | 4.17 (0.97) | 3.02 (0.23 to 1.11) | 0.003 |
| Calculated serum osmolality (mmol/kg) | 138 | 286.31 (14.81) | 21 | 308.37 (18.22) | – (−42.01 to − 2.11) | 0.063 |
| Anion GAP (mmol/l) | 141 | 24.19 (8.52) | 20 | 27.35 (10.63) | −1.5 (−7.3 to 1) | 0.136 |
| Serum pH (units) | 143 | 7.11 (0.16) | 21 | 7.16 (0.13) | – (−0.12 to 0.02) | 0.173 |
| HCO3− (mmol/l) | 143 | 10.07 (5.51) | 21 | 11.49 (5.84) | −1.1 (−3.99 to 1.14) | 0.274 |
| pCO2 (mmHg) | 143 | 28.92 (9.49) | 21 | 29.9 (10.5) | −0.44 (−5.42 to 3.46) | 0.662 |
| Age at admission (years) | 141 | 39.97 (18.32) | 21 | 46.24 (16.1) | – (−14.61 to 2.08) | 0.07 |
| Age of DM onset (years) | 119 | 23.74 (18.66) | 21 | 46.24 (16.1) | −5.19 (−31.07 to −13.93) | <0.001 |
| DKA severity | 143 | – | 21 | – | – | 0.538 |
| ICS length of stay (days)c | 99 | 1 (Ip25–p75 3) | 14 | 2.5 (Ip25–p75 4) | – | 0.273 |
| Total inward (days)d | 132 | 8 (Ip25–p75 6) | 21 | 9 (Ip25–p75 5) | – | 0.121 |
| Hours in EDe | 140 | 6.5 (Ip25–p75 13.7) | 21 | 6 (Ip25–p75 5.1) | – | 0.613 |
| ICS admission (yes/no) | 143 | 69 (48.3%) | 21 | 10 (47.6%) | – | 1 |
| Hospital admission (yes/no) | 143 | 122 (85.3%) | 21 | 20 (95.2%) | – | 0.313 |
| 28-days readmission rate (yes/no) | 124 | 13 (10.5%) | 20 | 1 (5%) | – | 0.693 |
a Average and SD or median and IQR where indicated in function of every given variable.
bt of Student is given if a normal distribution is found. If not, then the non-parametric Mann–Whitney test were used.
c DM1 vs. onset: MW-U=370, p=0.26; DM 2 vs. onset: MW-U=176.5, p=0.383.
d DM1, 7 (Ip25–p75 5) vs. onset, 9 (Ip25–p75 5): MW-U=612, p=0.022; DM 2, 9 (Ip25–p75 7) vs. onset, 9 (Ip25–p75 5): MW-U=410.5, p=0.885.
e DM1 vs. onset: MW-U=856.5, p=0.46; DM 2 vs. onset: MW-U=421, p=0.662.
In the present study we have found that the mortality attributable to DKA is less than 5%, although most episodes are moderate or severe. The readmission rate at 28 days reached 9.7%, similar to other reports with a similar sample of patients.13 Our percentage could be partly influenced by incomplete data in some patients who had not been following up in our center (travellers, etc.), and also for the design of the study, considering that it counts every episodes, and does not excluded patients with social problems, whose do not follow the therapy instructions regularly and, then, some are hyper-frequent in health services. In any case, it should be noted that it was not recorded any death. This low DKA mortality rate could be influenced by several reasons9: advances in the patient's self-daily monitoring of the capillary blood glucose and nurse and medical ambulatory care, improvements of therapy protocols and a larger population DM screening. These facts could also explain a decrease in the incidence of DKA among patients with diabetes (as shown in our study).7,9
The decision to not include patients under 18 years old was due to the next main reasons: the influence of the particular organization of the center and the study design itself (working group, revision of clinical reports, different areas of emergency care…).
Wang et al.14 showed an overall decrease of DKA mortality of 4.4% per year/105 inhabitants. These results update the knowledge of past decades.15,16 Ko et al.17 reported an increased in ED visits from 1995, but in context of a progressive decline of DKA mortality since the 1980s. However, it is important to foreground that the mortality reached 12.2% in patients treated between 1996 and 2002. Although this mortality rate is high for today's standards, that might be conditioned by the low number of patients finally included in the study – the same problem detected in other studies of closer geographical scope to ours.7,18
DKA mortality is more related to the triggering process (severe coexisting diseases) than to the metabolic complication itself.19 Infections are reported to be most frequent precipitant factor of DKA. Omission of insulin dose remains the second most common cause of DKA episodes.5
We found some differences in lengths of stay in the hospital among the DKA categories. However, these data might have some limitations, because the length of stay in ED could be even shorter than reported. Somehow, in daily practice is not uncommon that occur a gap time between the transfer of the patient to another hospital area and the medical file's closing by physicians. The length of stay in ED is longer in those patients with mild DKA, probably because the treatment would be safely completed and, thus, the patient could be an earlier discharge, without needing further hospitalization. In contrast, the length of stay in severe DKA is the shortest, since admission to ICS is quickly made. Our results contrast with those of Freire et al.20 who reported absence of differences between inward lengths of stay of moderate and/or severe DKA episodes (extended length of stay was defined as ≥3 days in ICS and ≥6 days in medical ward). Our ICS admission rate reached almost 50%, consistent with other previous studies that indicate the routine admission of DKA patients in IC units.20 Criteria for ICS admission were not only severe DKA, but also any severe medical condition.
Due to the fact of the increasing prevalence of type 2 DM and obesity in some series, up to one third of the described cases of DKA occurred in those patients with type 2 DM.6,20 We have found some biochemical differences in DKA crises in those patients with type 2 DM that basically reflect a more pronounced state of dehydration.21 As our current study shows, plasma levels of glucose and serum pH in DKA crises are not different between patients with type 1 DM or type 2 DM. Thereby, it should be recommended an earlier and routinely detection of capillary ketone bodies in type 2 DM with apparent simple hyperglycaemic crises,22 because it could represent a prompt warning sign of metabolic deterioration.23 The longer inward of patients with type 2 DM could be explained on the basis of older age and more frequent co-morbidities.24
In the case of patients with DM onset, higher levels of plasma glucose and corrected Na+, and lower values of K+, could be explained by a more pronounced relative insulin deficiency state and glucotoxic effect during the DKA episode than in patients with known DM. This hypothesis could not be verified due to we have not routinely measured C-peptide in ED.
In summary, DKA mortality rate continues to decline nowadays, and it is more related to the underlying medical condition than to the metabolic crises itself, even though most of episodes are moderate or severe. Most patients require hospital admission, and in the cases of severe DKA are routinely indicated in ICS. The length of stay in ED is linked to the degree of severity of DKA episodes, being the longest time in mild cases – they could have possibilities of an early home discharge. The type 2 DM patients, who suffer from a DKA crises, tend to have a dehydration state, despite to there are no differences in acidosis or hyperglycaemic state severity and should be educated about the signs and symptoms of DKA.
Author contributionsPGV designed and managed the study, contributed and revised the database, developed the statistical analysis and wrote the article. MCM revised the data, contributed to design and database and wrote the manuscript. JCG designed the study, contributed to initial database and drafted the paper. AM and MC contributed to development of initial database. OG contributed to initial design and development of initial database. All authors have contributed with clinical data and have read and approved the manuscript.
Conflict of interestNone of the authors have received any founding or grant for the preparation of this manuscript. They have no commercial interests or intellectual property in any drug, device or medical equipment mentioned in this article.
All authors meet criteria for authorship and will sign a statement attesting authorship, disclosing all potential conflicts of interest, and releasing the copyright should the manuscript be acceptable for publication. This manuscript has been read and approved by all the authors.
We would like to acknowledge the comments and help in the initial development of the manuscript to Ana Royuela, M.Sc., CIBER Epidemiología y Salud Pública (CIBERESP); Unidad de Bioestadística Clínica, Hospital Ramón y Cajal, IRICYS, Madrid, Spain.
The following are the supplementary data to this article:
