


(1) Nutritional assessment of the diet followed by patients with metabolic syndrome and (2) biochemical analysis of the oxidation–reduction level in patients with metabolic syndrome.
Materials and methodsA cross-sectional study was conducted in patients with metabolic syndrome in Murcia. Fifty-three patients, 33 with and 20 without (control group) metabolic syndrome, were selected. The intervention consisted of completion of a recall survey and a test to nutritionally assess dietary intake. Anthropometric and laboratory variables, including those related to antioxidant activity, were also tested.
ResultsAntioxidant activity was within normal limits in both groups (1.7±0.2mmol/L in the control group and 1.8±0.1mmol/L in the metabolic syndrome group) (NS). Superoxide dismutase levels were not significantly different between the groups. Mean glutathione reductase levels (U/L) were higher in the control group when compared to patients with metabolic syndrome (p<0.05). With regard to oxidative stress biomarkers, mean isoprostane levels were higher in the control group (4.9±6.2ng/mL) than in the metabolic syndrome patients (3.5±3.9ng/mL) (p<0.05). Oxidized LDL values tended to be higher in metabolic syndrome patients (96±23.2U/L) when compared to the control group (86.2±17.3U/L), but differences were not significant.
ConclusionsThere is a trend to a poorer nutritional and biochemical profile in patients with metabolic syndrome, who also tend to have a greater degree of oxidative stress.
1) Valorar nutricionalmente la dieta seguida por los pacientes con síndrome metabólico, y 2) analizar bioquímicamente el nivel de oxidación-reducción en los pacientes con síndrome metabólico.
Material y métodoSe trata de un estudio transversal realizado a pacientes con síndrome metabólico de la Región de Murcia. Se seleccionaron 53 individuos, 33 con síndrome metabólico y 20 sin él (grupo control). La intervención realizada consistió en la cumplimentación de una encuesta recordatorio y un test para valorar nutricionalmente la ingesta dietética, además de la determinación de variables antropométricas y analíticas que incluyen variables relacionas con la actividad antioxidante.
ResultadosLa actividad antioxidante en ambos grupos analizados está dentro de los límites normales (1,7±0,2mmol/l en el grupo control y 1,8±0,1mmol/l en el grupo con síndrome metabólico; ns). La enzima superóxido dismutasa no presenta diferencias significativas entre ambos grupos. Los valores medios de glutatión reductasa (U/l) son superiores en el grupo control que en los pacientes con SM (p<0,05). Respecto a los biomarcadores de estrés oxidativo, los valores medios de isoprostanos son superiores en el grupo control (4,9±6,2ng/ml) que en los pacientes con SM (3,5±3,9ng/ml; p<0,05). Los valores de LDL oxidadas tienden a ser superiores en los enfermos con SM (96±23,2U/l) que en el grupo control (86,2±17,3U/l), no observándose diferencias significativas.
ConclusionesExiste una tendencia a un peor perfil nutricional y bioquímico de los pacientes que presentan síndrome metabólico. También tienden a presentar un mayor grado de estrés oxidativo.
Metabolic syndrome (MS) encompasses a number of risk factors including central obesity, dyslipidemia, abnormal glucose metabolism and high blood pressure, associated to insulin resistance, which increases risk of diabetes mellitus, heart disease (myocardial infarction and heart failure), peripheral artery disease, stroke, and kidney disease.1,2 Resistance to the peripheral action of insulin is the common pathogenetic link and plays a central role in development, progression, and destabilization of atheroma plaque by different pathogenetic pathways. Thus, glucose metabolism changes usually coexist in a same individual with classical risk factors (high blood pressure, dyslipidemia, overweight-obesity) and cardiovascular risk markers (inflammation, altered fibrinolysis).3,4 This series of changes form the so-called MS, and are important because of their relationship with cardiovascular risk.5–7
Prevalence of MS varies depending on factors such as sex and age, and ranges from 15% to 40%.1,6 There are several criteria to diagnose MS. The most widely known is the Third Report of the Expert Panel on Detection, Evaluation, and Treatment of High Blood Cholesterol in Adults (Adult Treatment Panel III),8 according to which three or more of the following criteria should be met: elevated abdominal circumference (>102cm in males and >88cm in females), triglycerides >150mg/dL, low HDL (<40mg/dL in males and <50mg/dL in females), blood pressure >130/85mmHg, and blood glucose >110mg/dL, including diabetes mellitus. Other factors such as inflammation, hyperuricemia, smoking, sedentary lifestyle, age, polycystic ovary syndrome, and microalbuminuria were also considered.
The criteria issued by the Adult Treatment Panel III defined a type of patient with high cardiovascular risk and are most commonly used, although no universal agreement exists in this regard. Because of the evident association of MS with cardiovascular disease, it should be prevented by promoting healthy habits since childhood, stressing the importance of a healthy diet and regular exercise.8–13
It was considered interesting to undertake a study analyzing the biochemical and nutritional characteristics of patients with MS. Therefore, objectives of this study included: (1) to nutritionally assess the diet taken by patients with MS and (2) to biochemically analyze the oxidation-reduction level in patients with MS.
Patients and methodsThis was a cross-sectional study conducted on patients with MS in the region of Murcia (Spain).
The study sample was randomly selected using representative sampling. An opportunistic search system was used to enroll patients who attended a health center on demand or on an appointment, met the inclusion criteria, and agreed to participate. The sample consisted of 53 patients of both sexes (29 female and 24 male patients) with ages ranging from 50 to 65 years. Patients with MS (n=33) met three of the requirements established by the Adult Treatment Panel III,8 and the control group (n=20) consisted of healthy subjects of the same age range. Information about the study was provided to each patient, and all participants gave their written informed consent. Subjects with any infectious disease at the time of the study; use of multivitamin preparations; severe kidney, liver, or systemic disease; abnormal dietary habits (e.g. no fruit or vegetables in diet); and body mass index (BMI) >30kg/m2 were excluded from the study.
The intervention conducted consisted of completing a reminder survey and a test to nutritionally assess dietary intake. Weight, height, BMI, and waist circumference measurements were also made. Patients were also taken blood from an antecubital vein for laboratory measurements. The 24h reminder survey is a retrospective and quantitative method to assess dietary intake using an interview. This procedure assesses the actual intake of individuals in the past 24h. For this, the interviewer asks the subject to recall all the foods and ingredients taken the day before the interview. Each subject answered three 24h reminder surveys in the study for three non-consecutive days, including a holiday or a weekend. Nutritional assessment of 24h diet reminders was done using the software Nutritional assessment and support of inpatients and outpatients, DietSOURCE® version 2.01, prepared by Novartis Health S.A. It was considered that three 24h reminder surveys on three non-consecutive days (considering a holiday) could allow for nutritional assessment of a subject. Surveys were directly conducted by the same person to each patient or control subject.
Laboratory measurements consisted of evaluation of total antioxidant status, antioxidant enzymes (glutathione peroxidase, glutathione reductase, superoxide dismutase), oxidation markers of genetic material (8-hydroxy-2′-deoxyguanosine), protein oxidation markers (carbonyl groups), lipid oxidation markers (isoprostanes, oxidized LDL, reduced glutathione/oxidized glutathione ratio), and general biochemistry (glucose, total cholesterol, HDL cholesterol, LDL cholesterol, triglycerides, total protein, albumin, uric acid, homocystein, urea, C-reactive protein).
SPSS® v 13.0 software was used for statistical analysis. The mean and standard deviation of the measurements obtained were calculated. Means of the evaluated variables were compared using a Student's t test. A value of p<0.05 was considered statistically significant.
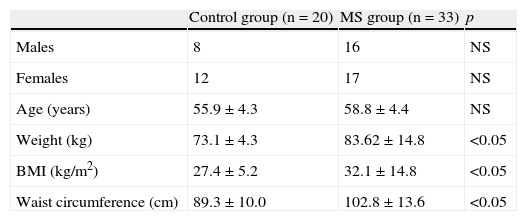
ResultsPatients with MS had a mean (standar deviation) age of 58.1 (4.3) years, mean weight of 83.62 (14.8)kg, mean BMI of 32.1 (14.8)kg/cm2, and mean waist circumference of 102.8 (13.6)cm. Control subjects had a mean age of 55.9 (4.32) years, mean weight of 73.1 (4.3)kg, mean BMI of 27.4 (5.2)kg/cm2, and mean waist circumference of 102.8 (13.6)cm. A Student's t test for independent samples showed significant difference (p<0.05) in BMI, weight, and waist circumference (Table 1), with higher values in patients with MS.
Description of population sample.
| Control group (n=20) | MS group (n=33) | p | |
| Males | 8 | 16 | NS |
| Females | 12 | 17 | NS |
| Age (years) | 55.9±4.3 | 58.8±4.4 | NS |
| Weight (kg) | 73.1±4.3 | 83.62±14.8 | <0.05 |
| BMI (kg/m2) | 27.4±5.2 | 32.1±14.8 | <0.05 |
| Waist circumference (cm) | 89.3±10.0 | 102.8±13.6 | <0.05 |
BMI, body mass index; NS, not significant; MS, metabolic syndrome.
Values are mean±standard deviation.
Mean (standard deviation) energy expenditure was 1432.5 (372.9)kcal/day in patients with MS, tending to be lower as compared to that in the control population, which was 1556.5 (425.2)kcal/day (NS). There were no significant differences in mean protein consumption, which was 72.2 (20)g (18.3%) in the control group and 63 (14)g (18%) in MS patients. Mean protein consumption was approximately 1g/kg/day in the control population and approximately 1.3g/kg/day in patients with MS. Mean lipid consumption in the control population and in patiens with MS was 38.6 (9) and 39.8 (8)% respectively (NS). Fatty acid consumption in the control population consisted of 9.9 (3)% saturated fatty acids–18.6 (9.4)g, 16.3% monounsaturated fatty acids–29.5 (12.5)g, and 5.6 (4)% polyunsaturated fatty acids–11.5 (12)g. Consumption of eicosapentaenoic and docosahexaenoic acids was 0.24 (0.26)g and 0.38 (0.35)g respectively, much lower than the recommended amounts of 1.6g in men and 1.1g in women. Fatty acid consumption in the MS population consisted of 11.4 (4)% saturated fatty acids–19 (13)g, 16.3 (3)% monounsaturated fatty acids–26 (10)g, and 5.7 (2)% polyunsaturated fatty acids–9 (3.5)g. Consumption of eicosapentaenoic and docosahexaenoic acids was 0.15 (0.16)g and 0.30 (0.3)g respectively, also much lower than the recommended amounts. Comparison of fatty acid consumption in the control and MS populations only showed a significant difference in mean consumption of saturared fatty acids, which was higher in the population with MS (p<0.05). Carbohydrate consumption was lower than recommended (55%), 41.5 (6.6)% in MS patients and 43 (8.6)% in the control group. Fiber intake was 15 and 13g in the control group and the population with MS respectively, with no significant differences.
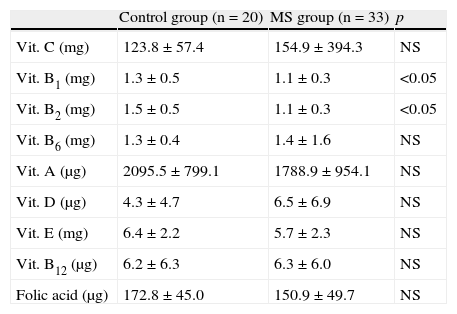
As regards vitamins, Table 2 shows the amounts taken by MS patients and the control group. Patients with MS tended to ingest greater amounts of vitamin C, pyridoxine, and cyanocobalamin, with no significant differences. Thiamine and riboflavin intake was lower in the control group (p<0.05). No significant differences were seen between the homocysteine levels found in the control group and patients with MS, 11.6 (2.9) and 11.5 (2.5)μmol/L respectively.
Vitamin intake in the control group and patients with metabolic syndrome.
| Control group (n=20) | MS group (n=33) | p | |
| Vit. C (mg) | 123.8±57.4 | 154.9±394.3 | NS |
| Vit. B1 (mg) | 1.3±0.5 | 1.1±0.3 | <0.05 |
| Vit. B2 (mg) | 1.5±0.5 | 1.1±0.3 | <0.05 |
| Vit. B6 (mg) | 1.3±0.4 | 1.4±1.6 | NS |
| Vit. A (μg) | 2095.5±799.1 | 1788.9±954.1 | NS |
| Vit. D (μg) | 4.3±4.7 | 6.5±6.9 | NS |
| Vit. E (mg) | 6.4±2.2 | 5.7±2.3 | NS |
| Vit. B12 (μg) | 6.2±6.3 | 6.3±6.0 | NS |
| Folic acid (μg) | 172.8±45.0 | 150.9±49.7 | NS |
NS, not significant; MS, metabolic syndrome; Vit., vitamin.
Values are mean±standard deviation.
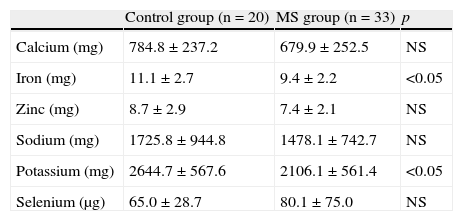
As regards minerals (Table 3), significant differences were only seen in iron and potassium intake, which was higher in the control group (p<0.05).
Mineral intake in the control group and patients with metabolic syndrome.
| Control group (n=20) | MS group (n=33) | p | |
| Calcium (mg) | 784.8±237.2 | 679.9±252.5 | NS |
| Iron (mg) | 11.1±2.7 | 9.4±2.2 | <0.05 |
| Zinc (mg) | 8.7±2.9 | 7.4±2.1 | NS |
| Sodium (mg) | 1725.8±944.8 | 1478.1±742.7 | NS |
| Potassium (mg) | 2644.7±567.6 | 2106.1±561.4 | <0.05 |
| Selenium (μg) | 65.0±28.7 | 80.1±75.0 | NS |
NS, not significant; MS, metabolic syndrome.
Values are mean±standard deviation.
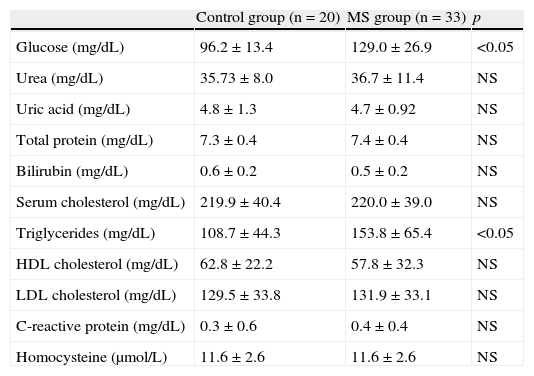
Patients with MS had glucose and triglyceride levels higher than normal and than those found in the control group (p<0.05) (Table 4).
Biochemical parameters tested in the control group and patients with metabolic syndrome.
| Control group (n=20) | MS group (n=33) | p | |
| Glucose (mg/dL) | 96.2±13.4 | 129.0±26.9 | <0.05 |
| Urea (mg/dL) | 35.73±8.0 | 36.7±11.4 | NS |
| Uric acid (mg/dL) | 4.8±1.3 | 4.7±0.92 | NS |
| Total protein (mg/dL) | 7.3±0.4 | 7.4±0.4 | NS |
| Bilirubin (mg/dL) | 0.6±0.2 | 0.5±0.2 | NS |
| Serum cholesterol (mg/dL) | 219.9±40.4 | 220.0±39.0 | NS |
| Triglycerides (mg/dL) | 108.7±44.3 | 153.8±65.4 | <0.05 |
| HDL cholesterol (mg/dL) | 62.8±22.2 | 57.8±32.3 | NS |
| LDL cholesterol (mg/dL) | 129.5±33.8 | 131.9±33.1 | NS |
| C-reactive protein (mg/dL) | 0.3±0.6 | 0.4±0.4 | NS |
| Homocysteine (μmol/L) | 11.6±2.6 | 11.6±2.6 | NS |
NS, not significant; MS, metabolic syndrome.
Values are mean±standard deviation.
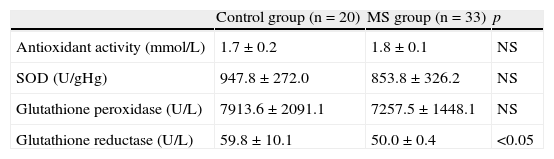
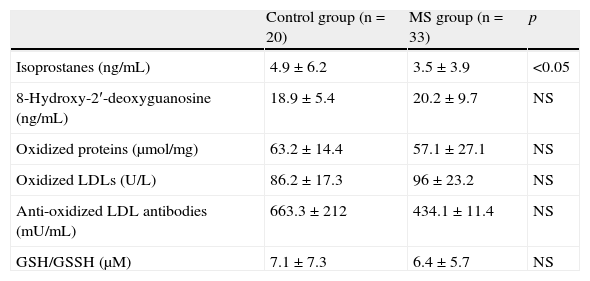
Antioxidant activity (Table 5) was within normal limits (1.16–1.94mmol/L), with no significant differences between the groups. There were no significant differences between the groups for the enzyme superoxide dysmutase. Mean glutathione reductase levels (U/L) were higher in the control group as compared to the patients with MS (p<0.05). As regards oxidative stress biomarkers (Table 6), mean isoprostane levels were higher in the control group–4.9 (6.2)ng/mL–when compared to patients with MS – 3.5 (3.9)ng/mL (p<0.05). The reduced glutathione/oxidized glutathione ratio showed a trend to be lower in patients with MS when compared to the control group, although differences were not significant. Oxidized LDL values tended to be higher in patients with MS–96 (23.2)U/L–as compared to the control group–86.2 (17.3)U/L, with no significant differences.
Antioxidant activity and antioxidant enzymes in the control group and patients with metabolic syndrome.
| Control group (n=20) | MS group (n=33) | p | |
| Antioxidant activity (mmol/L) | 1.7±0.2 | 1.8±0.1 | NS |
| SOD (U/gHg) | 947.8±272.0 | 853.8±326.2 | NS |
| Glutathione peroxidase (U/L) | 7913.6±2091.1 | 7257.5±1448.1 | NS |
| Glutathione reductase (U/L) | 59.8±10.1 | 50.0±0.4 | <0.05 |
NS, not significant; MS, metabolic syndrome; SOD, superoxide dysmutase.
Values are mean±standard deviation.
Oxidative stress biomarkers in the control group and patients with metabolic syndrome.
| Control group (n=20) | MS group (n=33) | p | |
| Isoprostanes (ng/mL) | 4.9±6.2 | 3.5±3.9 | <0.05 |
| 8-Hydroxy-2′-deoxyguanosine (ng/mL) | 18.9±5.4 | 20.2±9.7 | NS |
| Oxidized proteins (μmol/mg) | 63.2±14.4 | 57.1±27.1 | NS |
| Oxidized LDLs (U/L) | 86.2±17.3 | 96±23.2 | NS |
| Anti-oxidized LDL antibodies (mU/mL) | 663.3±212 | 434.1±11.4 | NS |
| GSH/GSSH (μM) | 7.1±7.3 | 6.4±5.7 | NS |
GSH/GSSH, reduced glutathione/oxidized glutathione; NS, not significant; MS, metabolic syndrome.
Values are mean±standard deviation.
The clinical significance of MS has been related to its potential impact on cardiovascular morbidity and mortality in patients with and without diabetes. As an example, in the Lakka et al.14 study, which excluded diabetic patients, presence of MS tripled the risk of cardiovascular mortality. Similarly, association of high BMI, hypertriglyceridemia, decreased HDL, and hyperinsulinemia may predict for cardiovascular mortality in patients with type 2 diabetes, as reported in the Lehto et al. study.15 Prediction of vascular risk based on presence of MS is not surprising, because all MS components have been separately associated to cardiovascular morbidity and mortality in many studies and have attracted the attention of scientific societies.16,17
This study provides evidence of a poorer nutritional and biochemical profile in patients with MS. They also had greater oxidative stress, which may account for the greater cardiovascular morbidity and mortality seen in those patients. The higher mean consumption of saturated fatty acids in patients with MS may be a significant factor for explaining the differences in laboratory variables between both groups.
It should be noted that energy expenditure in the whole population sample was lower than recommended for the Spanish population (2400kcal in men and 1875kcal in women), which may result in a significant energy deficiency or a bias in the conduct of the nutritional survey. Folic acid intake in the tested population was also lower than recommended (400μg), with significant differences when results were compared to the reference values for the elderly population. Folic acid deficiency is quite common in the elderly population, and its main causes are inadequate intake and decreased absorption. Moreover, deficiency of this vitamin is higher than could be expected using as reference plasma folic acid levels only, because metabolic changes have been seen in patients with normal levels. Millen et al.18 reported that a poor quality diet (rich in lipiids and deficient in carbohydrates, fiber, and micronutrients) predicts for MD overall and for abdominal obesity in particular.
Wtih regard to oxidative stress, uncontrolled increase in free radicals in our body occurs due to imbalance between production of pro-oxidant and antioxidant substances. Oxidative stress has been associated to aging and several conditions such as diabetes, MS, and cardiovascular disease, amongst others. Obesity and a sedentary lifestyle increase intracellular glucose and free fatty acids, which increases free radicals and oxidative stress. Esposito et al.19,20 reported that patients with MS had greater levels of oxidative stress, and associated this to increased insulin resistance and endothelial dysfunction. These changes may mutually interact and amplify the set of metabolic and vascular changes. In fact, impaired endothelial function, which responds poorly to relaxing stimuli such as acetylcholine or increased flow, occurs in each of the disorders that characterize MS (diabetes, obesity, high blood pressure, hyperlipidemia). The reduced glutathione/oxidized glutathione ratio was lower in patients with MS as compared to the control group, although no significant differences were seen. Atherosclerosis has been associated to increased lipid peroxidation and oxidative stress. When LDLs come into contact with arterial walls, they experience progressive oxidation by endothelial cells and macrophages. Hypercholesterolemia increases both the amount of LDLs entering the arterial walls and their oxidation. Oxidized LDLs are taken up by macrophages through specific elimination receptors and lead to formation of foam cells characteristic of atherosclerosis.
Since MS is heterogeneous, with a variable proportion of insulin resistance and secretion deficiency, and vascular risk is higher in patients in whom insulin resistance predominates,21–29 clinical detection is important in order to implement adequate preventive therapeutic measures because, in addition, patients with diabetes have a poorer prognosis than non-diabetics when a coronary event occurs.
A limitation or bias of this study is the fact that it was conducted in a single region, Murcia. Results cannot therefore be generalized because the different regions have intrinsic characteristics that may modulate the results obtained. The nutritional survey may involve a bias in that patients do not adequately recall what they have eaten on the previous days. It would also have been of interest to include a larger sample.
Corrective actions must therefore be taken to improve dietary and metabolic control in our patients with MS. Physicians should be made aware of the importance of adequate control of these patients.
Conflict of interestThe authors state that they have no conflict of interest.
Please cite this article as: Bernabé García J, Zafrilla Rentero P, Mulero Cánovas J, Gómez Jara P, Leal Hernández M, Abellán Alemán J. Marcadores bioquímicos, nutricionales y actividad antioxidante en el síndrome metabólico. Endocrinol Nutr. 2014;61:302–308.
