


This study aimed to assess if ALT levels, as a marker of non-alcoholic fatty liver disease, may predict HbA1c response to treatment with GLP-1 receptor agonists (GLP-1 RAs).
Patients and methodsA retrospective, longitudinal, analytical study was conducted including patients with type 2 diabetes mellitus continuously treated with GLP-1 agonists (85% with liraglutide) for one year. Patients were divided into two groups according to baseline ALT levels, with 24U/L (the median of the distribution) as the cut-off point. The dependent variable was HbA1c change (one-year follow-up minus baseline).
The predictive value of ALT levels above 24U/L and ALT change was analyzed using multivariate linear regression adjusted to age, gender, diabetes duration, type and dose of GLP-1 RA, baseline HbA1c, baseline body mass index (BMI), and change in BMI.
ResultsA total of 117 patients (48% females) aged 58.6 (SD 9.6) years were enrolled into the study. Treatment was associated with a change in ALT of −4.3U/L (p=0.041) and a change in HbA1c of −1.1% (p<0.0001). Decreases in HbA1c (−1.41% vs −0.76%; p=0.045) and ALT (−9.25 vs 0.46U/L; p=0.002) were significantly higher in patients with ALT levels above the median. In the multivariate analysis, both ALT >24U/L (b=−0.74; 95% CI: −1.31 to −0.18; p=0.011) and ALT change (b=0.028; 95% CI: 0.010–0.046; p=0.003), were significant response predictors.
ConclusionsElevated baseline transaminase values and decreased transaminase levels during follow-up are associated to a favorable glycemic response to GLP-1 RAs.
Evaluar si los niveles de ALT, como marcador de esteatosis hepática no alcohólica, pueden determinar la respuesta hipoglucemiante al tratamiento con agonistas del receptor GLP-1 (AR-GLP1).
Pacientes y métodosEstudio analítico longitudinal retrospectivo. Se incluyeron pacientes con diabetes tipo2 (DM2) tratados sin interrupción con AR-GLP1 (85% liraglutida) durante un año. Se clasificó a los pacientes en 2 grupos según niveles iniciales de ALT, con punto de corte en la mediana (24U/l). La variable dependiente fue el cambio (final-inicial) de HbA1c.
El valor predictivo de niveles de ALT>24U/l y del cambio en ALT fue analizado con regresión lineal multivariante ajustada para edad, género, evolución de DM2, tipo y dosis de AR-GLP1, niveles iniciales de HbA1c, índice de masa corporal (IMC) y cambio de IMC.
ResultadosSe incluyeron 117 pacientes (48% mujeres) con edad media de 58,6 (DE 9,6) años. El tratamiento estuvo asociado con un cambio en ALT de −4,3U/l (p=0,041) y un cambio en HbA1c de −1,1% (p<0,0001). Tanto el descenso de HbA1c (−1,41% vs −0,76%; p=0,045) como el de ALT (−9,25 vs 0,46U/l; p=0,002) fueron significativamente más marcados en pacientes con ALT por encima de la mediana. En análisis multivariante tanto niveles de ALT>24U/l (b=−0,74; IC95%: −1,31 a −0,18; p=0,011) como el cambio en ALT (b=0,028; IC 95%: 0,010 a 0,046; p=0,003) fueron factores predictivos de respuesta.
ConclusionesNiveles elevados de transaminasas y su descenso se asocian a una respuesta hipoglucemiante favorable a AR-GLP1.
As the priority in the treatment of type 2 diabetes mellitus (T2DM) is the achievement of good metabolic control as soon and as safely as possible, advances are needed in our understanding of the factors able to predict the response of individual patients to the currently available drugs.1 Although the study of pharmacogenetic interactions may be a way to achieve personalized treatment in the future,2 today we need to rely on clinical criteria to select the specific treatment.
GLP-1 receptor agonists (GLP-1 RAs) are widely used in T2DM because of their multiple benefits, including the stimulation of glucose-dependent insulin secretion and the inhibition of glucose-regulated glucagon secretion, the slowing of gastric emptying, and increased satiety.3 Their use results in blood glucose decrease with no risk of hypoglycemia, decreased body weight, and an improvement in cardiovascular risk factors. The use of GLP-1 RAs in combination with other oral antidiabetic drugs and/or insulin is therefore recommended in international guidelines.4
Meta-analyses have shown that HbA1c decreases by approximately 1% after treatment with GLP-1 RAs, but this is a mean effect subject to wide variability.5 It would therefore be helpful to identify the parameters associated with a favorable response of patients to this drug class.
Since GLP-1 RAs are known to be able to improve insulin resistance in the liver,6 our hypothesis was that the efficacy of these agents could be increased in the presence of non-alcoholic fatty liver disease (NAFLD). Alanine aminotransferase (ALT) is a marker of NAFLD. In fact, even elevated ALT levels within the normal range have been associated with intrahepatic fat contents.7
The objectives of our study, based on the study of a database of patients with T2DM treated with GLP-1 RAs, were as follows:
- 1.
To select a clinical model predicting for a favorable response to treatment with GLP-1 RAs.
- 2.
To assess whether baseline ALT levels, as a marker of NAFLD, were able to predict the response to treatment.
This was an analytical, retrospective cohort study.
PatientsIn 2013, as part of a project led by the Aragonese Society of Endocrinology and Nutrition (SADEN), data started to be collected from patients with T2DM prescribed treatment with GLP-1 RAs by a specialist. This study guarantees patient anonymity and is retrospective in nature. Patients are treated at the discretion of the physician in charge. The base currently includes 356 patients. Hospitals which have contributed to date include: Hospital Miguel Servet (Saragossa), HCU Lozano Blesa (Saragossa), Hospital General de la Defensa (Saragossa), Hospital Comarcal de Barbastro (Huesca), and Hospital General San Jorge (Huesca).
The patients selected for this analysis met the following inclusion criteria:
- -
One year of continuous treatment with any GLP-1 RA.
- -
Valid data about change over time in HbA1c, body weight, and ALT.
Patients with baseline ALT levels greater than three times the upper normal limit and those with known liver disease were excluded.
Clinical endpointThe primary clinical endpoint was change in HbA1c (final HbA1c after one year of treatment−baseline HbA1c).
Variables collectedThe database includes the following patient characteristics:
- -
Clinical characteristics: age, sex, time since DM onset, weight and height with calculation of the body mass index (BMI), blood pressure, and the presence of chronic complications.
- -
Laboratory data: HbA1c, lipid profile, creatinine (with calculation of the glomerular filtration rate [GFR] using the CKD-EPI formula), and ALT. Patients were categorized into two groups based on their baseline ALT levels, using the median distribution (24U/L) as the cut-off point.
- -
Treatments for DM (including insulin doses and the calculation of dose/kg of weight for patients on insulin therapy), high blood pressure, and dyslipidemia. Treatment with GLP-1 RA was divided into two groups based on planned strength:
- ∘
Less potent: exenatide, lixisenatide, and liraglutide 0.6mg.
- ∘
More potent: liraglutide ≥1.2mg, and exenatide LAR.
- ∘
Biochemical variables were tested using the standard methods at each hospital.
Statistical methodsQuantitative variables are reported as mean and standard deviation (SD), and qualitative variables with frequency distribution. The comparison of patients based on baseline ALT levels was performed using a Mann–Whitney U test (quantitative variables) or a Chi-squared test (qualitative variables). Change in HvA1c, BMI, and ALT over time was assessed using a Friedman test.
The linear association between quantitative variables was assessed using Spearman's correlation coefficient.
A change in a variable was defined as the difference between final (at one year of follow-up) and baseline levels. The adjusted influence of independent variables on change in HbA1c was tested using multivariate linear regression. In this case, coefficient b was interpreted as a change in HbA1c (expressed as NGSP units in %) per unit increase in the independent variable evaluated.
The main variables predicting for change in HbA1c considered in our working hypothesis were baseline ALT (quantitative), baseline ALT >24U/L (qualitative), and change in ALT (quantitative). The prognostic significance of each of them was assessed by progressive adjustment in five models:
Model 1: univariate.
Model 2: adjustment for age, sex, the time since DM onset, baseline HbA1c, baseline BMI, baseline GFR.
Model 3: model 2 adjustment+type and strength of GLP-1 RA and treatment with glitazones.
Model 4: model 3 adjustment+change in BMI.
Model 5: The use of a sequential exclusion procedure to obtain the best model from model 4.
Finally, a sequential exclusion procedure was used to select two models predicting for change in HbA1c during follow-up from the following variables:
Basal model (only including variables collected at treatment start): age, sex, the time since DM onset, HbA1c, BMI, GFR, the type and strength of GLP-1 RA, and baseline ALT >24U/L.
Complete model: age, sex, the time since DM onset, HbA1c, BMI, GFR, the type and strength of GLP-1 RA, baseline ALT >24U/L, and change in the BMI and ALT during follow-up.
A value of p<0.05 was considered statistically significant. Statistical SPSS 22.0 software was used.
Results239 (67.1%) of the 356 patients were excluded. The main reasons for exclusion were their not having completed one year of follow-up (209 [58.7%] patients) and/or missing ALT levels (67 [18.8%] patients) and/or previously known liver disease (6 [1.7%] patients). The patients excluded were characterized by having a greater prevalence of combined treatment with insulin (51.7 vs 40.2%; p=0.04), but were comparable in all the other variables analyzed.
The patients enrolled (117, 47.9% females) had a mean age of 58.6 (SD 9.6) years, a mean time since DM onset of 9.6 (SD 7.1) years, and a mean BMI of 39.3 (SD 4.7) kg/m2. The most commonly used GLP-1 RA was liraglutide (85%), and 87% of patients were treated with liraglutide ≥1.2mg/day or exenatide LAR.
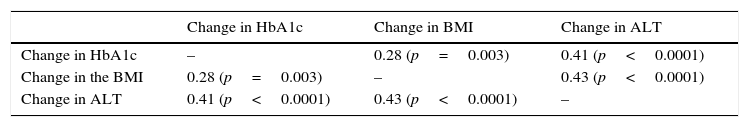
Significant differences were found between values at one year of follow-up and baseline values of HbA1c (7.34 vs 8.42%; p<0.0001), the BMI (37.7 vs 39.3kg/m2; p<0.0001), and ALT (27.9 vs 32.2U/L; p=0.041). There were statistically significant correlations between changes in HbA1c (−1.08 (SD 1.75)%), BMI (−1.6 (SD 2.6) kg/m2), and ALT (−4.3 (SD 15.6) U/L), as shown in Table 1 and Figs. 1 and 2.
Correlation between change in final (one-year follow-up) and baseline levels of HbA1c, the BMI, and ALT.
| Change in HbA1c | Change in BMI | Change in ALT | |
|---|---|---|---|
| Change in HbA1c | – | 0.28 (p=0.003) | 0.41 (p<0.0001) |
| Change in the BMI | 0.28 (p=0.003) | – | 0.43 (p<0.0001) |
| Change in ALT | 0.41 (p<0.0001) | 0.43 (p<0.0001) | – |
 in the BMI and change in HbA1c.")
 in ALT and change in HbA1.")
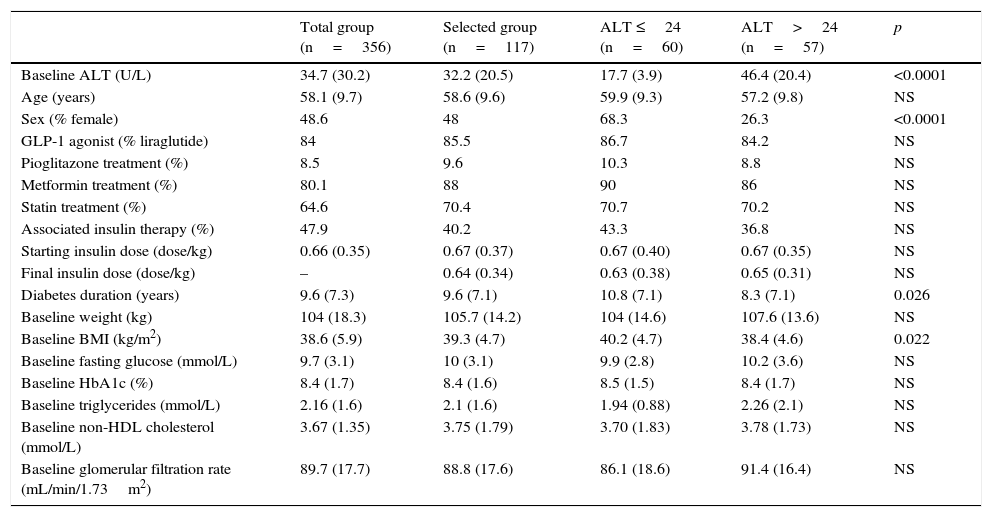
The characteristics of patients, categorized based on their baseline ALT levels, using 24U/L as the cut-off point, are shown in Table 2. The group of patients with ALT levels above the median was characterized by a shorter time since DM onset, a lower BMI, and male predominance. Patients with ALT >24U/L had greater reductions in HbA1c (−1.41 vs −0.76%; p=0.045) and ALT (−9.25 vs 0.46; p=0.002), but similar decreases in the BMI (−1.62 vs −1.63; p=0.99) as compared to patients with ALT ≤24U/L.
Characteristics of all patients in the database and selected patients.
| Total group (n=356) | Selected group (n=117) | ALT ≤24 (n=60) | ALT>24 (n=57) | p | |
|---|---|---|---|---|---|
| Baseline ALT (U/L) | 34.7 (30.2) | 32.2 (20.5) | 17.7 (3.9) | 46.4 (20.4) | <0.0001 |
| Age (years) | 58.1 (9.7) | 58.6 (9.6) | 59.9 (9.3) | 57.2 (9.8) | NS |
| Sex (% female) | 48.6 | 48 | 68.3 | 26.3 | <0.0001 |
| GLP-1 agonist (% liraglutide) | 84 | 85.5 | 86.7 | 84.2 | NS |
| Pioglitazone treatment (%) | 8.5 | 9.6 | 10.3 | 8.8 | NS |
| Metformin treatment (%) | 80.1 | 88 | 90 | 86 | NS |
| Statin treatment (%) | 64.6 | 70.4 | 70.7 | 70.2 | NS |
| Associated insulin therapy (%) | 47.9 | 40.2 | 43.3 | 36.8 | NS |
| Starting insulin dose (dose/kg) | 0.66 (0.35) | 0.67 (0.37) | 0.67 (0.40) | 0.67 (0.35) | NS |
| Final insulin dose (dose/kg) | – | 0.64 (0.34) | 0.63 (0.38) | 0.65 (0.31) | NS |
| Diabetes duration (years) | 9.6 (7.3) | 9.6 (7.1) | 10.8 (7.1) | 8.3 (7.1) | 0.026 |
| Baseline weight (kg) | 104 (18.3) | 105.7 (14.2) | 104 (14.6) | 107.6 (13.6) | NS |
| Baseline BMI (kg/m2) | 38.6 (5.9) | 39.3 (4.7) | 40.2 (4.7) | 38.4 (4.6) | 0.022 |
| Baseline fasting glucose (mmol/L) | 9.7 (3.1) | 10 (3.1) | 9.9 (2.8) | 10.2 (3.6) | NS |
| Baseline HbA1c (%) | 8.4 (1.7) | 8.4 (1.6) | 8.5 (1.5) | 8.4 (1.7) | NS |
| Baseline triglycerides (mmol/L) | 2.16 (1.6) | 2.1 (1.6) | 1.94 (0.88) | 2.26 (2.1) | NS |
| Baseline non-HDL cholesterol (mmol/L) | 3.67 (1.35) | 3.75 (1.79) | 3.70 (1.83) | 3.78 (1.73) | NS |
| Baseline glomerular filtration rate (mL/min/1.73m2) | 89.7 (17.7) | 88.8 (17.6) | 86.1 (18.6) | 91.4 (16.4) | NS |
Patients selected were stratified and compared to each other depending on baseline ALT levels, using the median of distribution as the cut-off point.
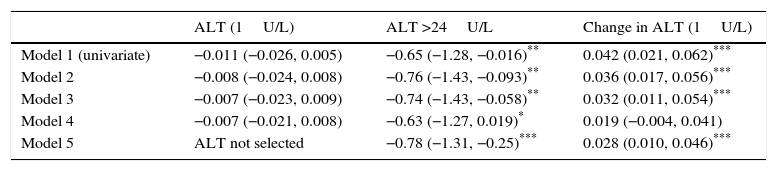
Table 3 shows the impact of baseline ALT levels, baseline ALT >24U/L, and change in ALT during follow-up on the change in HbA1c, with progressive adjustment for potential confounding factors. The adjusted additional difference in HbA1c decrease in patients with ALT >24U/L as compared to those with ALT ≤24U/L was −0.78 (95% CI: −1.31 to −0.25%; p=0.004). Each unit decrease in ALT levels was associated with an additional HbA1c decrease of 0.028 (95% CI: 0.010–0.046%; p=0.003).
Change in HbA1c (final HbA1c−baseline HbA1c) given as % induced by baseline ALT, ALT (>24U/L), and change in ALT (final ALT−baseline ALT).
| ALT (1U/L) | ALT >24U/L | Change in ALT (1U/L) | |
|---|---|---|---|
| Model 1 (univariate) | −0.011 (−0.026, 0.005) | −0.65 (−1.28, −0.016)** | 0.042 (0.021, 0.062)*** |
| Model 2 | −0.008 (−0.024, 0.008) | −0.76 (−1.43, −0.093)** | 0.036 (0.017, 0.056)*** |
| Model 3 | −0.007 (−0.023, 0.009) | −0.74 (−1.43, −0.058)** | 0.032 (0.011, 0.054)*** |
| Model 4 | −0.007 (−0.021, 0.008) | −0.63 (−1.27, 0.019)* | 0.019 (−0.004, 0.041) |
| Model 5 | ALT not selected | −0.78 (−1.31, −0.25)*** | 0.028 (0.010, 0.046)*** |
Model 1: univariate.
Model 2: adjustment for age, sex, time since DM onset, baseline HbA1c, baseline BMI, baseline GFR.
Model 3: model 2 adjustment+type and strength of GLP-1 RA and treatment with glitazones.
Model 4: model 3 adjustment+change in the BMI (final BMI−baseline BMI).
Model 5: the use of a sequential exclusion procedure to obtain the best model from model 4.
The best predictive model of change in HbA1c, obtained from variables measured at the start of treatment with GLP-1 RA, consisted (R2=0.358) of HbA1c (b=−0.65; 95% CI: −0.83 to −0.47; p<0.0001) and ALT >24U/L (b=−0.74; 95% CI: −1.31 to −0.18; p=0.011). The best predictive model, after including information on change in the BMI and ALT during follow-up, consisted (R2=0.62) of baseline HbA1c (b=−0.71; 95% CI: −0.87 to −0.54; p<0.0001), treatment with more potent agonists (b=−0.73; 95% CI: −1.43 to −0.02; p=0.043), change in the BMI (b=0.19; 95% CI: 0.08–0.31; p=0.001), and change in ALT (b=0.028; 95% CI: 0.010–0.046; p=0.003).
DiscussionThis study showed that, in a model adjusted for the type and strength of GLP-1 RAs, the main factors able to predict treatment-induced decrease in HbA1c were baseline HbA1c and decreases in the BMI and ALT. If only the information available at treatment start is taken into consideration, the determinants of response were baseline HbA1c and baseline ALT levels.
GLP-1 RAs mimic the action of gastrointestinal hormone GLP-1, which is physiologically secreted in response to food intake. GLP-1 regulates plasma glucose levels through the glucose-dependent stimulation of insulin secretion and the inhibition of glucagon release.8 Mean HbA1c reductions achieved in meta-analyses with GLP-1 vs placebo are approximately 0.6–1.2%5,8,9 depending on the type and dose of the analog administered. The baseline characteristics of patients that could predict a more favorable response to treatment have not been clearly identified: efficacy has been found to be independent of age, sex, the time since DM onset, and the baseline BMI.10 However, it has recently been reported that there may be ethnic differences, as a greater response (a −0.32% difference; 95% CI −0.64 to −0.01) has been found in patients of Asian descent.11 In our patients, HbA1c reduction was also not significantly associated with age, sex, time since DM onset, or the baseline BMI.
Among the parameters modulating the quantitative effect of drug administration on HbA1c decrease, it is widely known that any hypoglycemic drug, included the therapeutic class of GLP-1 RAs, is more effective the greater the starting HbA1c value; by contrast, the proportion of patients who achieve the goal of HbA1c <7% is lower the greater the initial HbA1c value.12 Greater hypoglycemic efficacy has also been reported in patients with greater body weight decrease, with a correlation coefficient of 0.158 between change in weight and change in HbA1c.13 In our patients, both baseline HbA1c and change in the BMI were independent predictors of response, and the correlation with change in the BMI (r=0.28) was higher than in the previous study.13
A potential factor modulating the response which has not been considered in the reviewed literature is the presence of non-alcoholic fatty liver disease. In the pathophysiology of T2DM, a positive calorie balance and concomitant portal hyperinsulinemia promote hepatic lipogenesis; triglycerides formed are exported in VLDL or accumulate in the liver, with the occurrence of NAFLD, which is associated with increased insulin resistance in the liver.14 The fat content in the liver may be measured with a degree of accuracy approaching 100% using magnetic resonance spectroscopy,15 but because of its high cost, ALT is used as a useful marker with 45% sensitivity and 85% specificity.7 The diagnostic sensitivity of ALT could be increased by decreasing its normal levels, because they were obtained in populations where infection by the hepatitis C virus or NAFLD was not ruled out.16 The role of ultrasonography is controversial because of its low sensitivity.17
GLP-1 RAs can improve NAFLD. In a meta-analysis of LEAD studies, liraglutide decreased ALT levels by 8.20U/L in patients with baseline levels higher than 30U/L in males and 19U/L in females, but the effect partly depended on weight reduction.18 Although weight decrease undoubtedly contributes to improve NAFLD,7 GLP-1 RAs may also have direct effects on the liver, decreasing de novo lipogenesis and promoting fatty acid oxidation; the molecular mechanisms involved include the stimulation of PPARα receptors and the activation of AMP-activated protein kinase.6,19 Since a significant correlation (r=0.27) was recently reported between HbA1c values and fat content in the liver, as measured by magnetic resonance,20 it is biologically plausible that the resolution of NAFLD may be associated with improved metabolic control.
Our study showed that ALT levels decreased by 9.2U/L in patients with baseline values above the median, and also a significant relationship between decreases in ALT levels and HbA1c. This effect was independent of weight loss. BMI decrease also independently contributed to metabolic control improvement. Even more interesting was the finding that baseline ALT levels >24U/L were associated with a clinically relevant and statistically significant improvement in metabolic response, with an additional HbA1c response close to 0.8%. These facts may suggest a greater clinical benefit of GLP-1 RAs in patients with T2DM and associated NAFLD.
The limitations of this study included an inadequate number of patients for performing separate analyses by sex or GLP-1 RA. This would have been of interest because it is possible that not all GLP-1 RAs have the same efficacy on hepatic receptors.21 The findings made should be considered hypothesis generators, rather than confirmatory. We had no morphological tests quantifying fat content in the liver, and therefore used ALT levels. However, the established cut-off point of 24U/L (median of the distribution) agrees with the upper normal limit reported in patients with DM in whom NAFLD was ruled out using magnetic resonance.20 Finally, no data were available regarding the exact alcohol intake of patients, but patients with known liver disease were excluded.
In conclusion, we think that the hypoglycaemic efficacy of GLP-1 RAs could be related to decreased levels of transaminases (a marker of liver fat). Efficacy is greater in patients with higher baseline levels of the enzyme. Further evaluation is needed of the role of NAFLD as a predictor of the metabolic response to treatment with GLP-1 RAs.
AuthorshipAll authors contributed to: (a) the study design or data collection and analysis; (b) the draft manuscript, and (c) final approval of the submitted version.
Conflict of interestThe authors state that they have no conflicts of interest.
| Javier | Acha Pérez |
| Esperanza | Aguillo Gutiérrez |
| Bárbara | Alastruey Ribas |
| Ramón | Albero Gamboa |
| Orosia | Bandrés Nivela |
| Agustín | Barra Morato |
| Amaya | Barragán Angulo |
| Rafael | Barril Vicente |
| Yolanda | Blasco Lamarca |
| Vicente | Blay Cortes |
| Mª Pilar | Bocos Terraz |
| Fernando | Calvo Gracia |
| Alejandro | Cámara Balda |
| Jose Antonio | Chena Alejandro |
| Santiago | Chóliz Polo |
| Luis | Ciprés Casasnovas |
| Paloma | de Castro Hernández |
| Vicente | Estopiñán Garcia |
| Eduardo | Faure Nogueras |
| Blanca | Garcia Garcia |
| Jose Antonio | Gimeno Orna |
| Paola | Gracia Gimeno |
| Maria Luisa | Gracia Ruiz |
| Jose Ignacio | Lbarta Aizpún |
| Francisca | Lázaro Puente |
| Andrés | López Gómez |
| Carmen | Marcuello Melendo |
| Esteban | Mayayo Dehesa |
| Marta | Monreal Villanueva |
| Carmen | Morera Fernández-Sanguino |
| Angel L | Navarro Izquierdo |
| Julia | Ocón Bretón |
| Pablo | Ortiz Remacha |
| Joaquín | Palacios Latasa |
| Mª Jose | Pamplona Civera |
| Angeles | Pie Juste |
| Jesús | Playan Usón |
| Antonio | Portolés Suso |
| Jose Joaquín | Resa Bienzobas |
| Mercedes | Rodriguez Rigual |
| Mª Antonia | Sancho Serrano |
| Alejandro | Sanz París |
| Amalia | Sobrino vesperinas |
| Pablo | Trincado Aznar |
| Concha | Vidal Peracho |
| Diego | Alvarez Ballano |
| Diana | Boj Carceller |
| Guayente | Verdes Sanz |
| Mª Eugenia | López Valverde |
| Conchita | Zapata |
| Patricia | de Diego |
| Ana | Ilundain Gonzalez |
| Irene Mª | Burgasé Estallo |
| Jara | Altemir Trallero |
| Ana Belen | Mañas Martinez |
| Ana Lidia | Medrano Serrano |
| Francisco | Los Fablos Callao |
| Laura | Borau Maorad |
| Julia | Campos Fernandez |
| Alicia | Justel Enriquez |
| Carmen | Cabrejas Gomez |
| Isabel | Melchor |
| Beatriz | Lardies Sanchez |
| Leticia | Perez Fernandez |
| Luis | Irigoyen Cucalon |
| Ana | Agudo Tabuenca |
Members of the Aragonese Society of Endocrinology and Nutrition (SADEN) appear in Appendix.
Please cite this article as: Gimeno-Orna JA, Verdes-Sanz G, Borau-Maorad L, Campos-Fernández J, Lardiés-Sánchez B, Monreal-Villanueva M, en representación de la Sociedad Aragonesa de Endocrinología y Nutrición (SADEN). Niveles de ALT y respuesta hipoglucemiante al tratamiento con agonistas del receptor de GLP-1. Endocrinol Nutr. 2016;63:164–170.
