


Nutritional status is a prognostic factor in cystic fibrosis. Prevention of nutritional impairment and weigh loss are major clinical objectives because they are associated with worsening of lung function and increased mortality.
ObjectiveTo identify a potential relationship of clinical nutrition parameters, and their relative changes, with lung function (FEV1%) in a cohort of adolescent and adult patients with CF.
MethodsA retrospective analysis of 64 patients older than 14 years. Weight, height, BMI, and lung function data were collected at a period of disease stability, both in the year of the first abnormal oral glucose tolerance test (OGTT) and in the previous year. Relative changes in weight and BMI, and their relationship with FEV1%, were determined by linear regression and ANOVA tests; influence of gender and diabetes was also assessed.
ResultsMean age of the series (28 females and 36 males) was 26.8 years. Normal glucose tolerance (NGT) was found in 26.7%, while 18.3% had diabetes without impaired fasting glucose (CFRD without FPG). Mean BMI was 20.32, with a mean weight of 53.53kg; 32.8% had BMI<18.5, and only 4.7% were overweight. Overall, a positive relative change in weight (≥6%) was associated with an increase in FEV1% (9.31%), as compared to those with a greater weight loss (at least 2%), who had a 12.09% fall in FEV1. Patients with CFRD without FPG had poorer lung function if they had a negative relative change in weight by at least 2% as compared to NGT.
ConclusionsIn patients with CF, a relative weight gain is positively associated to FEV1%, while a relative weight loss of at least 2% has a significant negative impact on lung function.
El estado nutricional es un indicador pronóstico en la fibrosis quística (CF). La prevención del deterioro nutricional y de la pérdida de peso son objetivos clínicos principales, ya que están asociados con empeoramiento de la función pulmonar y aumento de la mortalidad.
ObjetivoIdentificar si existe una relación entre los parámetros clínicos de nutrición, y sus cambios relativos, con la función pulmonar (FEV1%) en una cohorte de pacientes adolescentes y adultos con CF.
MétodosAnalizamos de forma retrospectiva una serie de 64 pacientes mayores de 14años. Se recogieron datos del peso, talla e IMC, suplementos nutricionales, y la función pulmonar en fase de estabilidad tanto en el año de realización del primer test de sobrecarga oral de glucosa (OGTT) patológico como en el año previo. Se determinaron los cambios relativos de peso e IMC, y su relación con FEV1%, mediante regresión lineal y ANOVA, así como la influencia del género y la diabetes.
ResultadosLa media de edad de la serie fue de 26,8años (28 mujeres y 36 varones). El 26,7% tenían una tolerancia normal a la glucosa (TGN) y el 18,3% tenían diabetes sin alteración de la glucosa en ayunas (CFRD sin FPG). La media del IMC fue de 20,32, con un peso medio de 53,53kg. El 32,8% tenían un IMC<18,5 y tan solo el 4,7% presentaban sobrepeso. De forma global, un cambio relativo de peso positivo (≥6%) se asociaba con un incremento del FEV1% (9,31%) respecto a los que presentaban una mayor pérdida de peso, de al menos un 2%, los cuales tenían una caída del FEV1 del 12,09%. Los pacientes con CFRD sin FPG presentaban peor función pulmonar si mostraban una pérdida relativa de peso superior al 2%, en comparación con TGN.
ConclusionesEn los pacientes con CF, la ganancia relativa de peso tiene una asociación positiva con el FEV1%, mientras que una pérdida ≥2% tiene una repercusión significativa negativa en la función pulmonar.
Cystic fibrosis (CF) increases energy expenditure, so that resting expenditure increases up to 35%. As a result, sufferers have a predisposition to malnutrition, with an increase in catabolism related to impairments in both lung function (recurrent infections, bacterial colonization, etc.) and metabolism (exocrine pancreatic insufficiency, altered carbohydrate metabolism).1
Weight has been identified as a prognostic marker, and weight loss prevention is one of the goals of CF treatment.2 Longitudinal studies in adults with CF, such as the one conducted on the Toronto cohort, also suggest that patients with a lower body mass index (BMI) have poorer lung function and a higher percentage of pancreatic insufficiency as compared to patients with overweight and obesity.3
In addition, a low weight gain is associated with impaired lung function and earlier mortality. The degree of carbohydrate intolerance and insulin deficiency are also related to declining lung function, so that patients with CF and cystic fibrosis-related diabetes (CFRD) are at greater risk of malnutrition and lung dysfunction.4
Lung disease is the main mortality predictor in these patients, and the annual rate of decline in the percentage of the predicted forced expiratory volume in one second (FEV1%) is the most important predictor variable.5 Children with CF who gain weight at an adequate rate may have a better FEV1%. Thus, nutritional support to improve growth may contribute to an adequate lung function.6 In this regard, the strength of the diaphragm and respiratory muscles has been related to nutritional status, so that malnutrition may precede the occurrence of impaired lung function as detected by conventional tests.5,7,8
Therefore, the primary objective of this study was to ascertain whether or not a relationship existed between relative changes in clinical nutritional parameters (weight, BMI) and lung function (FEV1%) in a cohort of adolescent and adult patients with CF. The secondary objective was to analyze the potential influence of gender and CFRD on this potential relationship between lung function and the defined nutritional parameters.
Subjects and methodsSubjectsData in this series were collected as part of the monitoring variables at the Multidisciplinary Cystic Fibrosis Unit of Ramón y Cajal University Hospital during 2011 and 2012. Patients were diagnosed with CF according to the criteria of Rosenstein and Cutting (1998) and the European Cystic Fibrosis Society. The inclusion criteria were as follows: a diagnosis of CF, an age of 14 years or over, and annual screening for diabetes using an oral glucose tolerance test (OGTT). The exclusion criteria were age under 14 years, incomplete OGTT data, an absence of lung function records and concurrent nutritional parameters, pregnancy, HIV, HCV and/or HBV infection, and organ transplantation at the time of or before the study was conducted. The categories of carbohydrate changes used were as defined by the North American CF Consensus Conference (2010) and the American Diabetes Association (ADA),9 and respiratory tests were performed as described in previous reports.10
The year where OGTT showed some change in carbohydrate metabolism (or the last OGTT was recorded) was taken as reference for variable collection. All subjects had their weight (kg), height (m), and body mass index (BMI; kg/m2) measured (using the references proposed by the World Health Organization [WHO]), and lung function data obtained by spirometry during a stable phase according to standard procedures at our center were recorded. The same measurements had been performed one year before as part of the routine monitoring of the patients.
Statistical analysisNormal variable distribution was verified using a Kolmogorov-Smirnov test. Qualitative variables were expressed as frequencies, and continuous variables were given as mean and standard deviation (SD) or as median and interquartile range (IQR, Ip25–p75) as appropriate.Relative changes (Δ) in weight and BMI were calculated using the following formula:

These relative increases (weight, BMI) were then converted into standard units (z-score), i.e. percent relative changes obtained with the above formula were standardized. Using the variables thus obtained, a hierarchical clustering procedure was performed according to the Ward or minimal variance method, adjusting outliers for ±2 SD. Z-score groups were thus defined based on the following parameters: ≤−0.5 SD (group 1, loss greater than 2%), between −0.5 and +0.5 SD (group 2, between −0.5% loss and +4.7% gain), and ≥+0.5 SD (group 3, gain greater than 6%).
Groups thus defined for Δweight and ΔBMI were compared with lung function (FEV1%/mL) in the year of the pathological OGTT, along with the influence of gender and the presence of diabetes (CFRD) or normal glucose tolerance (NGT). An ANOVA test (univariate and multiple as appropriate) was used for this comparison, and Student–Newman–Keuls and Bonferroni tests were used to calculate the percent change in each group. Percent loss or gain in lung function in each z-score group was expressed taking as reference mean FEV1 (% and mL), according to the indicated tests.
To compare relative changes in nominal variables, a Student's t test and a Pearson's Chi-square test were used as appropriate.
A general multiple linear regression model with a backward strategy was also performed between FEV1% and nutritional status (Δweight, ΔBMI), with adjustments being made for gender (female, male) and nutritional and vitamin supplements. Adjustments were made for outliers, again taking as reference outliers with±2 SD.
A value of p<0.05 (two-sided) was considered significant in all tests. Statistical analyses were done using SPSS version 18.0 (Chicago, IL, USA) and MedCalc Statistical Software version 13.1.2 (MedCalc Software bvba, Ostende, Belgium; http://www.medcalc.org; 2014).
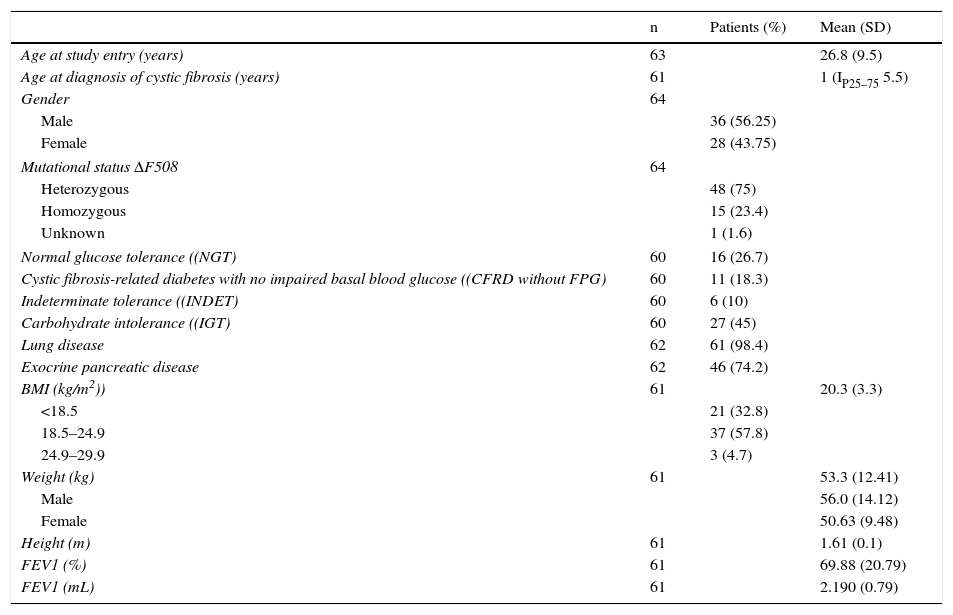
ResultsGeneral characteristicsTable 1 summarizes the general cohort characteristics and the main variables analyzed.
Clinical, genetic, and lung function characteristics of patients undergoing oral glucose tolerance tests.
| n | Patients (%) | Mean (SD) | |
|---|---|---|---|
| Age at study entry (years) | 63 | 26.8 (9.5) | |
| Age at diagnosis of cystic fibrosis (years) | 61 | 1 (IP25–75 5.5) | |
| Gender | 64 | ||
| Male | 36 (56.25) | ||
| Female | 28 (43.75) | ||
| Mutational status ΔF508 | 64 | ||
| Heterozygous | 48 (75) | ||
| Homozygous | 15 (23.4) | ||
| Unknown | 1 (1.6) | ||
| Normal glucose tolerance ((NGT) | 60 | 16 (26.7) | |
| Cystic fibrosis-related diabetes with no impaired basal blood glucose ((CFRD without FPG) | 60 | 11 (18.3) | |
| Indeterminate tolerance ((INDET) | 60 | 6 (10) | |
| Carbohydrate intolerance ((IGT) | 60 | 27 (45) | |
| Lung disease | 62 | 61 (98.4) | |
| Exocrine pancreatic disease | 62 | 46 (74.2) | |
| BMI (kg/m2)) | 61 | 20.3 (3.3) | |
| <18.5 | 21 (32.8) | ||
| 18.5–24.9 | 37 (57.8) | ||
| 24.9–29.9 | 3 (4.7) | ||
| Weight (kg) | 61 | 53.3 (12.41) | |
| Male | 56.0 (14.12) | ||
| Female | 50.63 (9.48) | ||
| Height (m) | 61 | 1.61 (0.1) | |
| FEV1 (%) | 61 | 69.88 (20.79) | |
| FEV1 (mL) | 61 | 2.190 (0.79) | |
At study entry, mean patient age was 26.84 years (SD 9.46), and mean time since CF onset was 20.43 years. Seventeen patients had ages ranging from 14 to 20years.
The BMI was 20.24 (3.17) in males and 20.41 (3.44) in females (p=NS). It was less than 18.5 in 32.8% (n=21) of patients, with no significant difference by gender (data not shown), and only 4.7% were overweight according to the WHO.
At the time of the pathological test result, 90.3% of the subjects were taking vitamin supplements, and 17.7% nutritional supplements.
As regards lung function, the mean FEV1% of the group was 69.88% (20.79). No differences were seen between the BMI and FEV1% categories (low weight, FEV1% 66.43 (21.43); normal weight, FEV1% 71.19 (20.66); overweight, FEV1% 70.33 (9.07); p=0.7). No significant gender differences (data not shown) were seen in the presence of NGT or CFRD with no impaired basal glucose (FPG).
In addition, patients exposed to nutritional supplements had lower weight, BMI, and FEV1% (for the BMI, if exposed, 17.1kg/m2 [1.54] vs no, 21.03kg/m2 [3.12]; t −6.13 [95% CI −5.23 to 2.62]; p<0.001; for weight, if exposed, 42.68kg [7.06] vs no, 55.92kg [12.09]; t −3.49 [95% CI −20.83 to −5.64]; p=0.001; and for FEV1%, if exposed, 55.46% [17.52] vs no, 72.6% [19.85]; t −2.64 [95% CI −30.12 to −4.172]; p=0.01).
To estimate the influence of nutritional parameters on FEV1%, the variables that remained significant in the multiple linear regression model were Δweight (β0.88 [95% CI 0.13–1.62]; p=0.023) and exposure to nutritional supplements (β13.72 [95% CI −27.38 to −0.06]; p=0.049); overall adjusted R2 of the model, 0.15.
Lung function, relative changes in weight and body mass index, and genderMean FEV1% was higher in males (72.79 [20.52]) than in females (65.64 [19.97]), but the difference was not statistically significant (t 1.37 [95% CI −3.28 to 17.57]; p=0.18). By contrast, significant differences favoring males were found in Δweight (males +4.86% [6.58] vs females +0.58% [6.78], t 2.43 [95% CI 0.75–7.79]; p=0.018). These results were not reflected in ΔBMI (males +1.82% [5.83] vs +0.05% [5.87]; t 1.15 [95% CI −1.31 to 4.85], p=0.26).
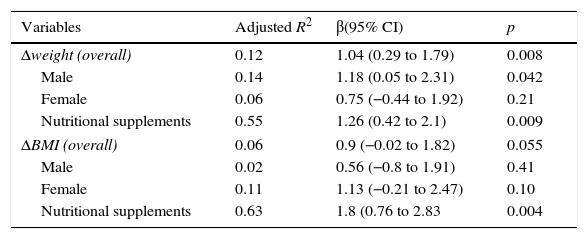
Lung function (FEV1%) by Δweight and ΔBMIA comparison of Δweight and lung function (FEV1%) found that a weight gain (or positive Δweight) was related to a higher percent FEV1, particularly in males (overall: adjusted R2 0.12, β 1.04 [95% CI 0.29–1.79]; p=0.008) (Fig. 1A and B, Table 2).
 in the year of diagnosis of impaired carbohydrate metabolism and relative change in weight (A) and body mass index (B).")
Linear relationship of weight and BMI (kg/m2) increase by gender and nutritional supplements with lung function (FEV1%).
| Variables | Adjusted R2 | β(95% CI) | p |
|---|---|---|---|
| Δweight (overall) | 0.12 | 1.04 (0.29 to 1.79) | 0.008 |
| Male | 0.14 | 1.18 (0.05 to 2.31) | 0.042 |
| Female | 0.06 | 0.75 (−0.44 to 1.92) | 0.21 |
| Nutritional supplements | 0.55 | 1.26 (0.42 to 2.1) | 0.009 |
| ΔBMI (overall) | 0.06 | 0.9 (−0.02 to 1.82) | 0.055 |
| Male | 0.02 | 0.56 (−0.8 to 1.91) | 0.41 |
| Female | 0.11 | 1.13 (−0.21 to 2.47) | 0.10 |
| Nutritional supplements | 0.63 | 1.8 (0.76 to 2.83 | 0.004 |
If patients were exposed to nutritional supplements, the influence of Δweight on FEV1% increased (adjusted R2 0.55, β 1.26 [95% CI 0.42–2.1]; p=0.009), and the same occurred with ΔBMI (adjusted R2 0.63, β 1.8 [95% CI 0.76–2.83]; p=0.004).
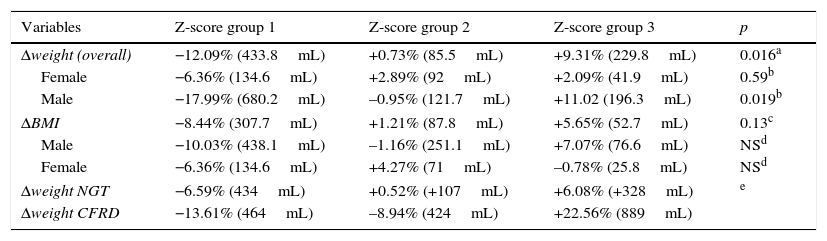
In the case of Δweight according to the z-score (Fig. 2A), group 1 had a FEV1 in the year of diagnosis of −12.09% (compared to the mean value of the series), while FEV1 values in group 2 were +0.73%. In group 3 of the z-score, FEV1 was +9.31% (FEV1%, overall p=0.016). After adjusting these data for gender, the differences were not significant in females (Table 3).
 and body mass index (B) and lung function (FEV1%) in the year of the study.")
Relative changes in weight (kg) and BMI (kg/m2) increase by gender in relation to lung function as compared to its mean in the year impairment was diagnosed (FEV1%/mL).
| Variables | Z-score group 1 | Z-score group 2 | Z-score group 3 | p |
|---|---|---|---|---|
| Δweight (overall) | −12.09% (433.8mL) | +0.73% (85.5mL) | +9.31% (229.8mL) | 0.016a |
| Female | −6.36% (134.6mL) | +2.89% (92mL) | +2.09% (41.9mL) | 0.59b |
| Male | −17.99% (680.2mL) | –0.95% (121.7mL) | +11.02 (196.3mL) | 0.019b |
| ΔBMI | −8.44% (307.7mL) | +1.21% (87.8mL) | +5.65% (52.7mL) | 0.13c |
| Male | −10.03% (438.1mL) | –1.16% (251.1mL) | +7.07% (76.6mL) | NSd |
| Female | −6.36% (134.6mL) | +4.27% (71mL) | –0.78% (25.8mL) | NSd |
| Δweight NGT | −6.59% (434mL) | +0.52% (+107mL) | +6.08% (+328mL) | e |
| Δweight CFRD | −13.61% (464mL) | –8.94% (424mL) | +22.56% (889mL) | |
FEV1%: overall p=0.016; group 1 vs 3, p=0.013; groups 1 vs 2 p=0.15 and 2 vs 3, p=0.51. For FEV1(mL): overall p=0.051, group 1 vs 3, p=0.06; p=NS for all other comparisons between the groups.
Male: FEV1%: overall p=0.019; group 1 vs 3, p=0.016; groups 1 vs 2 p=0.23 and 2 vs 3, p=0.38. For FEV1(mL): overall p=0.078. Female: FEV1%: overall p=0.59, and FEV1(mL): overall p=0.7. p=NS for all categories and in comparisons between the groups.
FEV1%: overall p=0.13; for FEV1(mL): overall p=0.19. p=NS for all categories and in comparisons between the groups.
In the analysis of ΔBMI, according to the z-score (Fig. 2B), group 1 patients had a FEV1 decrease of −8.44% (from the mean value of the series), group 2 patients had a FEV1 increase of +1.21%, and group 3 patients had a FEV1 increase of +5.65% (FEV1%, p=0.13). No significant differences were seen after these data were adjusted for gender (Table 3).
Influence of NGT and CFRD without FPGIn patients with CFRD without FPG, a positive relation was found when Δweight and lung function (FEV1%) were compared, that is, a gain (or positive Δweight) was associated with higher FEV1% (overall: corrected R2 0.58, β 2.2 [95% CI 0.83 to 3.57]; p=0.006). This linear relationship was not found in the group with NGT, however (overall: corrected R2 −0.41, β −0.44 [95% CI −1.85 to 0.97]; p=0.51).
In addition, there was initially a significant mean difference in lung function between both groups (for FEV1, NGT 71.59% vs CFRD 53.94% [95%CI 42.89 to 65.00], difference ±17.65 [95% CI 2.52–32.78], p=0.025). Thus, in the analysis of Δweight by z-score group and FEV1%, differences for NGT versus CFRD in each group of Δweight were: group 1, +24.67% (p=0.091); group 2, +27.11% (p=0.035), and group 3, +1.17% (p=0.92) (in favor of NGT and it being the reference category, Table 3, Fig. 3).
 or cystic fibrosis-related diabetes with no impaired basal blood glucose (CFRD without FPG) and lung function (FEV1%) in the year of diagnosis of impaired glucose metabolism.")
Differences in z-score groups of relative change in weight depending on whether they had normal glucose tolerance (NGT) or cystic fibrosis-related diabetes with no impaired basal blood glucose (CFRD without FPG) and lung function (FEV1%) in the year of diagnosis of impaired glucose metabolism.
Low weight and undernutrition are associated with poorer lung function regardless of age, genotype, gender, pancreatic status, and the presence of CFRD. Analysis of data from the European Cystic Fibrosis Society (ECFS) registry showed that patients within normal limits (±2 SD) have a mean FEV1 21.6% higher than those with a poorer BMI (≤2 SD). In addition, a low BMI was associated with a six times greater chance of having a FEV1<40% than a normal BMI.11
Our study sample, despite being heterogeneous, included 21 patients (32.8%) with malnutrition (BMI<18.5). In the Gozdzik et al. study,12 the prevalence rate of malnutrition was 28.2%, but reached 38% in adults.
In our study, Δweight had a positive linear relationship with higher FEV1%. Thus, the group that gained weight (≥6%) also experienced an increase in FEV1% (9.31%) as compared to patients with greater weight loss (more than 2%), in whom FEV1 dropped by 12.09%. In our series, significance was not maintained after stratification by gender because of the decrease in the number of patients to be analyzed in each category, with a resultant loss of statistical power. The influence of gender on lung function is nonetheless controversial,3,11,13 and improvements in the nutritional and respiratory treatment of patients in recent years are other factors which have probably contributed to a more favorable course.
This relationship between weight and lung function has also been found in longitudinal studies and in populations mostly consisting of children and young adults (including adolescents).5,6,14–16 These results emphasize the importance of changes over time (i.e., longitudinal monitoring): the trend in weight changes is more important than an absolute value at any given time.
Thus, Peterson et al.6 analyzed the effect of weight increase on lung function in 319 children aged 6–8 years for a two-year period and found that a 1kg weight gain was associated with a 32mL increase in FEV1, and an additional kilogram of weight at study start already represented a 55mL difference in mean FEV1. Children with greater weight gains had a monthly FEV1 increase of 3.8mL as compared to children with a lower change in weight.
Steinkamp and Wiedemann14 analyzed nutritional status and lung function (FEV1%) in each age group and found that malnourished adolescents (12–18 years), i.e. those who experienced a decrease in height-related weight greater than 5% for one year, had a theoretical decrease in FEV1 of up to 16.5%, while patients who gained more than 5% of weight had an increase in predicted FEV1 of up to 2.1%. In patients over 18 years with malnutrition, however, the authors reported that annual change in FEV1% increased 1.2% (95% CI 0.1–2.4), although the predicted FEV1 in the year of study start was significantly lower (−23.9%; 95% CI −28.2 to −19.6). It is not clear to which factors (nutritional or vitamin supplements, infection control etc.) this increase in predicted FEV1% should be attributed. In the longitudinal analysis designed in the same article—with two years of follow-up—, the authors found no differences in the change in predicted FEV1% or in the presence of malnutrition or colonization by Pseudomonas aeruginosa in patients over 18 years of age.
Zemel et al.17 studied the relationship between nutritional status and lung function in a series of children from the US CF Patient Registry from 1991 to 1995. Lung function decline during this follow-up period was related to baseline FEV1, with a greater annual decline in patients with baseline FEV1≥90% as compared to those with FEV1<90%. Other variables clearly influencing lung function impairment were weight (the z-score) and growth (adequate height for weight), leading the authors to conclude that early intervention on nutritional status may slow lung function decline in children with CF. Similarly, García Hernández et al.16 reported that patients with more impaired lung function had a poorer nutritional status (as assessed by the z-score of the BMI) and were older. These results could be analyzed from the practical perspective of a greater chance of receiving nutritional treatment in cases with poorer lung function and low weight, as occurred in our series.
In our cohort, when ΔBMI was compared to FEV1%, a positive relative increase in ΔBMI was found to be borderline significant for FEV1% improvement, although comparison by groups according to the z-score did not reach statistical significance. In this regard, Stephenson et al.3 suggest that although an improved nutritional status is associated with lung function improvement, this improvement is less marked with a BMI within the normal range or in the overweight category. Their longitudinal study analyzed a cohort of 908 adults with CF between 1985 and 2011 using a multivariate model. According to their results, in the group of low weight subjects (BMI<18.5), a 10% increase in the BMI resulted in a relative 4% increase in FEV1, while in subjects with a BMI within the normal range (18.5–24.9), an increase in the BMI resulted in a relative 5% increase in FEV1; finally, in the overweight group (25–29.9) this increase involved a FEV1 increase of 2% only, with no significant differences between males and females. The authors stated that patients with higher BMI values had milder forms of CF as assessed by lung function, pancreatic insufficiency, and genotype.3 A possible explanation of these findings comes from the study conducted by Kastner-Cole et al.,18 who established in adult patients with CF an upper cut-off value of the BMI of 23 from which no significant lung function improvement was found.
An additional piece of data of interest in our series was the finding of a greater negative impact of Δweight on FEV1% in patients with CFRD without FPG as compared to those with NGT. Overall, patients with CFRD have poorer lung function. Milla et al.4 found that patients with NGT had no significant change in FEV1% in a longitudinal follow-up, while those with CFRD lost 2.44% annually.
When interpreting our results, it should not be forgotten that our study sample was small and heterogeneous (adolescents and adults). An additional reason for the lack of other significant results is that the BMI may be less accurate than other variables in identifying malnutrition. In this regard, the study of body composition in CF could theoretically better predict prognosis and could identify more precisely malnutrition states, particularly in small patient cohorts. Engelen et al.19 found that up to 14% of children with CF showed a depletion of fat-free mass in dual energy X-ray absorptiometry (DXA), and this depletion was associated with an adequate BMI (25th-50th percentiles) in up to 50% of them. Thus, if the BMI was used as the only nutritional parameter, a substantial proportion of patients with impaired nutritional status would be left undiagnosed.19–22 King et al.21 found a 14% prevalence of low fat-free body mass in a cohort of 86 adults with CF, and reported that the sensitivity of the BMI for detecting this change was only 42%. The multivariate analysis conducted found that low FEV1% levels were independently associated with low fat-free body mass, and the authors suggested that this body composition parameter could be useful as a prognostic marker.
It should also be noted that a small series may lead to wide variable intervals, and so result in apparently greater expected changes, a statistical effect directly related to its power. On the other hand, some R2 variation data are lower than 0.3 and thus, as already noted, related to the effects of low power (although with no colinearity phenomena or marked changes in the Durbin-Watson statistic).
ConclusionsOverall, gender did not appear to influence lung function (FEV1%) in our cohort of adolescents and adults. A relative change in weight was more important.
Relative change in BMI was not significantly associated with FEV1%, and body composition analysis could, therefore, be a more accurate predictor of lung function in CF.
A relative weight gain (greater than 6%) had a positive impact on lung function estimated by FEV1%. By contrast, relative weight loss (2% or greater) had a negative influence on lung function in patients with CF, including those with CFRD. Moreover, for a same group of z-score, FEV1% decrease was deeper in diabetic patients than in those who had no impaired carbohydrate metabolism Measures aimed at early intervention on nutritional status and the control of impaired carbohydrate metabolism could therefore contribute to slowing down the decline in lung function.
FundingNo specific grant has been received for this research from any funding body in the public, commercial, or charity sectors.
Conflicts of interestThe authors state that they have no conflicts of interest that may be perceived as detrimental to the impartiality of the research published.
Please cite this article as: Cano Megías M, Guisado Vasco P, González Albarrán O, Lamas Ferreiro A, Máiz Carro L. Asociación entre el cambio relativo de peso e índice de masa corporal con la función pulmonar en adolescentes y adultos con fibrosis quística: influencia del género y la diabetes. Endocrinol Nutr. 2015;62:422–429.
