


To estimate the prevalence of insulin resistance using both the Homeostatic Model Assessment (HOMA) index and basal insulinemia, and to analyze its relationship to overweight, as measured by body mass index (BMI) and waist circumference (WC).
Patients and methodsA series of 118 non-diabetic young adults aged 18 and 19years attending a primary care health center were studied. They were contacted by telephone, and their BMI, WC, HOMA and basal insulinemia were measured, among other parameters.
ResultsHOMA values ≥P90 (HOMA ≥3.15) were found in 9.3% of the sample (50% in the obesity group). Insulinemia ≥P90 (16.9) was found in 11%. Based on BMI, 17.8% were overweight (26.5% of men, 11.6% of women), and 6.8% were obese (6.1% of men, 7.2% of women). Based on WC, 5.71% were obese when waist was measured at the midpoint and 15.38%, when measured at the iliac crest. HOMA was found to be significantly correlated to weight increase, BMI, WC, systolic blood pressure, triglycerides, and blood glucose, while correlation was only found between insulinemia and increased WC and decreased high lipoprotein cholesterol (HDL) levels.
ConclusionIn this young adult sample, increased BMI and WC were associated to increased insulin resistance. High HOMA values were found in 9.3% of subjects.
Calcular la prevalencia de la resistencia a la insulina mediante índice HOMA (homeostatic model assessment) e insulinemia basal, y estudiar su asociación con estados de sobrepeso según índice de masa corporal (IMC) y perímetro de cintura (PC) en población adulta joven de un centro de salud.
Pacientes y métodosSe estudió una serie de 118 jóvenes de 18 y 19 años, no diabéticos, pertenecientes a un centro de salud de atención primaria, con los que se contactó telefónicamente y en los que se determinaron el IMC, PC, HOMA e insulinemia entre otros parámetros.
ResultadosUn 9,3% de la muestra presentaba cifras de HOMA ≥ al P90 (HOMA ≥ 3,15), 50% en el grupo de obesidad. Un 11% presentaron cifras de insulinemia ≥ al P90 (16,9). Según IMC, presentan sobrepeso un 17,8% (26,5% hombres y 11,6% mujeres) y obesidad un 6,8% (6,1% hombres y 7,2% de mujeres). Las cifras de obesidad según PC fueron de 5,71% si se consideraba cintura a nivel de punto medio y 15,38% si se consideraba a nivel de cresta ilíaca. Existía una correlación significativa del HOMA con aumento de peso, IMC, PC, tensión arterial sistólica, triglicéridos y glucemia, mientras que sólo la había entre insulinemia y aumento de PC y disminución de cifras de fracción de colesterol unido a proteínas de alta densidad (HDL).
ConclusiónEn estaserie de jóvenes adultos, el aumento de IMC y de PC se asocia con aumento de la resistencia a insulina. La frecuencia de HOMA elevado en personas obesas fue del 50%.
Type 2 diabetes mellitus is one of the most common diagnoses worldwide, and the World Health Organization (WHO) predicts an increased mortality from this disease in the coming years.1 One of the pathogenetic defects in type 2 diabetes is the inability of the body to effectively use insulin, often as the result of excess weight or physical inactivity. The increased prevalence of diabetes is probably related to obesity, another significant current health problem.2 This situation not only affects adults, but also obese children and adolescents, so that 25–45% of them3,4 have a decreased glucose tolerance and, according to the American Diabetes Association (ADA) data, from 8% to 45% of US children diagnosed with diabetes have non-autoimmune diabetes.5
Even in the absence of hyperglycemia, there are insulin resistance (IR) states defined by a decreased capacity of insulin to exert its biological actions in typical target tissues such as skeletal muscle, liver, or adipose tissue.6 Different methods are used to detect IR. The gold standard test is hyperinsulinemic euglycemic clamp, which is impractical for use in daily clinical practice and is reserved for research studies. Measurement of fasting insulin and glucose levels and use of the HOMA index (homeostatic model assessment=plasma insulin (μU/mL)×blood glucose (mmol/L)/22.5) may be simpler and more useful procedures because they require a single blood sample.
Recently reported studies show that altered HOMA values persist into adult age and predict for evolution to prediabetes and type 2 diabetes.7 In the general adult population, increased IR is significantly associated with the occurrence of cardiovascular, coronary, and cerebrovascular events independently of other cardiovascular risk factors.8–10 It has a prognostic value in the prevention of acute coronary syndrome,11 and in non-diabetic subjects with body mass index (BMI) <25 it is associated with mortality from all causes except cancer.12
As regards the values of the parameters that could be considered to indicate IR, different authors have proposed various cut-off points. It should also be noted that values change with age, sex, race, pubertal states, fat distribution, etc.13
The objective of this study was to investigate IR prevalence in a sample of non-diabetic young adults by measuring basal insulinemia and the HOMA index, and to study its relationship to weight status based on BMI and waist circumference (WC). It should be emphasized that data are provided for an age group for which few data are available in the literature.
Patients and methodsAn observational, cross-sectional study was conducted on a cohort of 277 subjects born in 1989 who attended the Cuzco Health Center in Fuenlabrada, Madrid (Spain). Pregnancy and uncontrolled hypothyroidism at the time of the study were considered exclusion criteria. Eating behavior disorders were assessed in each individual patient.
Among the initial cohort of 277 subjects selected as the study population, 154 could not be contacted or declined to participate in the study, and 5 were excluded, 3 for pregnancy and one each for eating behavior disorder and hypothyroidism. The final sample consisted of 118 subjects.
The variables recorded included age, sex, weight, and height, measured with a SECA scale with incorporated stadiometer; and BMI (weight/height2) and WC measured at two anatomical points, iliac crests ICWC and midpoint between the last rib and iliac crest (MWC), measured in centimeters standing and with feet together and arms along the body. Obesity was defined as a BMI of 30 or higher, and overweight as a BMI of 25 or higher and less than 30. Patients were divided into three groups based on WC: a group with WC less than 94cm in males and less than 80cm in females, a second group with WC ≥94cm and <102cm in males and WC PC ≥80cm and <88cm in females, and a third group with WC ≥102cm in males and ≥88cm in females. To assess IR, insulin and the HOMA index were measured in a single test, and values equal to or higher than the 90th percentile (P90) of values in the series were considered high. Other variables tested included blood pressure in mmHg, measured with a certified sphygmomanometer under the conditions required by the adult program of area 9 of the Madrid health service, blood glucose, triglyceride, total and high density lipoprotein (HDL), and thyroid-stimulating hormone (TSH) levels. Diabetes was defined as a random glucose level of 200mg/dL or higher with additional symptoms, or two fasting blood glucose levels of 126mg/dL or higher in two readings on different days. Blood glucose levels ranging from 100 to 125mg/dL were classified as a glucose intolerance disorder. High blood pressure was defined as values of 140/90mmHg or higher; hypercholesterolemia as cholesterol levels higher than 250mg/dL, and borderline levels as the range from 200 to 250mg/dL; hypertriglyceridemia as levels of 150mg/dL or higher; and low HDL as values less than 40mg/dL in males and 50mg/dL in females. Anthropometric and biochemical variables were collected at the healthcare center by members of the research staff. Blood samples were drawn after fasting for 12h, and samples were tested at the reference laboratory of Hospital Severo Ochoa.
All the participants were asked about drug intake, and none was taking any medication that could have affected the metabolic parameters.
The patients were contacted by phone, were provided written information, and were required to sign an informed consent for study inclusion. The project was approved and authorized by the research committee and ethics committee of area 9 of the Madrid health service. The study was conducted during 2008.
SPSS 15.0 statistical software was used for statistical analysis. Descriptive statistics were performed on all data using standard central and dispersion measures with a 95% confidence interval. Statistical tests included a means difference test (Student's t test) and a one-way ANOVA test for variables with more than two categories. The correlation between two variables was studied using a Pearson's test (bivariate Pearson's correlations).
ResultsOne hundred and eighteen subjects, 49 males and 69 females, formed the final sample. All the subjects had reached 18years of age at the time of the study, and some were 19years old.
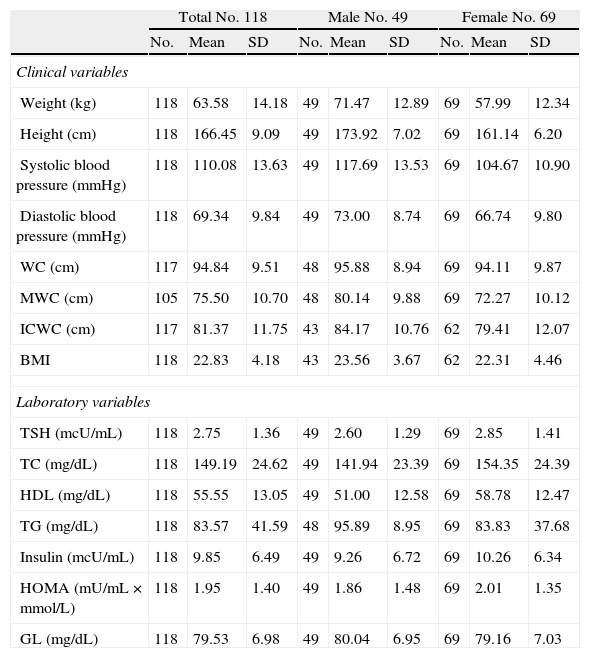
Table 1 shows the mean values (and standard deviation) for all anthropometric and laboratory variables for the whole sample and by sex.
Descriptive statistics of study variables.
| Total No. 118 | Male No. 49 | Female No. 69 | |||||||
| No. | Mean | SD | No. | Mean | SD | No. | Mean | SD | |
| Clinical variables | |||||||||
| Weight (kg) | 118 | 63.58 | 14.18 | 49 | 71.47 | 12.89 | 69 | 57.99 | 12.34 |
| Height (cm) | 118 | 166.45 | 9.09 | 49 | 173.92 | 7.02 | 69 | 161.14 | 6.20 |
| Systolic blood pressure (mmHg) | 118 | 110.08 | 13.63 | 49 | 117.69 | 13.53 | 69 | 104.67 | 10.90 |
| Diastolic blood pressure (mmHg) | 118 | 69.34 | 9.84 | 49 | 73.00 | 8.74 | 69 | 66.74 | 9.80 |
| WC (cm) | 117 | 94.84 | 9.51 | 48 | 95.88 | 8.94 | 69 | 94.11 | 9.87 |
| MWC (cm) | 105 | 75.50 | 10.70 | 48 | 80.14 | 9.88 | 69 | 72.27 | 10.12 |
| ICWC (cm) | 117 | 81.37 | 11.75 | 43 | 84.17 | 10.76 | 62 | 79.41 | 12.07 |
| BMI | 118 | 22.83 | 4.18 | 43 | 23.56 | 3.67 | 62 | 22.31 | 4.46 |
| Laboratory variables | |||||||||
| TSH (mcU/mL) | 118 | 2.75 | 1.36 | 49 | 2.60 | 1.29 | 69 | 2.85 | 1.41 |
| TC (mg/dL) | 118 | 149.19 | 24.62 | 49 | 141.94 | 23.39 | 69 | 154.35 | 24.39 |
| HDL (mg/dL) | 118 | 55.55 | 13.05 | 49 | 51.00 | 12.58 | 69 | 58.78 | 12.47 |
| TG (mg/dL) | 118 | 83.57 | 41.59 | 48 | 95.89 | 8.95 | 69 | 83.83 | 37.68 |
| Insulin (mcU/mL) | 118 | 9.85 | 6.49 | 49 | 9.26 | 6.72 | 69 | 10.26 | 6.34 |
| HOMA (mU/mL×mmol/L) | 118 | 1.95 | 1.40 | 49 | 1.86 | 1.48 | 69 | 2.01 | 1.35 |
| GL (mg/dL) | 118 | 79.53 | 6.98 | 49 | 80.04 | 6.95 | 69 | 79.16 | 7.03 |
TC, total cholesterol; SD, standard deviation; GL, blood glucose; HDL, high density lipoprotein cholesterol; HOMA, homeostatic model assessment; BMI, body mass index; No., sample size; WC, waist circumference; ICWC, iliac crest waist circumference; MWC, midpoint waist circumference between the last rib and iliac crest; BP, blood pressure; TG, triglycerides; TSH, thyroid-stimulating hormone.
No subject had high blood glucose levels. P90 values of the sample for insulin and HOMA were, respectively, 16.90 and 3.15 (15.70 and 3.15 in males and 16.90 and 3.18 in females respectively), and 13 subjects, 11% of the total sample, had insulin levels ≥P90 and 11 subjects, 9.3% of the total sample, HOMA values ≥P90. There were no significant sex differences in frequency of IR based on HOMA and insulinemia values.
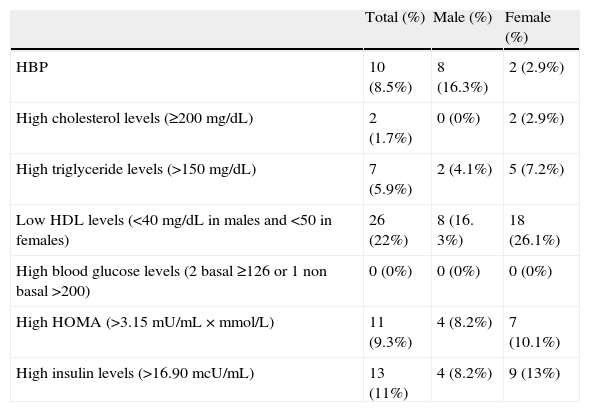
Table 2 shows the frequency of changes in laboratory and blood pressure values in the total sample and by sex.
Laboratory and blood pressure changes in the study population (49 males and 69 females).
| Total (%) | Male (%) | Female (%) | |
| HBP | 10 (8.5%) | 8 (16.3%) | 2 (2.9%) |
| High cholesterol levels (≥200mg/dL) | 2 (1.7%) | 0 (0%) | 2 (2.9%) |
| High triglyceride levels (>150mg/dL) | 7 (5.9%) | 2 (4.1%) | 5 (7.2%) |
| Low HDL levels (<40mg/dL in males and <50 in females) | 26 (22%) | 8 (16. 3%) | 18 (26.1%) |
| High blood glucose levels (2 basal ≥126 or 1 non basal >200) | 0 (0%) | 0 (0%) | 0 (0%) |
| High HOMA (>3.15mU/mL×mmol/L) | 11 (9.3%) | 4 (8.2%) | 7 (10.1%) |
| High insulin levels (>16.90mcU/mL) | 13 (11%) | 4 (8.2%) | 9 (13%) |
No., sample size; M, male; F, female; HBP, high blood pressure; HDL, high density lipoprotein cholesterol; HOMA, homeostatic model assessment.
Based on BMI values, there were 21 overweight subjects (17.8% of total sample), 13 males (26.5%) and 8 females (11.6%), and 8 obese subjects (6.8% of total sample), 3 males (6.1%) and 5 females (7.2%). BMI values of 25 or higher were found in 24.6% of the sample. Obesity rates based on waist perimeter were 5.71% using MWC and 15.38% using ICWC.
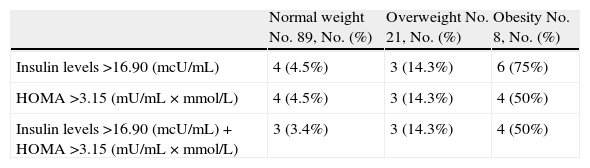
Tables 3 and 4 show the number of subjects who had insulin and HOMA values equal to or higher than P90 when the sample was divided into groups by BMI and waist circumference. The mean and standard deviation for these parameters in the different groups are also shown. A statistically significant association was found between high levels of both HOMA and basal insulinemia and weight status based on BMI and WC (p<0.0001 and p<0.0001).
Increased insulin and/or HOMA levels and descriptive statistics of these variables by weight groups based on body mass index.
| Normal weight No. 89, No. (%) | Overweight No. 21, No. (%) | Obesity No. 8, No. (%) | |
| Insulin levels >16.90 (mcU/mL) | 4 (4.5%) | 3 (14.3%) | 6 (75%) |
| HOMA >3.15 (mU/mL×mmol/L) | 4 (4.5%) | 3 (14.3%) | 4 (50%) |
| Insulin levels >16.90 (mcU/mL)+HOMA >3.15 (mU/mL×mmol/L) | 3 (3.4%) | 3 (14.3%) | 4 (50%) |
| X (SD) | X (SD) | X (SD) | |
| Insulin levels | 8.57 (5.57) | 11.52 (6.33) | 19.61 (7.79) |
| HOMA | 1.69 (1.22) | 2.29 (1.32) | 3.86 (2.02) |
No., sample size; HOMA, homeostatic model assessment; SD, standard deviation; X, mean.
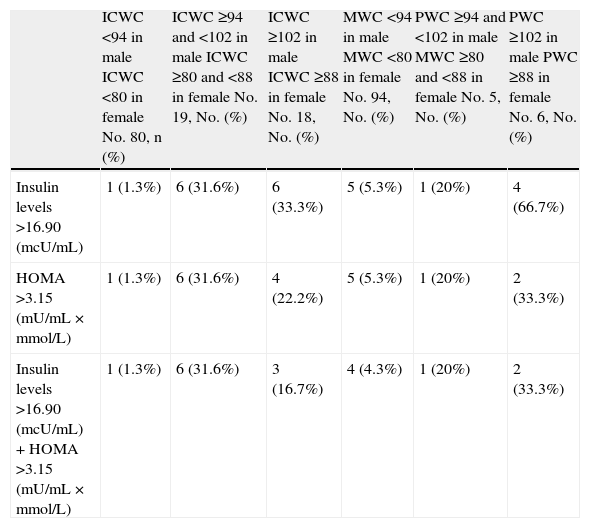
Increased insulin and/or HOMA levels and descriptive statistics of these variables by weight groups based on waist circumference.
| ICWC <94 in male ICWC <80 in female No. 80, n (%) | ICWC ≥94 and <102 in male ICWC ≥80 and <88 in female No. 19, No. (%) | ICWC ≥102 in male ICWC ≥88 in female No. 18, No. (%) | MWC <94 in male MWC <80 in female No. 94, No. (%) | PWC ≥94 and <102 in male MWC ≥80 and <88 in female No. 5, No. (%) | PWC ≥102 in male PWC ≥88 in female No. 6, No. (%) | |
| Insulin levels >16.90 (mcU/mL) | 1 (1.3%) | 6 (31.6%) | 6 (33.3%) | 5 (5.3%) | 1 (20%) | 4 (66.7%) |
| HOMA >3.15 (mU/mL×mmol/L) | 1 (1.3%) | 6 (31.6%) | 4 (22.2%) | 5 (5.3%) | 1 (20%) | 2 (33.3%) |
| Insulin levels >16.90 (mcU/mL)+HOMA >3.15 (mU/mL×mmol/L) | 1 (1.3%) | 6 (31.6%) | 3 (16.7%) | 4 (4.3%) | 1 (20%) | 2 (33.3%) |
| X (SD) | X (SD) | X (SD) | X (SD) | X (SD) | X (SD) | |
| Insulin (mcU/mL) | 7.48 (3.04) | 16.06 (11.29) | 13.91 (4.99) | 8.91 (6.16) | 14.68 (6.36) | 15.91 (2.14) |
| HOMA (mU/mL×mmol/L) | 1.47 (0.67) | 3.31 (2.54) | 2.64 (0.99) | 1.77 (1.37) | 2.90 (1.37) | 2.89 (0.34) |
ICWC, iliac crest waist circumference; MWC, midpoint waist circumference between the last rib and iliac crest; HOMA, homeostatic model assessment; SD, standard deviation; X, mean.
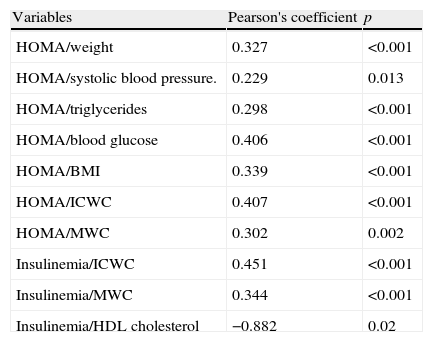
Among the variables considered, significant correlations were found between HOMA and weight, BMI, waist circumference, systolic blood pressure, triglycerides, and blood glucose, while for insulinemia, correlations were only found with waist circumference and HDL cholesterol (Table 5).
Significant correlations between HOMA and insulinemia and anthropometric and laboratory variables.
| Variables | Pearson's coefficient | p |
| HOMA/weight | 0.327 | <0.001 |
| HOMA/systolic blood pressure. | 0.229 | 0.013 |
| HOMA/triglycerides | 0.298 | <0.001 |
| HOMA/blood glucose | 0.406 | <0.001 |
| HOMA/BMI | 0.339 | <0.001 |
| HOMA/ICWC | 0.407 | <0.001 |
| HOMA/MWC | 0.302 | 0.002 |
| Insulinemia/ICWC | 0.451 | <0.001 |
| Insulinemia/MWC | 0.344 | <0.001 |
| Insulinemia/HDL cholesterol | −0.882 | 0.02 |
HDL, high density lipoprotein cholesterol; HOMA, homeostatic model assessment; BMI, body mass index; ICWC, iliac crest waist circumference; MWC, midpoint waist circumference between the last rib and iliac crest.
A highly significant increase in the prevalence of type 2 diabetes, parallel to the increased prevalence of obesity and related to the IR status associated with obesity, has recently been reported in the literature.2 Different parameters have been considered for measuring IR. For this study, it was decided to use fasting plasma insulin levels and the HOMA index because they are easier to perform and more readily available. Metabolic syndrome, defined as the combined occurrence of a number of risk factors for developing cardiovascular disease and type 2 diabetes, may start in childhood, and IR and obesity, both of which increase the risk of developing type 2 DM, maybe its first manifestations.14 Thus, the importance of detecting IR states before glucose intolerance, hyperglycemia, and diabetes occur lies in the possibility of starting early treatment that may prevent the occurrence of associated, mainly cardiovascular complications.
Different authors have reported different cut-off points for HOMA and insulinemia as predictors of the development of cardiovascular changes, type 2 diabetes, or high blood pressure after the monitoring of various populations.8–10,15–18 HOMA cut-off values range from 2.8 to 4.6 depending on the study, while insulinemia levels range from 16 to 16.7. A 2007 Spanish study provided reference values for insulin, C-peptide, the HOMA index, and the QUICKI (quantitative insulin sensitivity check index) in a young population with normal weight and by pubertal stage.19 According to this study, the 90th percentiles of the HOMA index and insulinemia were 3.43 and 15.05mcU/mL, respectively in non-obese boys with normal BMI aged 1–18years, while higher values were reported for older and female subjects. We considered as high values for both parameters those equal to or higher than P90 of the series.
Because of the diversity in cut-off points for insulinemia and HOMA values and the different characteristics of each study population, comparisons between the different IR rates reported are difficult. Moreover, as regards the data collected in this study, few studies have been conducted on a population consisting of young adults of this age and not selected based on their weight status. Studies of children and adolescents, some of them including subjects aged up to 18–19years but with lower mean ages, are available. Some of them reported data on pubertal development, which was complete in our series (Tanner IV–V stage). There are also adult studies including subjects aged 18years or older, but these are usually a minority and specific data for this group are usually not given.
Our series consisted of non-diabetic young adults with complete pubertal development who were not selected based on normal weight, overweight, or obesity criteria. Based on BMI, 17.8% of all subjects were overweight and 8.6% had obesity. Overall, 24.6% of the sample had a BMI of 25 or more, a very similar rate to the 26.9% reported by the EnKid study20 for the 18–24years age group, although the latter showed a virtually similar distribution between overweight and obesity. These rates were also similar to those reported in the 2009 European Health Survey,21 published in November 2010, for Spanish young people aged 18–24years: overweight in 18.53% (23.15% in males and 13.81% in females) and obesity in 5.16% (5.87% in males and 4.43% in females). Based on these data, it may be considered that, despite the limited number of cases, weight distribution in the study population was similar to that of the Spanish population of the same age.
No study participant had elevated blood glucose levels, which is understandable because of patient age and diabetes prevalence at that age. Other authors have reported no or a very low prevalence of diabetes in the 15–24years age group,22,23 while an increasing frequency was found in older series.24,25 However, IR was found in 9.3% of the study population based on the HOMA index, and in 11% based on insulin levels.
As occurs with other cardiovascular risk factors, IR is more commonly found in obese as compared to normal-weight patients.26 In our series (Tables 3 and 4), mean values of both insulinemia and HOMA were elevated in the overweight group, and even higher in the obesity group. IR frequency also increased from 4.5% in normal-weight subjects to 14.3% and 50% in the overweight and obese groups, respectively, a statistically significant difference.
According to the literature, WC is associated with IR regardless of age and Tanner stage in children and adolescents, young males, and adults of both sexes, and serves as a predictor for IR states.27–30 When obesity based on WC was considered, HOMA and insulinemia values and IR prevalence were also higher in this series in the group with WC values of 102cm or higher in males and 88cm or higher in females as compared to the group with normal WC. However, no significant difference was found between the groups with intermediate and higher WC values. Finally, it should be noted that both the HOMA index and insulinemia correlated to waist circumference, and that the HOMA index also correlated to weight and BMI in our series. The most significant limitation of the study was the small sample size, which is explained by the little contact, or even resistance to contact, of this age group with the health care system. We may also wonder whether some of those who refused participation did so because they did not want to recognize a problem related to weight, in which case the sample would be biased. It should be noted, however, that all subjects were of a similar age, and that few data are available in the literature concerning this age group. As previously stated, obesity and overweight rates were similar to those reported in the 2009 European Health Survey.
We conclude that, in this series of young adults, increased BMI and WC were associated to increased insulin resistance even in the absence of hypoglycemia. Because of the relationship of these states to the development of metabolic syndrome, cardiovascular disease, and diabetes, and in order to start early treatment to prevent their occurrence, we think that HOMA and insulin levels should be measured in young adults with overweight and obesity, defined by both BMI and WC. Finally, it should be stressed that, because of the difficulties involved in extrapolating data obtained from a larger sample, it would be appropriate to have specific HOMA index and insulinemia reference values for the Spanish young adult population.
Conflicts of interestThe authors state that they have no conflicts of interest.
Please, cite this article as: Rogero Blanco ME, et al. Prevalencia de resistencia a insulina en una población de jóvenes adultos. Relación con el estado ponderal. Endocrinol Nutr. 2012;59:98–104.
