


To assess the association between epicardial adipose tissue (EAT) thickness and plasma adrenomedullin plasma levels in patients with metabolic syndrome (MS).
MethodsTwenty-one patients (12 females and 9 males) with MS according to the International Diabetes Federation guidelines, aged 22–58 years, were enrolled into the study and compared to 19 age-matched control subjects without MS. Plasma glucose, lipid, and adrenomedullin levels were assessed. EAT, left ventricular mass, and carotid intima–media thickness were evaluated by transthoracic two-dimensional echocardiography.
ResultsNo statistically significant differences were found between the groups in age, sex, and height. Body weight, abdominal circumference (AC), body mass index (BMI), systolic blood pressure (SBP), and diastolic blood pressure (DBP) were significantly higher (p=0.0001) in MS patients; this group also showed significantly higher glucose (p=0.001), total cholesterol (p=0.01), LDL-C (p=0.03), VLDL-C (p=0.005), triglyceride (p=0.002), Tg/HDL ratio (p=0.0001), and plasma adrenomedullin (3.49±1.21 vs 1.69±0.92ng/mL; p=0.0001) levels and lower HDL-C (p=0.02) levels as compared to the control group. EAT was significantly thicker in MS patients compared to the control group (8.45±3.14 vs 5.43±0.96; p=0.0001), showed a positive correlation to BMI (r=0.347; p=0.02), AC (r=0.350; p=0.02), DBP (r=0.346; p=0.02), and adrenomedullin levels (r=0.741; p=0.0001). In multiple linear regression analysis, adrenomedullin was the only parameter associated to EAT (R2=0.550; p=0.0001).
ConclusionIn this small patient group, a statistically significant association was found between EAT and plasma adrenomedullin levels, which may be considered as a potential biomarker of MS.
Estudiar la asociación del espesor del tejido adiposo epicárdico (TAE) con los niveles plasmáticos de adrenomedulina en pacientes con síndrome metabólico (SM).
MetodologíaSe seleccionaron 21 sujetos, 12 de sexo femenino y 9 de masculino, entre 22 y 58 años, con diagnóstico de SM según la Federación Internacional de Diabetes (IDF), y 19 controles, comparables en edad y sexo. Se midieron glicemia, lípidos y adrenomedulina plasmática. Se determinaron espesor del TAE, masa del ventrículo izquierdo y espesor íntima-media carotídeo mediante ecocardiografía transtorácica.
ResultadosNo hubo diferencias estadísticamente significativas en edad, sexo y talla entre ambos grupos, y el peso, IMC, circunferencia abdominal (CA), presión arterial sistólica (PAS) y diastólica (PAD) fueron significativamente más altos (p=0,0001) en el grupo con SM. Este grupo presentó niveles significativamente más altos de glicemia (p=0,001), colesterol total (p=0,01), C-LDL (p=0,03), C-VLDL (p=0,005), triglicéridos (p=0,002), cociente Tg/C-HDL (p=0,0001) y adrenomedulina (3,49±1,21 vs 1,69±0,92 ng/mL; p=0,0001) y más bajos de C-HDL (p=0,02) que el grupo control. El espesor del TAE en los pacientes con SM fue significativamente más alto que en el grupo control (8,45±3,14 vs 5,43±0,96mm; p=0,0001), y mostró una correlación positiva con IMC (r=0,347; p=0,02), CA (r=0,350; p=0,02), PAD (r=0,346; p=0,02) y adrenomedulina (r=0,741; p=0,0001). En el análisis de regresión lineal múltiple, la adrenomedulina fue la variable explicativa del espesor del TAE (R2=0,550; p=0,0001).
ConclusiónEn este limitado grupo de pacientes existe una asociación significativa entre espesor de TAE y niveles plasmáticos de adrenomedulina, los cuales pudieran ser utilizados como biomarcadores de SM.
Metabolic syndrome (MS) is related to multiple cardiovascular risk factors and is identified by the presence of at least three metabolic changes: abdominal obesity, arterial hypertension, impaired fasting glycemia, or carbohydrate intolerance, as well as atherogenic dyslipidemia characterized by hypertriglyceridemia and decreased high density lipoprotein cholesterol (HDL-C) levels.1
Recognition of the adipocyte as a highly complex endocrine complex able to secrete a number of bioactive molecules collectively known as adipocytokines has awakened a great interest in adipose tissue, particularly in visceral adiposity, which is associated with increased cardiometabolic risk.2–4 In fact, increased visceral adiposity is a characteristic that defines MS, and although scientific interest in recent years has focused on the study of intra-abdominal visceral fat, some deposits of extra-abdominal visceral fat such as epicardial fat have also been studied and become novel markers of cardiovascular risk.5
Epicardial adipose tissue (EAT) evolves from brown adipose tissue during embryogenesis, and in adult age tends to be located in the atrioventricular and interventricular sulci, extending towards the apex. Minor fat foci are located at the subepicardial level along the free atrial wall.5 This tissue has specific characteristics that differentiate it from other visceral fat deposits: adipocyte size is low as compared to abdominal fat, and fatty acid synthesis and catabolism are greater. It has thus been suggested that epicardial fat may act as a buffer that serves to protect the heart against the cardiolipotoxicity generated by free fatty acids.6 Epicardial adipocytes may also play both a beneficial and harmful role for the heart through the secretion of adipocytokines, including adrenomedullin. Adrenomedullin is a 52-amino acid peptide having vasodilating, antioxidant, angiogenic, and anti-inflammatory properties which could exert a protective role on coronary vascularization by virtue of its proximity to it and to the adjacent myocardium.7 This hormone has been used as a marker of the severity and course of conditions such as heart failure, renal failure, and atherosclerosis.8 However, its relationship to MS and epicardial adipose tissue has been little studied. Some authors have found an increased epicardial fat thickness in patients with MS,9,10 and Kita et al.11 showed increased plasma adrenomedullin levels in patients with multiple cardiovascular risk factors. On the other hand, recent evidence has pointed out that epicardial preadipocytes and stromal cells express adrenomedullin and its receptors, and a strong relationship may therefore exist between both cardiometabolic risk markers.12
The objective of this study was to examine the relationship between the echocardiographic variables—EAT thickness, left ventricular mass, and carotid intima–media thickness—and the anthropometric and clinical components of MS, as well as their association with plasma adrenomedullin levels as markers of MS. Patients with MS are expected to have both greater EAT thickness and higher plasma adrenomedullin levels.
Patients and methodsStudy design and subjectsBased on the proposed objective, an observational, cross-sectional, comparative, analytical study was designed. The study population consisted of 21 subjects (12 females and 9 males) aged 22–58 years with a body mass index (BMI) ranging from 27 and 46kg/m2 who met at least three of the criteria for MS diagnosis of the International Diabetes Federation (IDF): abdominal circumference (AC)>80cm in females and >90cm in males, blood pressure>130/80mmHg, fasting blood glucose>100mg/dL, plasma triglyceride levels>150mg/dL, and high density lipoprotein cholesterol (HDL-C) levels<50mg/dL in females and <40mg/dL in males. These subjects were compared to 19 age-matched controls (10 females and 9 males) who did not meet three of the abovementioned MS criteria. All study subjects lived in Ciudad Bolívar, State of Bolívar, Venezuela. Subjects with familial dyslipidemia and endocrine diseases such as type 2 diabetes mellitus, hypothyroidism, Cushing's syndrome, and acromegaly, as well as any comorbidity or use of drugs (glucocorticoids, lipid lowering drugs, etc.) which could affect metabolic parameters were excluded from the study. This study was conducted in agreement with the guidelines proposed by the Declaration of Helsinki, and all subjects gave their written consent to participate in the study.
Anthropometric and clinical variablesWeight and height were measured under fasting conditions and with subjects in underwear. BMI was calculated as weight divided by squared height, and was used as an obesity marker if greater than 30kg/m2. AC was measured in centimeters with subjects standing at the level of a midline between the lower margin of the last rib and the iliac crests. Blood pressure was measured in the right arm after sitting for 10min by the auscultatory method, using a standard mercury sphygmomanometer.
Biochemical variablesA blood sample was drawn from the antecubital vein after fasting for at least 8h to measure blood glucose and lipids (total cholesterol, triglycerides, and HDL-C). Tests were performed by enzymatic methods using a Bayer Express Plus® autoanalyzer with Wiener reagents (Buenos Aires, Argentina). Low density lipoprotein cholesterol (LDL-C) was estimated using the Friedewald equation LDL=total cholesterol−[HDL-C+(triglycerides/5)], and very low density lipoprotein cholesterol (VLDL-C) by dividing triglycerides by 5.
Plasma adrenomedullin levels were measured using an immunoenzymatic method. A specifically designed ELISA kit (DRG International Inc., New Jersey, USA) with inter-assay and intra-assay coefficients of variation of 10% and 5% respectively was used for that purpose.
Echocardiographic variablesEach subject was given a standard two-dimensional (2D) transthoracic echocardiogram in a left lateral decubitus position using Mylab 50 Exvision Esaote® and Mylab CVX Esaote® equipments (Esaote, Genoa, Italy). The procedure validated by Iacobellis et al.13 was used for measurements. Echocardiograms were interpreted by two different cardiologists. Adequate reproducibility of measurements was found, thus guaranteeing their validity.
Echocardiographically, EAT is identified as the echolucent space between the external wall of the myocardium and the visceral layer of the pericardium. This thickness is measured perpendicularly on the free wall of the right ventricle at the end of systole in 3 cardiac cycles using a parasternal long or parasternal short axis view. Measurements were performed on the free wall of the right ventricle for two reasons: (1) this point is anatomically recognized as the one with the greatest epicardial fat thickness and (2) the parasternal long and parasternal short axes allow for more accurate measures of epicardial adipose tissue on the right ventricle, with an optimum slide orientation in each view.
Left ventricular mass was similarly measured on the parasternal long axis using the anatomically validated formula of Devereux et al.,14 and was subsequently indexed with the patient's body surface area. Carotid intima–media thickness was in turn measured on the longitudinal axis of the vessel, at three points of the common carotid artery (proximal, middle, and distal thirds) using a vascular linear probe. The three measures were then averaged, and the highest value between the two carotids of both sides was taken as the carotid intima–media thickness.
Data were recorded in a form especially prepared for the purpose, and the study was approved by the relevant ethics committee.
Statistical analysisContinuous variables are given as mean±standard deviation, and categorical variables as numbers and percentages. A Chi-square test was used to assess potential sex-related differences between the groups. In order to determine the difference in the means of continuous variables between subjects with and without MS, Student's t test for independent data was applied to normally distributed variables, while a Mann–Whitney U test was used for non-normally distributed variables (EAT thickness, systolic and diastolic blood pressure). Pearson's correlation matrix was performed, as well as a simple and multiple linear regression analysis, taking epicardial fat as the dependent variable, in order to determine which variable had more weight upon it. SPSS 15.0 for Windows was used for statistical analysis, and a value of p≤0.05 was considered statistically significant.
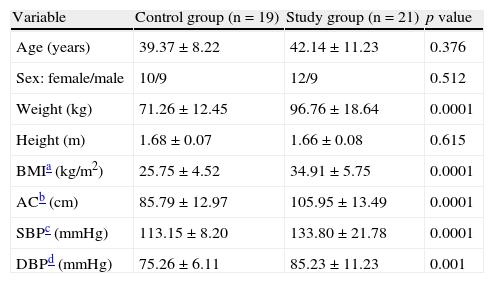
ResultsTable 1 shows the anthropometric and clinical data of participants in the control and study groups. There were no statistically significant differences in age, sex, and height between the two groups. Weight, BMI, abdominal circumference (AC), and systolic (SBP) and diastolic (DBP) blood pressure were significantly higher (p=0.0001) in the group with MS.
Anthropometric and clinical variables of the control and study (patients with metabolic syndrome) groups.
| Variable | Control group (n=19) | Study group (n=21) | p value |
| Age (years) | 39.37±8.22 | 42.14±11.23 | 0.376 |
| Sex: female/male | 10/9 | 12/9 | 0.512 |
| Weight (kg) | 71.26±12.45 | 96.76±18.64 | 0.0001 |
| Height (m) | 1.68±0.07 | 1.66±0.08 | 0.615 |
| BMIa (kg/m2) | 25.75±4.52 | 34.91±5.75 | 0.0001 |
| ACb (cm) | 85.79±12.97 | 105.95±13.49 | 0.0001 |
| SBPc (mmHg) | 113.15±8.20 | 133.80±21.78 | 0.0001 |
| DBPd (mmHg) | 75.26±6.11 | 85.23±11.23 | 0.001 |
Data are given as X±SD. Sex in number.
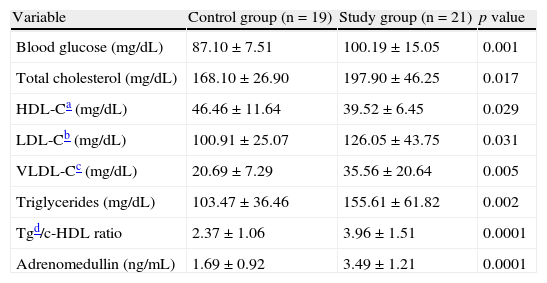
When the biochemical variables of the participants were compared (Table 2), the study group showed, as expected, significantly higher blood glucose (p=0.001), total cholesterol (p=0.01), LDL-C (p=0.03), VLDL-C (p=0.005), triglyceride (p=0.002), Tg/HDL ratio (p=0.0001), and adrenomedullin (p=0.0001) levels and lower HDL-C levels (p=0.02) as compared to the control group.
Biochemical variables of the control and study (patients with metabolic syndrome) groups.
| Variable | Control group (n=19) | Study group (n=21) | p value |
| Blood glucose (mg/dL) | 87.10±7.51 | 100.19±15.05 | 0.001 |
| Total cholesterol (mg/dL) | 168.10±26.90 | 197.90±46.25 | 0.017 |
| HDL-Ca (mg/dL) | 46.46±11.64 | 39.52±6.45 | 0.029 |
| LDL-Cb (mg/dL) | 100.91±25.07 | 126.05±43.75 | 0.031 |
| VLDL-Cc (mg/dL) | 20.69±7.29 | 35.56±20.64 | 0.005 |
| Triglycerides (mg/dL) | 103.47±36.46 | 155.61±61.82 | 0.002 |
| Tgd/c-HDL ratio | 2.37±1.06 | 3.96±1.51 | 0.0001 |
| Adrenomedullin (ng/mL) | 1.69±0.92 | 3.49±1.21 | 0.0001 |
Data are given as X±SD.
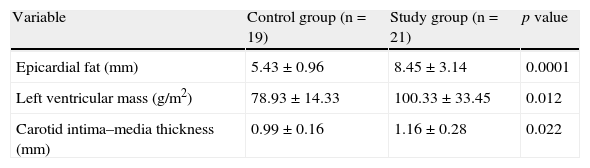
Table 3 gives the echocardiographic data of the participants, showing that both EAT thickness (p=0.0001) and left ventricular mass (p=0.01), and carotid intima–media thickness (p=0.02) were significantly greater in the study group as compared to the control group.
Echocardiographic variables of the control and study (patients with metabolic syndrome) groups.
| Variable | Control group (n=19) | Study group (n=21) | p value |
| Epicardial fat (mm) | 5.43±0.96 | 8.45±3.14 | 0.0001 |
| Left ventricular mass (g/m2) | 78.93±14.33 | 100.33±33.45 | 0.012 |
| Carotid intima–media thickness (mm) | 0.99±0.16 | 1.16±0.28 | 0.022 |
Data are given as X±SD.
Pearson's correlation analysis showed that epicardial fat, as measured in mm, had a statistically significant positive correlation to BMI (r=0.347; p=0.02), AC (r=0.350; p=0.02), and DBP (r=0.346; p=0.02) (Fig. 1). Fig. 2 similarly shows a very significant positive correlation of EAT thickness with plasma adrenomedullin levels (r=0.741; p=0.0001) and left ventricular mass (r=0.326; p=0.03).
, abdominal circumference (AC), and diastolic blood pressure (DBP).")
.")
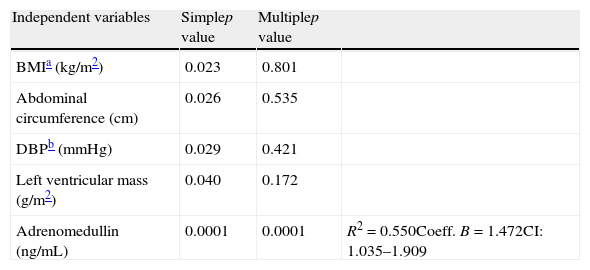
A linear regression analysis was performed to assess the variables accounting for epicardial adipose tissue thickness as a dependent variable in the study sample. In the simple linear regression analysis, BMI, AC, DBP, left ventricular mass, and plasma adrenomedullin levels were found to be significant (Table 4). BMI, AC, DBP, and left ventricular mass lost their statistical significance in multiple linear regression analysis, while the significance of plasma adrenomedullin levels persisted (p=0.0001) and was retained as the variable explaining EAT thickness, with an R2 of 0.550, i.e. an explanation of 55% of the EAT thickness value.
Simple and multiple linear regression analysis of variables related to the presence of epicardial fat thickness as dependent variable.
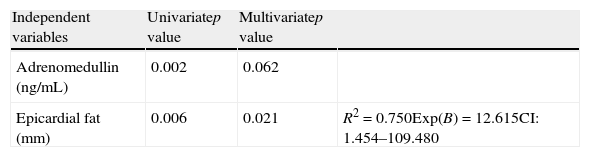
A logistic regression analysis was performed, using the presence or absence of MS as the dependent variable and EAT and adrenomedullin as independent variables, to ascertain which of them was more associated with MS in the study sample. Univariate analysis found that both adrenomedullin and epicardial fat were significant (Table 5). In multivariate regression analysis, adrenomedullin lost its statistical significance, while epicardial fat continued to show significance (p=0.021) and was retained as the variable explaining MS, with an R2 of 0.750, i.e. an explanation of 75% of cases, an Exp(B) or odds ratio of 12.615, and a confidence interval of 1.454–109.480.
Univariate and multivariate logistic regression analysis of the variables adrenomedullin and epicardial fat with the presence of metabolic syndrome as dependent variable.
| Independent variables | Univariatep value | Multivariatep value | |
| Adrenomedullin (ng/mL) | 0.002 | 0.062 | |
| Epicardial fat (mm) | 0.006 | 0.021 | R2=0.750Exp(B)=12.615CI: 1.454–109.480 |
A growing body of evidence15 suggests that visceral fat may be an independent predictor of metabolic risk. Imaging studies have shown a greater accuracy for the quantification of adipose tissue in different body compartments than anthropometric indices such as AC.16 In particular, ultrasound procedures represent excellent methods for predicting abdominal visceral fat and have the advantage of lower cost as compared to magnetic resonance imaging and computed tomography techniques.13
Our results agree with those reported in other studies showing that epicardial fat, as measured by echocardiography, is related to the anthropometric and clinical components of MS.9,10 In fact, we found a good correlation between EAT thickness and BMI, AC, and DBP that appears to confirm that obesity is a factor predisposing to an increase in EAT.17 As a novel contribution in this regard, recent research has proposed EAT as the therapeutic target for different interventions in obese patients, showing that epicardial fat thickness decreases to a greater extent and more rapidly than other classical anthropometric parameters such as BMI and AC when weight reduction programs are used.18,19 In addition, our results show that distribution of fat, particularly abdominal fat indirectly measured by AC, correlates to EAT thickness, as already reported by Iacobellis et al.,20 who showed that epicardial fat significantly increases with an increased AC (p=0.001) and also established epicardial fat cut-off points for males and females associated with an increased AC (≥9.5mm and ≥7.5mm respectively).
On the other hand, the good correlation between EAT and DBP may be explained in the context of the pathophysiological mechanism of insulin resistance. In this regard, a twofold greater release rate of fatty acids by the epicardial adipocyte as compared to perirenal fat has been reported in animal models, which suggests high lipolytic activity that is probably due to several mechanisms, including the reduced antilipolytic effect of insulin in this tissue and the increased expression of β-adrenergic receptors, especially β-3 receptors, whose stimulation could activate the lipolytic pathway.6 These observations suggest that EAT is a tissue with high insulin resistance, and the relationship between insulin resistance, visceral adiposity, and arterial hypertension is well known.21
A good correlation was seen in our study between EAT thickness and left ventricular mass, in agreement with reports by other authors.22,23 Iacobellis et al.22 showed that left ventricular mass correlated to the amount of EAT and that this correlation was independent of BMI and age but, as occurred in our study, could not establish a cause–effect relationship between EAT and left ventricular mass, although there are several mechanisms that may explain such a correlation. It may be assumed that an increase in visceral fat may directly affect left ventricular output and systolic volume to perfuse the increased body mass, and that the biochemical properties of visceral adipose tissue, such as the high release rate of fatty acids, β-adrenergic activity, and insulin resistance could also contribute to left ventricular hypertrophy.22 Since epicardial fat is a tissue with high insulin resistance, it could therefore promote activation in the myocardial cell of the mitogen-activated protein kinase (MAPK) pathway, as well as activation of the renin–angiotensin system, particularly angiotensin II, whose action upon AT1 receptors is able to induce myocardial cell proliferation, and stimulate aldosterone synthesis and secretion in the glomerular layer of the adrenal cortex, causing water and sodium reabsorption, extracellular volume expansion and, finally, left ventricular hypertrophy.24–26 However, the reasons why this correlation is lost in the female sex cannot be explained based on the currently available evidence.
Multiple linear regression analysis showed that plasma adrenomedullin was the main variable accounting for epicardial fat thickness. In this regard, it has been reported that preadipocytes in epicardial adipose tissue synthesize adrenomedullin, and that stromal cells close to adipocytes express receptors for this peptide.12 Interestingly, Isumi et al.27 showed that adrenomedullin may act as a proliferative factor for preadipocytes, which suggests that, in EAT, adrenomedullin could regulate the multiplication of preadipocytes, and thus epicardial fat mass, through an autocrine or paracrine mechanism. The reverse relationship also applies. Evidence suggests that under pathological conditions, in which an increase in EAT thickness occurs, this tissue acts as a significant source of proinflammatory cytokines such as TNF-α, which is able to induce adrenomedullin synthesis and secretion by a paracrine mechanism.28,29 On the other hand, logistic regression analysis using the presence of MS as the dependent variable found EAT to better correlate to MS as compared to adrenomedullin. This supports the abovementioned strong association between echocardiographic measurements of this tissue and MS components.9,10 Increased plasma adrenomedullin levels in patients with MS may be due to the presence in such patients of arterial hypertension, obesity, and hyperglycemia, conditions in which a possibly compensatory increase of this peptide has been shown.7,8
To our knowledge, there have been no prior studies which assess the association between plasma adrenomedullin levels and EAT thickness in patients with MS. However, the relationship between both variables has been studied in patients with coronary artery disease, with partially conflicting results. Iacobellis et al.30 reported a decreased adrenomedullin expression by EAT in patients with coronary artery disease, while Silaghi et al.12 found an increased adrenomedullin expression by this tissue in the same clinical condition. The reason for such differences could be that the patients studied by Iacobellis et al. were older and thinner than those studied by Silaghi et al., as it is likely that age and fat mass interfere with the expression of this adipocytokine by EAT.
Based on these results, we concluded that a significant association existed in this small group of patients between EAT thickness and plasma adrenomedullin levels, which could serve as a MS marker. Additional studies, particularly prospective studies, are needed to assess whether EAT and/or adrenomedullin are related to the occurrence of cardiovascular disease, and whether they provide information additional to the traditional risk factors.
Conflicts of interestThe authors state that they have no conflicts of interest.
Please cite this article as: Torres C, et al. Tejido adiposo epicárdico y su asociación con niveles plasmáticos de adrenomedulina en pacientes con síndrome metabólico. Endocrinol Nutr. 2011;58:401-8.
