


The INSTIGATE study assessed healthcare costs and clinical outcomes in patients with type 2 diabetes mellitus starting insulin therapy in Spain over a 24-month follow up period.
Material and methodsThis was an observational, non-interventional, prospective, multicenter study. Costs incurred in the previous 6 months were assessed at each visit.
ResultsA total of 172 patients with a mean body mass index of 29.6kg/m2, a mean [standard deviation] duration of diabetes of 10.9 [7.0] years and a hemoglobin A1c value of 9.2% [1.5%] were followed up for at least 12 and up to 24 months. Direct costs were assessed from the perspective of the Spanish healthcare system. Long/intermediate-acting insulin alone was started in 116 patients (67.4%). After 6, 12, and 24 months of insulin treatment, mean [SD] intraindividual changes from baseline in hemoglobin A1c were −1.9% [1.65%], −1.6 [1.73%], and −1.5% [1.76%] respectively. Mean (median) total diabetes-related healthcare costs per patient increased from €659 (€527) to €1.085 (€694) 6 months after insulin initiation, decreased to €646 (€531) after 12 months, and increased again after 24 months to €667 (€539). Insulin/oral antidiabetics, primary/specialized care, and blood glucose monitoring accounted for 41%, 26%, and 19% of total cost at 24 months respectively.
ConclusionsClinical parameters of these patients with type 2 diabetes mellitus improved following insulin initiation. After a temporary increase, direct healthcare costs of diabetes care returned to baseline values at the end of the follow-up period.
El estudio INSTIGATE evalúa los costes directos sanitarios y los resultados clínicos en pacientes con diabetes mellitus tipo 2 que inician insulinoterapia en España, durante 24 meses.
Material y métodoEstudio observacional, no intervencionista, prospectivo y multicéntrico. En cada visita se evaluaron los costes incurridos durante los 6 meses previos.
ResultadosEn total se evaluaron 172 pacientes durante al menos 12 o un máximo de 24 meses con un índice de masa corporal medio de 29,6kg/m2, una duración media [desviación estándar] de la enfermedad de 10,9 [7,0] años y un porcentaje de hemoglobina A1c de 9,2% [1,5%]. Un total de 116 pacientes (67,4%) iniciaron insulina de acción prolongada/intermedia solamente. Los cambios medios intraindividuales en los valores iniciales de hemoglobina A1c tras 6, 12 y 24 meses de la insulinoterapia fueron, respectivamente, -1,9 [1,65%], -1,6 [1,73%] y -1,5% [1,76%]. La media (mediana) del total de los costes directos sanitarios por paciente aumentó de 659€ (527€) a 1.085€ (694€) 6 meses después del inicio de la insulinoterapia, bajó a 646€ (531€) después de 12 meses, y 24 meses después aumentó nuevamente a 667€ (539€). A los 24 meses, los costes de insulina/antidiabéticos orales, medicina general/especializada, y monitorización de la glucemia representaron el 41, 26 y 19%, respectivamente, de los costes totales.
ConclusionesLos parámetros clínicos de estos pacientes con diabetes mellitus tipo 2 mejoraron tras iniciar la insulinoterapia. Tras un incremento temporal, los costes directos sanitarios del tratamiento de la diabetes volvieron a los valores basales al final del período de seguimiento.
Type 2 diabetes mellitus (T2DM) represents a significant public health problem worldwide. According to the International Diabetes Federation, the estimated prevalence of diabetes was 366 millions in 2011 and is expected to increase to 522 millions in 2030 if urgent action is not taken. The International Diabetes Federation also estimates that 183 million people do not know that they have diabetes.1 T2DM accounts for 85–95% of all cases of diabetes in developed countries.2 Although the clinical effectiveness of insulin therapy in patients with T2DM is clear, data about healthcare resource utilization and the direct costs of treatment under standard clinical practice conditions in European countries are limited.3
The Di@bet.es study, an extensive epidemiological research project recently conducted in Spain, showed a significant increase in the total prevalence of T2DM (known and undiagnosed) in subjects over 18 years of age, estimated at 13.8%, approximately half of which corresponded to cases of unknown diabetes (6%). According to this study, the prevalence of diabetes and pre-diabetic stages (impaired basal blood glucose and glucose tolerance) significantly increased with age, and was higher in males than females.4 The treatment of diabetes and its complications represent a great financial impact on the Spanish healthcare system. According to most recent estimates, total direct healthcare expenses for Spanish patients with T2DM ranged in 2002 from 2.4 to 2.7 billion euros, which represents 6.3–7.4% of all public healthcare expenses in Spain.5 Based on a review of several studies of the cost of the disease conducted between 1994 and 2002, the direct healthcare costs of T2DM estimated from the perspective of the Spanish healthcare system range from €381 to €2560 per patient and year.6,7 Data about the clinical results and direct healthcare costs of T2DM patients who start insulin therapy in standard clinical practice are however scant.
The INSTIGATE study was a European multicenter, prospective, noninterventional study evaluating patients with T2DM starting insulin therapy as part of their standard treatment. The objectives of this observational study were to assess the utilization of healthcare resources associated with diabetes, as well as the costs associated with the start of insulin therapy, and to report the quality of metabolic control and the clinical results once insulin treatment has been started in five European countries, including Spain. INSTIGATE consisted of two parts: the main part (patients assessed six months after the start of insulin therapy) and the study extension (patients assessed for at least 12 months and up to 24 months after the start of insulin therapy).
The objective of this paper is to report the clinical results and direct healthcare costs associated with the treatment of diabetes for the first two years after the start of insulin therapy in Spanish patients with T2DM who were participating in the study extension, from the perspective of the national health system.
Subjects and methodsStudy designThe INSTIGATE study was conducted in France, Germany, Greece, Spain, and the United Kingdom to examine the normal course of treatment for diabetes in adult patients with T2DM from the start of insulin therapy to 24 months later. Investigators participating in this study were primary care physicians, diabetologists/endocrinologists, and internal medicine specialists from primary and specialized care centers. Patient visits were performed according to standard care practice, and treatment decisions were taken by physicians and patients. For additional details on study design and the baseline characteristics of patients, interested readers are referred to a previously published article.8
Study populationStudy participants were consecutively recruited during 2006 throughout Spain. Recruitment was based on the investigators’ criterion. Patients aged 18 years or older diagnosed with T2DM based on the clinical judgment of the investigator with adequate understanding of the Spanish language in whom insulin therapy was first started in the setting of standard care practice were invited to participate. Patients participating at the same time in any study including the use of any investigational drug or procedure were excluded from the study. All patients were given comprehensive information about the study and gave consent for the use of their data. Patients received no compensation for their participation in the study. The study protocol was approved by Hospital Universitario La Paz (Madrid, Spain), and the study was conducted in accordance with local ethical requirements and the Declaration of Helsinki.
Investigators participating in the studyA total of 24 investigators (9 endocrinologists, 8 internal medicine specialists, and 7 primary care physicians) from public healthcare centers with a large number of patients with T2DM who were starting insulin therapy participated in this study. The investigators provided socio-demographic data, as well as information concerning patient histories, other diseases, treatment for diabetes, clinical results, and the utilization of resources related to diabetes. Medical visits of patients occurred in accordance with standard clinical practice, and all treatment decisions were taken by physicians and patients. Investigators received financial compensation for participating in this study.
Data collectionAt the first stage, i.e. at the start of insulin therapy, investigators collected demographic and clinical data, as well as information about the clinical severity of diabetes (expressed as glycosylated hemoglobin [HbA1c] levels, fasting plasma glucose levels, lipid profile, and blood pressure) and significant comorbidities. Data on resource utilization during the six months prior to the start of insulin therapy were retrospectively collected by reviewing the clinical records. Patients were then prospectively evaluated for at least 12 months and up to 24 months. Investigators reported the clinical results and healthcare resource utilization in the visits performed during standard clinical practice. For patients who did not return for the follow-up visit, the investigators had the option of collecting data by telephone call and/or regular post. The information collected about diabetes-related resource utilization included visits, telephone calls and consultations with healthcare providers, insulin treatment, oral anti-diabetics (OADs), blood glucose monitoring, and hospital admissions. Healthcare professionals included primary care physicians and nursing staff, diabetologists/endocrinologists, internal medicine specialists, specialized nursing staff, ophthalmologists, nutritionists, and podiatrists.
Cost assessmentThe direct healthcare costs related to diabetes were assessed from the perspective of the Spanish healthcare system, using the costs of the year of the study (2006). The costs of consultations, visits, telephone calls to healthcare providers, blood glucose monitoring, and hospital admissions were taken from the OBLIKUE database, which contains a list of the unit costs of healthcare services in Spain.9 The costs of visits, telephone calls, and consultations with healthcare professionals were based on unit costs per visit depending on the specialty. Daily costs were used to calculate the costs of hospital admissions. Data collected about drugs included the name and dosage of the medicinal product. Medication costs were taken from the database of the General Council of Spanish Official Associations of Pharmacists,10 and average daily costs were calculated based on package size, presentation, and dosage.
Statistical analysesAll statistical analyses were descriptive and exploratory. For continuous variables, the mean, standard deviation (SD), median, minimum, maximum, and quartiles (lower quartile Q1–upper quartile Q3), when required, were calculated. For categorical variables, absolute frequencies and percentages were calculated as a function of non-missing values. Missing values were not included. All statistical analyses were performed using SAS version 9.0 software (SAS Institute Inc., Cary, NC, USA).
ResultsPatient characteristics at study startAmong the 224 patients enrolled in the study, 172 patients for whom follow-up data of at least 12 months after the start of insulin therapy were available participated in the study extension and were therefore included in this analysis. Of these, 152 completed the whole observational period of 24 months. Among the 52 patients excluded from the analysis because they only participated in the main part of the study, 17 patients (7.6% of 224) only had baseline values, and no information was available concerning insulin use. Table 1 shows the characteristics of both the other 35 patients (15.6% of 224) and the remaining 172 patients included in the analysis.
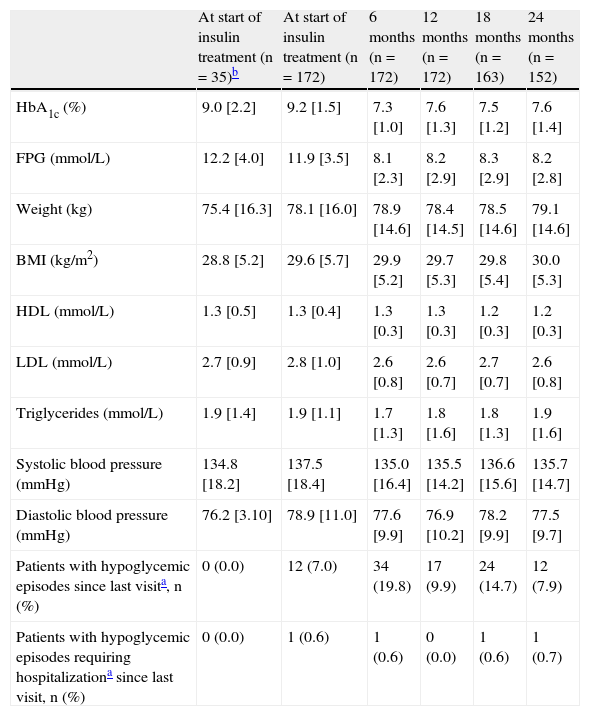
Clinical results at the start of insulin treatment and by visit.
| At start of insulin treatment (n=35)b | At start of insulin treatment (n=172) | 6 months (n=172) | 12 months (n=172) | 18 months (n=163) | 24 months (n=152) | |
| HbA1c (%) | 9.0 [2.2] | 9.2 [1.5] | 7.3 [1.0] | 7.6 [1.3] | 7.5 [1.2] | 7.6 [1.4] |
| FPG (mmol/L) | 12.2 [4.0] | 11.9 [3.5] | 8.1 [2.3] | 8.2 [2.9] | 8.3 [2.9] | 8.2 [2.8] |
| Weight (kg) | 75.4 [16.3] | 78.1 [16.0] | 78.9 [14.6] | 78.4 [14.5] | 78.5 [14.6] | 79.1 [14.6] |
| BMI (kg/m2) | 28.8 [5.2] | 29.6 [5.7] | 29.9 [5.2] | 29.7 [5.3] | 29.8 [5.4] | 30.0 [5.3] |
| HDL (mmol/L) | 1.3 [0.5] | 1.3 [0.4] | 1.3 [0.3] | 1.3 [0.3] | 1.2 [0.3] | 1.2 [0.3] |
| LDL (mmol/L) | 2.7 [0.9] | 2.8 [1.0] | 2.6 [0.8] | 2.6 [0.7] | 2.7 [0.7] | 2.6 [0.8] |
| Triglycerides (mmol/L) | 1.9 [1.4] | 1.9 [1.1] | 1.7 [1.3] | 1.8 [1.6] | 1.8 [1.3] | 1.9 [1.6] |
| Systolic blood pressure (mmHg) | 134.8 [18.2] | 137.5 [18.4] | 135.0 [16.4] | 135.5 [14.2] | 136.6 [15.6] | 135.7 [14.7] |
| Diastolic blood pressure (mmHg) | 76.2 [3.10] | 78.9 [11.0] | 77.6 [9.9] | 76.9 [10.2] | 78.2 [9.9] | 77.5 [9.7] |
| Patients with hypoglycemic episodes since last visita, n (%) | 0 (0.0) | 12 (7.0) | 34 (19.8) | 17 (9.9) | 24 (14.7) | 12 (7.9) |
| Patients with hypoglycemic episodes requiring hospitalizationa since last visit, n (%) | 0 (0.0) | 1 (0.6) | 1 (0.6) | 0 (0.0) | 1 (0.6) | 1 (0.7) |
SD: standard deviation; FPG: fasting plasma glucose; HbA1c: glycosylated hemoglobin; HDL: high density lipoprotein; BMI: body mass index; LDL: low density lipoprotein; n: number of patients.
Percentages of hypoglycemic episodes are for the three-month period prior to the start of insulin therapy. They include episodes resolved by the patients themselves, those in which they needed help from a third person but did not go to the hospital, and those where hospital attendance was needed.
Patients participating only in the main part of the protocol (up to six months) and having data available at the start of insulin treatment.
Means and standard deviations in the table are based on the corresponding data of non-missing values. Values are given as mean (standard deviation) except as otherwise noted.
The mean age [SD] of the 35 patients who participated in the main part of the study (66% males) was 68 [13.7] years, and they were overweight (mean body mass index [BMI] 28.8 [5.2]kg/m2) and had a mean hemoglobin A1c value of 9.0% [2.2%] at the start of insulin therapy.
Patients participating in the study extension (56% males) were overweight (mean BMI 29.6 [5.7]kg/m2) and had a mean age of 65 [12.0] years and a mean diabetes duration of 10.9 [7.0] years. The baseline characteristics of all patients enrolled into the INSTIGATE study, as well as the results six months after the start of insulin therapy, are reported in other publications.11,12
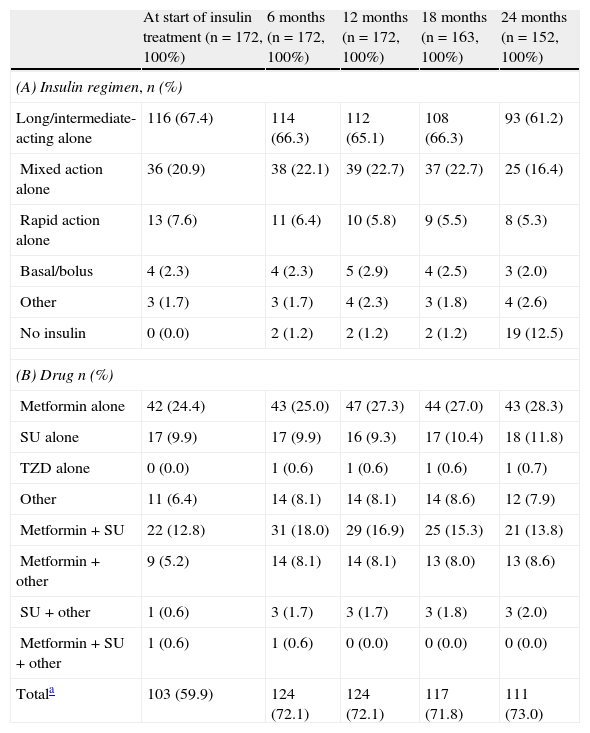
Glucose-lowering treatmentsThe distribution of insulin regimens during the observational period is shown in part (A) of Table 2. The most common regimens at study start were (i) long/intermediate-acting insulin alone, (ii) mixed insulin, and (iii) short-acting insulin alone, started in 116 (67.4%), 36 (20.9%), and 13 (7.6%) patients, respectively. At the last visit, 121 of the 152 patients who completed the 24-month follow-up period continued with their initial insulin regimen. Of these, 11 (7.2%), 6 (3.9%), and 2 (1.3%) patients who had started treatment with long/intermediate-acting insulin alone, mixed insulin, and other regimens respectively had discontinued insulin therapy by the end of the follow-up period. As shown in Fig. 1, mean daily insulin dose (SD) increased from 0.267IU/kg [0.149IU/kg] to 0.332IU/kg [0.189IU/kg] in the first 12 months of insulin therapy, and remained virtually constant thereafter.
Insulin (A) and oral anti-diabetic (B) regimens by visit.
| At start of insulin treatment (n=172, 100%) | 6 months (n=172, 100%) | 12 months (n=172, 100%) | 18 months (n=163, 100%) | 24 months (n=152, 100%) | |
| (A) Insulin regimen, n (%) | |||||
| Long/intermediate-acting alone | 116 (67.4) | 114 (66.3) | 112 (65.1) | 108 (66.3) | 93 (61.2) |
| Mixed action alone | 36 (20.9) | 38 (22.1) | 39 (22.7) | 37 (22.7) | 25 (16.4) |
| Rapid action alone | 13 (7.6) | 11 (6.4) | 10 (5.8) | 9 (5.5) | 8 (5.3) |
| Basal/bolus | 4 (2.3) | 4 (2.3) | 5 (2.9) | 4 (2.5) | 3 (2.0) |
| Other | 3 (1.7) | 3 (1.7) | 4 (2.3) | 3 (1.8) | 4 (2.6) |
| No insulin | 0 (0.0) | 2 (1.2) | 2 (1.2) | 2 (1.2) | 19 (12.5) |
| (B) Drug n (%) | |||||
| Metformin alone | 42 (24.4) | 43 (25.0) | 47 (27.3) | 44 (27.0) | 43 (28.3) |
| SU alone | 17 (9.9) | 17 (9.9) | 16 (9.3) | 17 (10.4) | 18 (11.8) |
| TZD alone | 0 (0.0) | 1 (0.6) | 1 (0.6) | 1 (0.6) | 1 (0.7) |
| Other | 11 (6.4) | 14 (8.1) | 14 (8.1) | 14 (8.6) | 12 (7.9) |
| Metformin+SU | 22 (12.8) | 31 (18.0) | 29 (16.9) | 25 (15.3) | 21 (13.8) |
| Metformin+other | 9 (5.2) | 14 (8.1) | 14 (8.1) | 13 (8.0) | 13 (8.6) |
| SU+other | 1 (0.6) | 3 (1.7) | 3 (1.7) | 3 (1.8) | 3 (2.0) |
| Metformin+SU+other | 1 (0.6) | 1 (0.6) | 0 (0.0) | 0 (0.0) | 0 (0.0) |
| Totala | 103 (59.9) | 124 (72.1) | 124 (72.1) | 117 (71.8) | 111 (73.0) |
n: number of patients; SU: sulfonylurea; TZD: thiazolidinediones.
 by visit.")
A total of 103 patients (59.95%) were prescribed at least one OAD before the start of insulin therapy, and 33 (19.2%) received two or more OADs (Table 2). More than 70% of patients were being treated with OADs at the 6, 12, and 24-month visits; the most commonly used OAD was metformin (used by at least 25% of patients at all follow-up visits) (see part B of Table 2).
Clinical resultsMean intra-individual changes (SD) in HbA1c levels from baseline seen 6, 12, and 24 months after the start of insulin treatment were −1.9% [1.65%], −1.6 [1.73%], and −1.5% [1.76%] respectively. The corresponding values for fasting plasma glucose were −3.75mmol/L [3.76mmol/L], −3.66mmol/L [3.99mmol/L], and −3.56mmol/L [4.05mmol/L], respectively. In the first two years after the start of insulin therapy, patients gained a mean of 0.23kg, corresponding to a median (Q1–Q3) of 1.0kg (−3.0 to+4.0kg) of weight, which corresponds in turn to 0.37kg/m2 (−1.14 to +1.46kg/m2) of BMI. No significant changes were seen in any other parameters during the study.
During the three months prior to the start of insulin therapy, 7% of patients experienced episodes of hypoglycemia. The proportions of patients who experienced episodes of hypoglycemia were 19.8% in the six-month period following the start of insulin therapy and 9.9% in the six to 12-month period. At the follow-up visit conducted 24 months after the start of insulin therapy, 7.9% of patients had experienced hypoglycemic episodes during the six months prior to the visit. Only three patients required hospital admission for hypoglycemia after insulin therapy was started (Table 1).
Direct healthcare costsTable 3 shows the unit costs used to calculate direct costs per patient.
Unit costs per resource unit.
| Resource | Unit cost adjusted to 2006 (€) |
| Physician visits/telephone calls | |
| PCP visit, cost per visit | 24.68 |
| Telephone call to PCP, cost per call | 16.29 |
| Visit to primary care nurse, cost per visit | 16.25 |
| Telephone call to primary care nurse, cost per call | 10.58 |
| Visit to diabetologist/endocrinologist, cost per visit | 52.65 |
| Visit to specialized care nurse, cost per visit | 27.82 |
| Visit to internal medicine/other visits for diabetes | 55.16 |
| Telephone call to specialized care nurse, cost per call | 18.36 |
| Nutritionist visit, cost per visit | 125.55 |
| Ophthalmologist visit, cost per visit | 42.02 |
| Podiatrist visit, cost per visit | 24.68 |
| Hospitalizations | |
| One-day hospital stay for acute complications of diabetes | 403.30 |
| One-day hospital stay for long-term complications of diabetes | 613.56 |
| Emergency room visit for hypoglycemia without an overnight stay | 114.26 |
| Glucose level monitoring (urine/blood) | |
| Test strip for urinary glucose | 0.25 |
| Test strip for blood glucose | 0.70 |
HbA1c, glycosylated hemoglobin; HDL, high density lipoprotein; PCP, primary care physician.
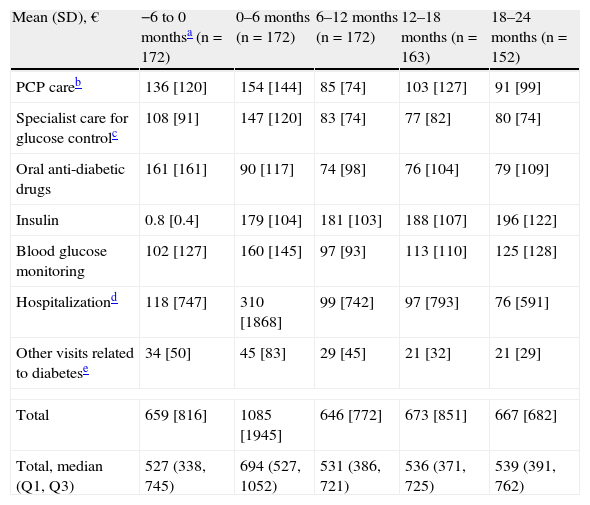
During the first six months following the start of insulin therapy, mean (median) direct treatment costs of T2DM were €1085 (€694) per patient, higher than in the six months prior to the start of insulin therapy, when mean total cost was €659 (€527) per patient. Mean direct costs decreased to €646 (€531) per patient six months later (data collected at the 12-month visit), and increased to €667 (€539) per patient at the 24-month visit (Table 4).
Cost of diabetes treatment by visit.
| Mean (SD), € | −6 to 0 monthsa (n=172) | 0–6 months (n=172) | 6–12 months (n=172) | 12–18 months (n=163) | 18–24 months (n=152) |
| PCP careb | 136 [120] | 154 [144] | 85 [74] | 103 [127] | 91 [99] |
| Specialist care for glucose controlc | 108 [91] | 147 [120] | 83 [74] | 77 [82] | 80 [74] |
| Oral anti-diabetic drugs | 161 [161] | 90 [117] | 74 [98] | 76 [104] | 79 [109] |
| Insulin | 0.8 [0.4] | 179 [104] | 181 [103] | 188 [107] | 196 [122] |
| Blood glucose monitoring | 102 [127] | 160 [145] | 97 [93] | 113 [110] | 125 [128] |
| Hospitalizationd | 118 [747] | 310 [1868] | 99 [742] | 97 [793] | 76 [591] |
| Other visits related to diabetese | 34 [50] | 45 [83] | 29 [45] | 21 [32] | 21 [29] |
| Total | 659 [816] | 1085 [1945] | 646 [772] | 673 [851] | 667 [682] |
| Total, median (Q1, Q3) | 527 (338, 745) | 694 (527, 1052) | 531 (386, 721) | 536 (371, 725) | 539 (391, 762) |
SD: standard deviation; PCP: primary care physician; n: number of patients; Q1: lower quartile; Q3: upper quartile.
Standard deviation is given in brackets.
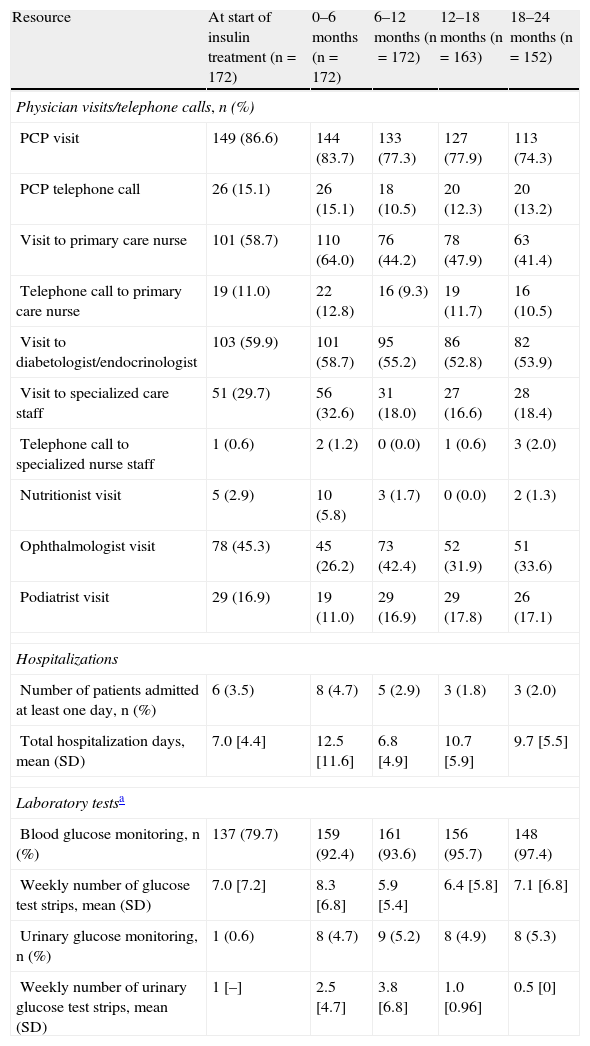
Fig. 2 breaks down the mean direct costs in the main treatment categories. During the six months prior to the start of insulin therapy, the main contributors to total cost were OADs, visits or telephone calls to primary care physicians and nursing staff, and visits to specialists for blood glucose control, which accounted for 62% of all mean direct healthcare costs. Twenty-four months after the start of insulin therapy, OADs and medical visits (primary and specialized care) accounted for 38% of the mean total cost of diabetes treatment, with insulin accounting for 29%. The mean cost of blood glucose monitoring was in turn 23% higher as compared to baseline. During the six months prior to the start of insulin therapy, the cost of blood glucose monitoring represented 15% of total mean direct healthcare costs, but this proportion increased to 19% of total costs 24 months after the start of insulin treatment. The proportion of patients who monitored their blood glucose levels increased from 79.7% to 97.4% at 24 months, while the mean monitoring frequency by patient was similar (7.0 vs 7.1 times weekly). The mean costs associated with hospital admissions accounted for 18% of mean total costs at study start, and the subsequent variation in cost was significant throughout the study but was accounted for by a small number of patients. While the mean cost associated with hospital admissions virtually tripled (from €118 to €310) in the six months following the start of insulin therapy, it decreased by 68% in the next six months. After this decrease, the mean cost related to hospital admissions was consistent and markedly lower than at study start, not exceeding 15% of the mean total direct costs per patient (Table 4 and Fig. 2). Table 5 shows data on resource utilization by visit.

Resource utilization by visit.
| Resource | At start of insulin treatment (n=172) | 0–6 months (n=172) | 6–12 months (n=172) | 12–18 months (n=163) | 18–24 months (n=152) |
| Physician visits/telephone calls, n (%) | |||||
| PCP visit | 149 (86.6) | 144 (83.7) | 133 (77.3) | 127 (77.9) | 113 (74.3) |
| PCP telephone call | 26 (15.1) | 26 (15.1) | 18 (10.5) | 20 (12.3) | 20 (13.2) |
| Visit to primary care nurse | 101 (58.7) | 110 (64.0) | 76 (44.2) | 78 (47.9) | 63 (41.4) |
| Telephone call to primary care nurse | 19 (11.0) | 22 (12.8) | 16 (9.3) | 19 (11.7) | 16 (10.5) |
| Visit to diabetologist/endocrinologist | 103 (59.9) | 101 (58.7) | 95 (55.2) | 86 (52.8) | 82 (53.9) |
| Visit to specialized care staff | 51 (29.7) | 56 (32.6) | 31 (18.0) | 27 (16.6) | 28 (18.4) |
| Telephone call to specialized nurse staff | 1 (0.6) | 2 (1.2) | 0 (0.0) | 1 (0.6) | 3 (2.0) |
| Nutritionist visit | 5 (2.9) | 10 (5.8) | 3 (1.7) | 0 (0.0) | 2 (1.3) |
| Ophthalmologist visit | 78 (45.3) | 45 (26.2) | 73 (42.4) | 52 (31.9) | 51 (33.6) |
| Podiatrist visit | 29 (16.9) | 19 (11.0) | 29 (16.9) | 29 (17.8) | 26 (17.1) |
| Hospitalizations | |||||
| Number of patients admitted at least one day, n (%) | 6 (3.5) | 8 (4.7) | 5 (2.9) | 3 (1.8) | 3 (2.0) |
| Total hospitalization days, mean (SD) | 7.0 [4.4] | 12.5 [11.6] | 6.8 [4.9] | 10.7 [5.9] | 9.7 [5.5] |
| Laboratory testsa | |||||
| Blood glucose monitoring, n (%) | 137 (79.7) | 159 (92.4) | 161 (93.6) | 156 (95.7) | 148 (97.4) |
| Weekly number of glucose test strips, mean (SD) | 7.0 [7.2] | 8.3 [6.8] | 5.9 [5.4] | 6.4 [5.8] | 7.1 [6.8] |
| Urinary glucose monitoring, n (%) | 1 (0.6) | 8 (4.7) | 9 (5.2) | 8 (4.9) | 8 (5.3) |
| Weekly number of urinary glucose test strips, mean (SD) | 1 [–] | 2.5 [4.7] | 3.8 [6.8] | 1.0 [0.96] | 0.5 [0] |
SD: standard deviation; PCP: primary care physician; n: number of patients.
Blood and urinary glucose monitoring data were collected at the respective visits, and refer to their use in the prior four weeks.
Baseline values refer to the six-month period prior to the start of insulin treatment. Means and SDs in the table are based on the corresponding data of non-missing values.
The INSTIGATE study provides data on clinical results and direct healthcare costs in patients with T2DM who start insulin therapy as part of their treatment in standard clinical practice. Data were prospectively collected over two years from the start of insulin therapy, and retrospectively for the six months prior to the start of insulin therapy. To our knowledge, this is the first study published aimed at assessing the direct mid-term costs of T2DM patients who start insulin therapy in Spain.
The study results showed that long/intermediate-acting insulin was the type most commonly prescribed, followed by mixed action insulin regimens. These two types combined account for at least 78% of all prescriptions. These findings agree with recent studies about the distribution of insulin therapies in patients with T2DM seen at primary care centers in Spain. Yurgin et al. reported that 89% of patients were prescribed intermediate-acting insulin or a combination of intermediate and rapid-acting insulin.13 As regards the metabolic control achieved, mean HbA1c and plasma glucose concentrations improved after six months of treatment with insulin as compared to study baseline and remained stable until the end of the study. However, no clear trend was seen in any other clinical parameters during the two years of follow-up. International medical associations recommend that HbA1c levels be kept below 6.7–7% in diabetic patients to decrease the risk of long-term complications.14–16 In this study, mean HbA1c levels ranged from 7.2% to 7.4% in the follow-up period, with a mean value ≥7.3%. These values are similar to those achieved in previous studies conducted in Spain, where patients with T2DM who had mean HbA1c levels<7.5% represented 56–66% of the population sample.17–19
From the financial viewpoint, the estimated costs of diabetes in Spain ranged in 2002 from €1.290 to €1476 per patient a year, i.e. 1.5 and 1.7-fold higher as compared to the costs of the nondiabetic Spanish population (€860).5 Previous studies reported a wide range of estimations of healthcare costs related to diabetes, as well as a shift over time from hospital admissions to drugs and outpatient clinics. In 1994, Hart et al. estimated a mean annual cost of 63,000 pesetas (approximately €379) per diabetic patient, with the cost associated with hospital care accounting for most direct healthcare costs (58%), followed by visits to outpatient clinics (14%), anti-diabetic drugs (13%), laboratory tests (10%), and blood glucose monitoring by patients (4.7%).20 In the López-Bastida et al. study, the direct cost per diabetic patient in the Canary Islands in 1998 was €470 (excluding drugs and interventions associated with diabetic complications), representing 62% of mean total costs.21 The CODE-2 study reported the mean annual direct costs of patients with T2DM (n=1004) as €1305 per patient.22 Antidiabetic drugs together with concomitant medication (42%), hospitalizations (32%), and visits to outpatient clinics (26%) represented the main headings. Ballesta et al. reported direct healthcare costs as high as €2504 per patient with T2DM, which accounted for 59% of the total costs associated with T2DM.23
This study showed an increase in mean (median) direct costs of T2DM treatment in the first six months after the start of insulin therapy from €659 (€527) to €1085 (€694) per patient, but the costs decreased to €646 (€531) per patient at 12 months, and to €667 (€539) per patient 24 months after the start of insulin treatment. A retrospective cohort analysis in US patients with T2DM who started treatment with insulin between 1997 and 2000 reported similar findings.24 In this study, Rosenblum et al. reported an initial increase (approximately 10%) in healthcare expenses at the start of insulin therapy, followed by a significant decrease (approximately 40%) in total healthcare expenses nine years later. The start of insulin therapy resulted in a shift in the main contributors to direct costs in Spain from visits to primary care/specialist physicians, OADs, and hospital admissions (accounting for 37%, 24%, and 18%, respectively, of mean direct costs at study start) to insulin and blood glucose monitoring, which represented 48% of the total cost per patient at the end of the observation period.
At the start of the study, when patients were being treated with OADs only, 79% of patients monitored their blood glucose levels. The proportion of patients using test strips and the weekly number of strips used also increased slightly in the period from 0 to six months as compared to study start (79.7% vs 92.4% and 7.0 [7.2] vs 8.3 [6.8] respectively). This relatively small difference may be due to the fact that the insulin regimen most commonly used in this patient sample at treatment start was long/intermediate-acting insulin alone (67.4%). In the study conducted by Costa and Huguet in Tarragona in 1994,25 52% of patients performed some type of self-monitoring, while 47% made measurements in capillary blood. In this non-interventional study, data were collected from a sample of patients with T2DM before the start of insulin therapy. Different factors may have contributed to this higher percentage of blood glucose self-monitoring. This was a poorly controlled population at the start of insulin treatment (HbA1c level of 9.0% [2.2]), which led to a therapeutic decision to progress to insulin therapy. On the other hand, the possibility that an attempt was made in the months prior to insulinization to reinforce the need to improve blood glucose control, and thus self-monitoring, cannot be ruled out. As regards the weekly frequency of the use of test strips seen in the INSTIGATE study, the Spanish Society of Diabetes26 recommends no or one (which would be closer to our finding) capillary blood glucose measurement daily in patients with T2DM treated with oral antidiabetics, depending on the type of drug and on whether control is stable or not. At study start, the costs associated with specialized care for blood glucose control increased as compared to the 0–6 month period (€108 vs €147) and subsequently decreased, probably because patients required less specialized care once an adequate insulin dose had been established, and costs decreased as a consequence (Table 4). After an increase (from €118 to €310) in the six months following the start of insulin therapy, the mean costs associated with hospital admissions decreased throughout the study (€76 at 24 months). The reasons for this may be that few patients were admitted to hospital (six at study start, eight in the period from 0 to 6 months, and three in the period from 18 to 24 months respectively) and that a small increase was seen in the hospitalization rate as compared to study start, as well as a longer mean hospital stay (7 and 12.5 days respectively), in the following six months. Mean hospital stay had decreased to 9.7 days by the end of the study period. Other potential reasons explaining the increase in costs related to short-term hospitalizations are not clear, but may include treatment noncompliance, comorbidities, or the existence of a period where patients and physicians attempt to adjust individual insulin regimens and in which hypoglycemic events are more likely to occur.
This study has several limitations. First, the centers participating in the study were not randomly selected. An adequate sample of investigators from primary care and specialized centers with a high number of patients with T2DM starting insulin therapy were enrolled. This may have introduced a bias, because the selection procedure included a specific subset of all potential investigators. Second, among the 224 patients initially recruited into this study, 52 (23.2%) were excluded from analysis because of a follow-up period shorter than 12 months and because information on study baseline values was only available for 35 of these 52 patients. However, we found nothing to suggest that the excluded patients differed from those included in the analysis. Third, since resource utilization questionnaires provided adequate information for assigning group codes related to diagnoses to hospital stays, the costs of diabetes-related hospitalizations were estimated as costs per day of stay at an endocrinology and intensive care unit or at the emergency room, as appropriate. Moreover, the direct costs associated with diabetes may have been underestimated. Since information about resource utilization was not directly collected from patients, not all the direct medical resources used may have been collected. In addition, it should be noted that data from the period before the start of insulin therapy were retrospectively collected at study start, which may have contributed to healthcare resource utilization being underestimated.
Although the overall economic impact of insulin use in patients with T2DM is already known, it needs to be confirmed in disease cost studies over longer follow-up periods. We noted a €24 increase in mean cost when costs at the start and end of the study were individually compared. Patients recruited into the INSTIGATE study in Spain who started treatment with insulin showed an improved blood glucose control as compared to baseline levels, which remained stable until study completion. It remains to be determined whether the improved blood glucose control after the start of insulinization observed in the INSTIGATE study could delay T2DM progression, thus decreasing the risk of developing complications related to diabetes and decreasing healthcare resource utilization. Additional studies are needed to investigate the potential long-term clinical and economic benefits associated with the start of an insulin therapy regimen in patients with T2DM.
ConclusionsThe INSTIGATE study provided detailed and updated data on the clinical and economic results of the first 24 months of insulin therapy in patients with T2DM in standard clinical practice in Spain. Some clinical parameters (including HbA1c) experienced improvement soon after the start of insulin therapy (six months). After increasing at six months, the direct healthcare costs related to diabetes returned to the levels seen in the six-month period preceding the start of insulin therapy. At 24 months, the costs of insulin/OADs, general/specialized medicine, and blood glucose monitoring accounted for 41%, 26%, and 19% of total costs respectively. The cost of blood glucose monitoring increased from 15% in the six months prior to the start of insulin treatment to 19% of mean total direct healthcare costs by the end of the study period. This study has several limitations. The participating centers were not randomly selected, which may have introduced a selection bias by enrolling a specific subset of all potential investigators seeing a high number of patients with T2DM starting insulin therapy. On the other hand, 23.2% of patients initially recruited into the study were excluded from the analysis because their follow-up period was shorter than 12 months and because information on study baseline values was not available for all patients. However, no differences were seen between patients excluded from and included in the analysis.
Conflicts of interestTatiana Dilla, Claudia Nicolay, María Álvarez, and Jesús Reviriego are employees of Eli Lilly & Co.
The authors thank Dr. Mónica Merito (Kendle GmbH, Germany) for her work and support in manuscript writing. The INSTIGATE study was funded by Eli Lilly & Co. and supported by Amylin Pharmaceuticals.
Please cite this article as: Dilla T, et al. Costes directos sanitarios y resultados clínicos tras el inicio del tratamiento con insulina en pacientes con diabetes mellitus tipo 2 en España: datos de 24 meses de seguimiento del estudio INSTIGATE. Endocrinol Nutr. 2013;60:224–34.
The preliminary results in Spain were presented as a poster at the 45th Annual Meeting of the European Association for the Study of Diabetes (EASD), 2009, Vienna, Austria, and at the 12th Annual European Congress of the International Society for Pharmacoeconomics and Outcomes Research (ISPOR), 2009, Paris, France.
