


To define an echocardiographically assessed cut-off point for epicardial adipose tissue (EAT) thickness associated to metabolic syndrome (MS) components in Venezuelan subjects.
MethodsFifty-two subjects aged 20–65 years diagnosed with MS according to International Diabetes Federation criteria and 45 sex- and age-matched controls were selected. Blood glucose and plasma lipids were tested; EAT thickness and left ventricular mass were measured by echocardiography.
ResultsNo significant age and sex differences were found between the two groups. Body weight, body mass index, waist circumference, and systolic and diastolic blood pressure were significantly higher (p=0.0001) in the MS group. This group showed significantly higher levels of fasting blood glucose (p=0.0001), total cholesterol (p=0.002), LDL-C (p=0.007), non-HDL-C (p=0.0001), triglycerides (p=0.0001), Tg-HDL-C ratio (p=0.0001), and lower HDL-C levels (p=0.0001) as compared to the control group. EAT thickness (p=0.0001) and left ventricular mass (p=0.017) were significantly higher in the MS group. The ROC curve showed an AUC of 0.852 (p=0.0001) with a power of the test of 0.99. A 5-mm EAT thickness showed a sensitivity of 84.62% (95% CI: 71.9–93.1) and a specificity of 71.11% (95% CI: 55.7–83.6) for predicting MS. The odds ratio of this population for experiencing MS due to an EAT ≥5mm was 8.25 (95% CI: 3.15–21.56; p=0.0001).
ConclusionAn EAT value ≥5mm has good sensitivity and specificity for predicting MS in the Venezuelan population.
Definir un punto de corte de espesor de tejido adiposo epicárdico (TAE) medido por ecocardiografía asociado con los componentes del síndrome metabólico (SM) en sujetos venezolanos.
MetodologíaSe seleccionaron 52sujetos de entre 20 y 65años con diagnóstico de SM según la Federación Internacional de Diabetes y 45controles, comparables en edad y sexo. Se midieron glucemia y lípidos plasmáticos. Se determinaron el espesor del TAE y la masa del ventrículo izquierdo mediante ecocardiografía.
ResultadosNo hubo diferencias significativas en edad y sexo entre ambos grupos, y el peso, el índice de masa corporal, la circunferencia abdominal, la presión arterial sistólica y la diastólica fueron significativamente más altos (p=0,0001) en el grupo con SM. Este grupo presentó niveles significativamente más altos de glucemia en ayunas (p=0,0001), colesterol total (p=0,002), c-LDL (p=0,007), c-noHDL (p=0,0001), triglicéridos (p=0,0001), cociente triglicéridos/c-HDL (p=0,0001) y más bajos de c-HDL (p=0,0001) que el grupo control. El espesor del TAE (p=0,0001) y la masa del ventrículo izquierdo (p=0,017) fueron significativamente mayores en el grupo con SM. La curva operador receptor (COR) demostró un AUC de 0,852 (p=0,0001), con un poder del test de 0,99. El valor de 5mm de TAE mostró una sensibilidad del 84,62% (IC 95%: 71,9–93,1) y una especificidad del 71,11% (IC 95%: 55,7–83,6) para predecir SM. La odds ratio de presentar SM en esta población por tener un espesor de TAE ≥5mm fue de 8,25 (IC 95%: 3,15–21,56; p=0,0001).
ConclusiónUn valor de TAE ≥5mm presenta una buena sensibilidad y especificidad para predecir SM en población venezolana.
Epicardial adipose tissue (EAT) evolves from brown adipose tissue during embryogenesis, and in adult age tends to be located in the atrioventricular and interventricular grooves, extending toward the apex.1 There is no fascia of similar tissues separating epicardial fat from the myocardium and even from the coronary vessels, which suggests that a significant interaction exists between these structures.1,2
EAT has a number of biochemical properties that differentiate it from other visceral fat deposits. Such properties include a high rate of free fatty acid uptake and release, which is particularly important because the myocardium uses and metabolizes fatty acids through the β-oxidation process, which accounts for 50–70% of cardiac muscle energy.3 In addition, the expression of uncoupling protein 1 (UCP1) is greater in EAT as compared to other fat deposits, which suggests that this tissue may act to protect the myocardium and the coronary arteries from hypothermia.4 However, the property that confers the greatest clinical and scientific interest in EAT is its capacity to serve as a source of adipocytokines, which may diffuse into coronary arteries through a paracrine and vasocrine secretion mechanism with beneficial or harmful effects depending on the metabolic context of the patient.2
The factors modulating the metabolic profile of EAT are currently unclear, but it has been postulated that a mechanism dependent on the mass of this tissue is the main regulator of its endocrine actions. This hypothesis has been supported by a meta-analysis including 2872 patients which showed that EAT thickness and volume were greater in subjects with coronary artery disease, and that patients in the highest EAT tertile were more prone to coronary artery disease as compared to those in the lowest tertile.5
Similarly, a recent meta-analysis including 2027 subjects, of whom 1030 had metabolic syndrome (MS), showed that EAT thickness was significantly greater in patients with MS as compared to control subjects (standardized means difference of 1.15mm, 95% CI: 0.78–1.53; p=0.0001).6 Subgroup analysis showed that this difference was independent of the criteria used to define MS, but varied according to ethnic group.6 In this regard, Iacobellis et al.7 reported in a sample of 246 Caucasian subjects in Europe that EAT thickness ≥9.5mm in males and 7.5mm in females increased both the sensitivity and specificity for predicting MS. This finding emphasizes the importance of echocardiographic measurement of EAT as a marker of visceral adiposity and a diagnostic tool of increasing value for the stratification of cardiometabolic risk. However, because of racial differences in the distribution of visceral adipose tissue, EAT and its relationship to MS should be studied in each population. Thus, our purpose was to define a cut-off point of EAT thickness, as measured by echocardiography, associated with the anthropometric, clinical, and biochemical components of MS in Venezuelan subjects.
Subjects and methodsStudy design and subjectsBased on the proposed objective, an observational, analytical, cross-sectional study was designed for which 52 consecutive subjects, 31 females and 21 males aged 20–65 years, were selected. The subjects had to meet at least three of the diagnostic criteria of MS according to the International Diabetes Federation (IDF)8: abdominal circumference (AC) ≥80cm in females and ≥90cm in males, blood pressure ≥130/80mmHg, fasting blood glucose ≥100mg/dL, plasma triglyceride levels ≥150mg/dL, and high density lipoprotein cholesterol (HDL-C) levels <50mg/dL in females and <40mg/dL in males. These subjects were compared to 45 controls, 29 females and 16 males, of similar ages with no MS. All study subjects were Venezuelan, 39 from Ciudad Bolívar, a town located in the south of the country, and 58 from Mérida, a town in the Venezuelan Andes. Subjects with primary hyperlipidemia and endocrine diseases such as diabetes mellitus, hypothyroidism, Cushing's syndrome, and acromegaly, as well as any comorbidity or who were using drugs (glucocorticoids, lipid lowering drugs, metformin, anticonvulsants, etc.) which could affect metabolic parameters were excluded from the study. The study was approved by the ethics committee of each institution and was conducted in compliance with the principles of the Declaration of Helsinki. All subjects gave their written consent to participation in the study.
Anthropometric and clinical variablesWeight and height were measured under fasting conditions and with subjects in underwear. Body mass index (BMI) was calculated as weight divided into squared height. AC was measured in centimeters, with subjects standing, at the level of a midline between the lower margin of the last rib and the iliac crests. Blood pressure was measured in the right arm after the subject had been seated for 10min by the auscultatory method, using a standard mercury sphygmomanometer.
Biochemical variablesA blood sample was drawn from the antecubital vein after subject fasting for at least 8h to measure blood glucose and lipids (total cholesterol, triglycerides, and HDL-C). Tests were performed by enzymatic methods using a Hitachi 911® autoanalyzer and Cienvar reagents. Low density lipoprotein cholesterol (LDL-C) was estimated using the Friedewald equation, where LDL-C=total cholesterol−[HDL-C+(triglycerides/5)].
Echocardiographic variablesA two-dimensional (2D) transthoracic echocardiogram using Vivid 7® equipment (GE Healthcare, Wauwatosa, USA) by the standard procedure, with patients in left lateral decubitus was performed on each subject. An electrocardiogram was simultaneously recorded in all subjects. The procedure validated by Iacobellis et al.9 was used for EAT measurement. Echocardiograms were interpreted by a cardiologist experienced in echocardiography to guarantee the validity of the measurements.
Echocardiographically, EAT was identified as the echolucent space between the external wall of the myocardium and the visceral layer of the pericardium. This thickness was measured perpendicularly on the free wall of the right ventricle at the end of systole in three cardiac cycles using a parasternal long or parasternal short axis view. The measurement was performed on the free wall of the right ventricle for two reasons: (a) this point is anatomically recognized as the one with the greatest epicardial fat thickness and (b) the parasternal long and parasternal short axes allow for more accurate measures of EAT on the right ventricle, with an optimum slide orientation in each view.10
Left ventricular mass was similarly measured in the parasternal long axis using the anatomically validated formula of Devereux et al.,11 and was subsequently indexed with the patient's body surface area.
Statistical analysisContinuous variables are given as mean±standard deviation, and categorical variables as absolute numbers and percentages. A Chi-square test was used to assess potential sex-related differences between the groups. In order to determine the difference in the means of continuous variables between subjects with and without MS, a Student's t test for independent data was applied to normally distributed variables, while a Mann–Whitney U test was used for non-normally distributed variables.
To obtain the cut-off point of EAT thickness for predicting MS in this population, the receptor operating curve (ROC) curve was constructed, for which subjects were categorized into groups with and without MS. An area under the curve (AUC) of 1 was considered optimal, while an AUC less than 0.5 was considered to have very little validity, and the power of the test for this sample size was calculated. The Youden index was used to determine the optimum cut-off point from the ROC curve, calculated with the formula YI=(sensitivity+specificity)−1. The risk (odds ratio) of having MS was determined using the epicardial fat value obtained. SPSS version 15.0 for Windows and MedCalc software version 9.3.7.0 were used for statistical analyses. A value of p≤0.05 was considered statistically significant.
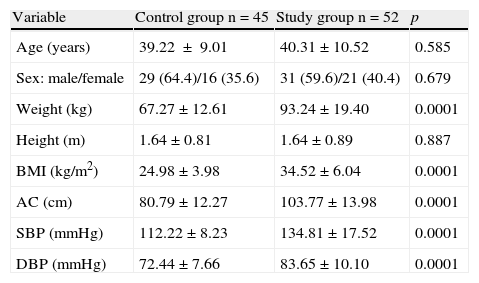
ResultsTable 1 shows the anthropometric and clinical data of the participants. The control group consisted of 45 subjects, 64.4% females and 35.6% males, with a mean age of 39.22±9.01 years and mean BMI of 24.98±3.98kg/m2. The study group consisted of 52 subjects, 59.6% females and 40.4% males, with a mean age of 40.31±10.52 years and mean BMI of 34.52±6.04kg/m2. There were no statistically significant differences in age, sex, and height between the groups, while weight, BMI, AC, and systolic (SBP) and diastolic blood pressure (DBP) were significantly higher (p=0.0001) in the MS group.
Anthropometric and clinical variables of the control and study (patients with metabolic syndrome) groups.
| Variable | Control group n=45 | Study group n=52 | p |
| Age (years) | 39.22±9.01 | 40.31±10.52 | 0.585 |
| Sex: male/female | 29 (64.4)/16 (35.6) | 31 (59.6)/21 (40.4) | 0.679 |
| Weight (kg) | 67.27±12.61 | 93.24±19.40 | 0.0001 |
| Height (m) | 1.64±0.81 | 1.64±0.89 | 0.887 |
| BMI (kg/m2) | 24.98±3.98 | 34.52±6.04 | 0.0001 |
| AC (cm) | 80.79±12.27 | 103.77±13.98 | 0.0001 |
| SBP (mmHg) | 112.22±8.23 | 134.81±17.52 | 0.0001 |
| DBP (mmHg) | 72.44±7.66 | 83.65±10.10 | 0.0001 |
AC, abdominal circumference; BMI, body mass index; DBP, diastolic blood pressure; SBP, systolic blood pressure.
Continuous variables are given as X±SD, and categorical variables as n (%).
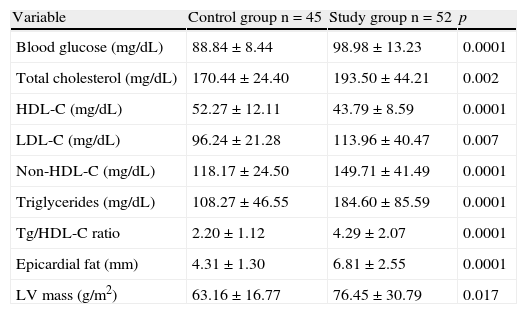
When biochemical and echocardiographic variables were compared between the participants (Table 2), the study group had, as expected, significantly higher values of fasting plasma blood glucose (p=0.0001), total cholesterol (p=0.002), LDL-C (p=0.007), non-HDL-C (p=0.0001), triglycerides (p=0.0001), and triglycerides/HDL-C ratio (p=0.0001), and lower HDL-C levels (p=0.0001) as compared to the control group. Similarly, EAT thickness (p=0.0001) and left ventricular mass (p=0.017) were significantly greater in the group of subjects with MS.
Biochemical and echocardiographic variables of the control and study (patients with metabolic syndrome) groups.
| Variable | Control group n=45 | Study group n=52 | p |
| Blood glucose (mg/dL) | 88.84±8.44 | 98.98±13.23 | 0.0001 |
| Total cholesterol (mg/dL) | 170.44±24.40 | 193.50±44.21 | 0.002 |
| HDL-C (mg/dL) | 52.27±12.11 | 43.79±8.59 | 0.0001 |
| LDL-C (mg/dL) | 96.24±21.28 | 113.96±40.47 | 0.007 |
| Non-HDL-C (mg/dL) | 118.17±24.50 | 149.71±41.49 | 0.0001 |
| Triglycerides (mg/dL) | 108.27±46.55 | 184.60±85.59 | 0.0001 |
| Tg/HDL-C ratio | 2.20±1.12 | 4.29±2.07 | 0.0001 |
| Epicardial fat (mm) | 4.31±1.30 | 6.81±2.55 | 0.0001 |
| LV mass (g/m2) | 63.16±16.77 | 76.45±30.79 | 0.017 |
HDL-C, high density lipoprotein cholesterol; LDL-C, low density lipoprotein cholesterol; Tg, triglycerides; LV, left ventricle.
Continuous variables are given as X±SD.
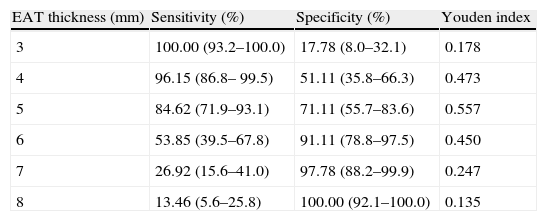
Analysis of the ROC curve (Fig. 1) showed an AUC of 0.852 (p=0.0001), which is an indication of the very high precision of the test. The power of the test for an error alpha of 0.05, a 95% confidence interval, and this sample consisting of 45 control subjects and 52 subjects with MS was 0.99. Table 3 summarizes the sensitivity and specificity of different EAT thickness values measured to predict MS. The cut-off value of 5mm obtained the highest Youden index, with 84.62% sensitivity (CI 95%: 71.9–93.1) and 71.11% specificity (95% CI: 55.7–83.6) for predicting MS in this population of Venezuelan males and females.

Sensitivity and specificity of different values of epicardial adipose tissue (EAT) thickness measured by echocardiography for predicting metabolic syndrome based on analysis of the receiver operating curve.
| EAT thickness (mm) | Sensitivity (%) | Specificity (%) | Youden index |
| 3 | 100.00 (93.2–100.0) | 17.78 (8.0–32.1) | 0.178 |
| 4 | 96.15 (86.8– 99.5) | 51.11 (35.8–66.3) | 0.473 |
| 5 | 84.62 (71.9–93.1) | 71.11 (55.7–83.6) | 0.557 |
| 6 | 53.85 (39.5–67.8) | 91.11 (78.8–97.5) | 0.450 |
| 7 | 26.92 (15.6–41.0) | 97.78 (88.2–99.9) | 0.247 |
| 8 | 13.46 (5.6–25.8) | 100.00 (92.1–100.0) | 0.135 |
Data are percentages (95% CI).
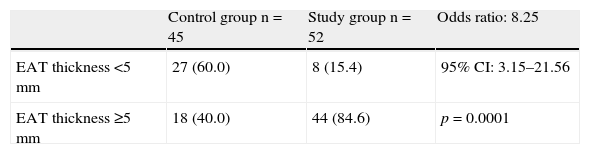
Table 4 shows the distribution of subjects in the control and study groups by EAT thickness. Most patients with MS, 84.6% (44 patients), had thickness values ≥5mm, and most control subjects, 60% (27 subjects), had values <5mm. The risk (odds ratio) of MS occurrence in this population due to EAT thickness ≥5mm was 8.25, with a 95% CI of 3.15–21.56 and a value of p=0.0001.
DiscussionThere are no prior studies in Venezuela defining the cut-off points of EAT thickness associated with the anthropometric, clinical, and biochemical changes of MS. The results of this study suggest that EAT thickness ≥5mm is associated with a risk of MS. This same cut-off value has previously been associated in another population with both morphological and functional cardiovascular changes including left atrial enlargement, increased left ventricular mass, diastolic dysfunction, and lower ejection fraction.12
Our results differ from those reported by Iacobellis et al.,7 who found in Caucasian subjects that EAT cut-off values of 9.5mm and 7.5mm increased the sensitivity and specificity for predicting MS in males and females respectively. These differences are consistent with the findings of Pierdomenico et al.,6 who showed that the difference in EAT thickness between subjects with and without MS varies depending on ethnic group, being significantly greater in Caucasian subjects, followed by Hispanic, Turkish, and Asian subjects. Alexopoulos et al.13 also found significant differences in epicardial fat volume quantified by computed tomography between Caucasian (96±44mL) and Hispanic subjects (54±17mL). The reasons for these differences are not known, but they may possibly be due to racial variability in the amount and distribution of visceral adipose tissue, as previously reported in some ethnic groups.14
Cabrera-Rego et al.15 recently found in a Cuban population that a cut-off value of epicardial fat ≥4.9mm had 85% sensitivity and 75% specificity for predicting insulin resistance (HOMA-IR index≥2.6). These results are similar to those found in our study, which may possibly be due to the fact that the Cuban and Venezuelan populations belong to the same ethnic group (Hispanic). It should be noted, however, that both studies are not fully comparable, because not all subjects with MS show insulin resistance. Moreover, Reaven16 makes a marked contrast between the terms, in that insulin resistance is considered not as identifying a particular clinical diagnosis, but as representing the biochemical expression of a pathophysiological process that increases the risk of experiencing such diverse diseases as essential hypertension, polycystic ovary syndrome, obstructive sleep apnea, and even certain forms of cancer, while MS is considered as a diagnostic tool rather than as a pathophysiological concept, and serves to identify a group of individuals (some of them insulin-resistant) at high cardiovascular risk.
The cut-off values of epicardial fat associated with other conditions have been defined. Thus, Ahn et al.17 showed that EAT thickness ≥3.0mm was independently associated with the presence of coronary artery disease in both Korean men and women, and Natale et al.18 similarly reported that EAT thickness ≥7.0mm was associated with the presence of subclinical atherosclerosis in both European men and women. Moreover, a lower EAT thickness (4.5mm) showed a good sensitivity and specificity for detecting a low coronary flow reserve in Turkish women,19 while EAT values ≥6.5mm predicted the occurrence of a hypertensive response in normotensive subjects undergoing a stress test in the same population.20
On the other hand, Iacobellis et al.21 have shown that obese subjects have greater left ventricular mass than normal subjects. This finding, also made in our study, is possibly due to an adaptive response of the left ventricle to diffuse fat deposition in subjects with MS. In addition, a significant correlation between EAT and left ventricular mass has been shown in subjects from Ciudad Bolívar.22 Several mechanisms may explain this association, including the following: (a) excess EAT represents a load for the heart, which may lead to compensatory cardiac remodeling;12 (b) an increase in EAT is associated with a greater myocardial lipid content, and thus with myocardial steatosis and lipotoxicity, which may cause adverse structural and functional adaptations, including cardiomyopathy;23,24 and (c) EAT may affect heart morphology through the local and systemic effects of the adipocytokines it synthesizes, because some of them are able to induce cardiac remodeling.2,25 Moreover, at the systemic level, EAT may induce insulin resistance, which could act as an intermediary between visceral fat and left ventricular hypertrophy through the direct mitogenic action of insulin on myocardial cells, the activation of the sympathetic nervous system, and the renin–angiotensin system.26
AC measurement is undoubtedly the most practical and inexpensive marker of visceral fat. However, this measurement may overestimate the individual risk in each subject because it includes subcutaneous adipose tissue, which is not associated with increased cardiometabolic risk,27 while echocardiographic EAT measurement is an objective, noninvasive measurement of a visceral fat deposit which has also been shown to reflect intra-abdominal visceral fat contents irrespective of the degree of obesity and age.28 EAT measurement has also been shown to be of value not only as a diagnostic tool, but also as a therapeutic target of different interventions,29–31 and since echocardiographic studies are routinely performed on subjects with cardiovascular risk, EAT may be measured at no additional cost because it requires no special preparation and can be done in the echocardiographic views (long parasternal or short parasternal) used to assess other traditional cardiac parameters.
All echocardiographic EAT measurements in this study were performed by a single observer, but most studies have shown an excellent inter-observer agreement (range, 0.90–0.98), which suggests the good reproducibility and reliability of the procedure.7,18,32 Despite this, echocardiographic EAT measurement is only a linear measurement at a single location, and may therefore not reflect the total epicardial fat volume, which should be measured using other imaging techniques such as computed tomography or magnetic resonance imaging.
In conclusion, the main contribution of this study is that it provides helpful tools for predicting MS in the Venezuelan population through the echocardiographic measurement of EAT. However, prospective studies that allow for assessing the occurrence of cardiovascular events in subjects with EAT ≥5mm are needed.
Conflicts of interestThe authors state that they have no conflicts of interest.
Please cite this article as: Lima-Martínez MM, Paoli M, Donis JH, Odreman R, Torres C, Iacobellis G. Punto de corte de espesor de tejido adiposo epicárdico para predecir síndrome metabólico en población venezolana. Endocrinol Nutr. 2013;60:570–576.
