


Obesity control and prevention is a complex task that requires a thorough understanding of the physiological basis and body composition. In Spain, as in most countries, anthropometric criteria, such as weight, height, body mass index, skinfold thickness and body circumferences have traditionally been used to define obesity and general eating disorders, but these variables have little sensitivity for monitoring response to treatment. This is why evaluation of body composition may qualify this process. The aim of this paper was to review some relatively simple techniques to assess body composition and their clinical value in patients.
El control y la prevención de la obesidad es una tarea compleja que requiere de un conocimiento profundo de las bases fisiológicas y la composición del organismo. En España, al igual que en la mayoría de los países, tradicionalmente se han utilizado criterios antropométricos, como los índices de peso, talla y el índice de masa corporal, para definir la obesidad y en general los trastornos alimentarios, pero estas variables poseen poca sensibilidad para monitorizar la respuesta al tratamiento, y es por eso que la evaluación de la composición corporal puede cualificar este proceso. El objetivo de este artículo es revisar algunas técnicas relativamente sencillas para evaluar la composición corporal y sus utilidades clínicas en los pacientes.
Analysis of body composition is an essential part of the assessment of nutritional status. In order to define body composition, it is convenient to remember that Wang et al.1 defined it as the branch of human biology dealing with the in vivo quantification of body components, quantitative relations between components, and quantitative changes in components related to influencing factors.
On the other hand, according to Valtueña et al.,2 the study of body composition is indispensable for understanding the effects of diet, physical exercise, disease and physical growth, among other environmental factors, on our body.
Body composition modelsThe adequate analysis of body composition requires the delimitation of body composition as a function of its different components, resulting in different body compositions or compartmental models. Thus, Behnke3 proposed a model for analyzing body composition based on the application of the Archimedes principle, in which body weight was represented by two main components, fat mass and fat-free mass. From this bicompartmental model, Keys and Brozek4 developed a new one. These authors divided the body into four basic components: fat mass, bone mass, water, and protein.
In 1921, Matiegka,5 considered the father of body composition, developed a model for the fractionation of body mass, the so-called four-compartment model. This model considers a composition based on four basic components: fat mass, muscle mass, bone mass, and residual mass. From the 1970s, this model was modified according to the proposals of Ross and Wilson,6 ending in the five-component model of Drinkwater7 and Kerr8 and its modification by Berral et al.9 This final five-compartment model focuses on five components or study levels with increasingly complex structures and composition.1 Thus, the first component is represented by the atomic or elementary level, consisting of elements such as oxygen (60%), carbon (20%), hydrogen (15%), and calcium and nitrogen (1% each), amongst others. A second level, also called the molecular or chemical level, consists of water (60%), lipids (15%), protein (18%), glycogen (1%), and minerals (6%). The third, or cellular, level refers to cell mass, extracellular fluids, extracellular solids, and fat. The fourth level, known as the histological or tissue level, includes elements such as skeletal muscle, non-skeletal muscle, soft tissue, adipose tissue, and bone. The fifth and last level is also known as total body level. Fig. 1 shows the multicompartmental or five-level model of body composition.

Multicompartmental or five-level model of body composition. ECF: extracellular fluid; ICF: extracellular fluid; BCM: ICF+ICS: body cell mass; FFM: fat-free mass; BLM: body lean mass; ECS: extracellular solids; ICS: intracellular solids.
The two-component or bicompartmental model is the most commonly used to analyze body composition in humans. This model assumes the division of body components into two compartments, total fat mass and fat-free mass, that is, the consideration of the two compartments at the molecular level.10 According to this model, the chemical characteristics and density of both compartments remain constant, with density for total fat mass being 0.9007g/mL at a temperature of 36°C.11 According to this model, total fat mass is anhydrous, although its degree of hydration in healthy adults is 13%, as will be seen later. Fat-free mass has a density of 1.1000g/mL at a temperature of 36°C12 and a water content of 73%, notably including a potassium concentration of 150mequiv./L.
Total fat massFor the body total fat mass represents an essential component, both as energy reserve and nerve insulator. This component may vary in subjects as a function of age and sex and over time13 (Fig. 2). Eighty-three percent of total fat mass is fat tissue, of which 50% is located subcutaneously. Fat tissue distribution in the body is irregular, with differences between the reserve fatty layer and essential fat.

Total fat mass is considered to contain no protein, but it actually accounts for 3% of fat mass. It is also thought to contain no water, but its mean hydration level in adults is 13%, a proportion that may increase in obesity. Fat mass density is 0.9007g/mL.14
In our body, reserve fat is mainly present at two levels. Subcutaneous fat accounts for 27–50% of total fat reserve in the body.15 Using direct methods (dissection of cadavers aged 55–94 years), Martín et al.16 found that for each kilogram of subcutaneous fat there were 200g of internal fat. In this regard, if the total volume of subcutaneous fat is excluded, internal fat deposits represent 667g in males and 373g in females, which indicates, according to Martín et al., that subcutaneous fat accounts for 80% of total body fat.
As regards visceral fat accumulation, it should be noted that it maintains a similar age-related exponential increase in both sexes. It is true, however, that males tend to accumulate a greater fatty layer at this level as compared to females.17 Other studies have shown a hereditary component for abdominal fat (total abdominal fat, abdominal visceral fat, abdominal subcutaneous fat) in 42–70% of cases.18
Fat-free massFat-free mass consists of minerals, protein, glycogen, and water, that is, it encompasses total intracellular and extracellular body water. Its mean hydration grade is 73%, and it has an approximate density of 1.1000g/mL at a temperature of 36°C.12 In children, fat-free mass has a lower density (1.084g/mL), partly due to an incomplete ossification process. Variations are also found in black people, who have a fat-free mass of greater density (1.113g/mL).
Hydration of fat-free mass is highly variable, that is, it does not appear to be greatly altered by race or gender. Thus, body water accounts for 55–65% of body weight, and for 73% of fat-free mass.19 Body water content increases with age. In growing children, the relationship between the extracellular and intracellular compartments also decreases by 0.4% every year (Fig. 3). Water inside cells represents the most important aqueous compartment, accounting for 30–40% of body weight and for 50–70% of total body water.19
Anthropometrics as a method to assess body composition
A wide range of procedures are available for adequately measuring the body composition of subjects. According to González-Jiménez,20 the specificity of such procedures varies. While some of them allow us to assess the composition of a single body sector, others allow us to know the characteristics and constitution of more than one organic component. By taking these measurements, and subsequently using multiple regression equations, it is possible to infer the composition and proportions of the fat and lean compartments, thus indirectly estimating the body density of subjects.
Weight and heightThese body measurements are easy to collect and very helpful in assessing nutritional status and body composition in children and adults. They are both routinely used to assess growth and in epidemiology as part of the follow-up of certain populations. The clinical value of weight and height is maximal when they are combined as indices which express in a simple way the relationship between body weight, length (height), and age.21 The three most commonly used anthropometric indices derived from weight and height are: height/age, weight/age, and weight/height.
Height for age is a helpful indicator in children that provides information about long-term exposure to adverse nutritional conditions, and is therefore useful as a method to assess a chronic nutritional deficiency. As regards the weight/age index, two standard deviations below the mean can be considered as low weight. This index makes no distinction between a child with a low height and adequate weight and a tall, thin child because this indicator does not take height into account. On the other hand, when the weight/height value is more than two standard deviations below the mean of the international reference values, this is considered as a state of emaciation.21
Weight is the result of a mixture of different tissues in variable proportions, which cannot be determined using a standard scale. To assess the meaning of weight, height, body frame size, and proportions of muscle mass, fat, and bone should be taken into account.22 Weight changes may therefore result from a change in body fat, which indirectly reflects energy intake. They may also be related to fluid retention (edema).
SkinfoldsThe quantification of body fat volume by measuring skinfolds is a highly useful method to test body composition. Because of its methodological simplicity, low cost, and non-invasive nature, it is widely used in both the clinical and epidemiological settings.23
It is a very helpful procedure for assessing the body composition of a subject. Since 27–42% of total body fat is confined to the subcutaneous level, the thickness of the subcutaneous fatty layer will optimally reflect the body composition and energy balance of the subject in the long term.24
However, because of the indirect nature of this measurement, the use of skinfolds as a method to assess body composition has a number of limitations:
- •
The subcutaneous/total fat ratio is highly variable in healthy populations.
- •
Fat deposits may remain relatively normal in subjects with moderate malnutrition.
- •
They have a low sensitivity inasmuch as changes need to be marked to be clearly reflected in measurements.
- •
The presence of edema may induce false results.
- •
An experienced examiner is needed to minimize errors in the procedure.
Despite its indirect ability to assess the fat compartment, skinfold measurements allow us to estimate the subcutaneous fat volume of the body, because a constant proportionality of subcutaneous fat to total body fat is assumed, and the locations where the measurements are made represent a mean of the total subcutaneous fat volume of the body.25 The measurement of skinfold thickness may therefore be considered as a very helpful tool to ascertain the total body fat percentage.25
Measurements are taken using a simple device called a skinfold caliper. Fat distribution is mainly assessed in six skinfolds, the tricipital, bicipital, subscapular, suprailiac, thigh, and calf skinfolds. The possibility of adding to the above a seventh skinfold, the submandibular skinfold, has been considered in recent years.
The correlation of skinfold measurements in the different anatomical regions of the subject to total body fat varies.26 Thus, the tricipital skinfold provides information about generalized and peripheral obesity, while measurement of the subscapular and suprailiac skinfolds provides data about the body fat contents at the trunk or central level.27 On the other hand, the correlation between the subscapular and tricipital skinfolds is an accurate indicator of the body fat distribution pattern and is positively correlated to lipid fraction status, its implications, and the subsequent cardiovascular risk for the subject concerned.28
Total body fat mass may be quantified by different equations using one or several skinfolds. The most widely used equations are those of Durning and Womersley,29 which require the measurement of four skinfolds, and Brook equations.30 Siri's formula,31 assuming a fat mass density of 0.9g/L and a constant fat-free mass density of 1.1g/L, is subsequently used.
Body mass indexInitially described by Adolph Quetelet in 1835 and confirmed by Keys in 1972 and by Garrow and Webster in 1985, body mass index (BMI) currently represents a helpful tool for the assessment of body adiposity and nutritional status.32
The World Health Organization recognized the clinical value of BMI and established a classification relating its values to various causes of morbidity and mortality. Thus, people have a normal weight when BMI ranges from 18.5 to 24.9; overweight or grade I obesity when BMI ranges from 25 to 29.9; grade II obesity when BMI values range from 30 to 34.9; grade III obesity when values range from 35 to 39.9; and grade IV or morbid obesity when BMI is 40 or higher.33
The use of BMI in children involves some problems because the index varies in the different phases of the development of adipose tissue.34 At birth, mean BMI is usually 13, but increases to 17 during the first year of life and continues to progress until a median BMI of 21 is reached at 20 years of age. This is why it is necessary to use standards obtained from longitudinal studies. The use of percentiles for age and sex is therefore accepted as a criterion for the classification of children based on their BMI. Thus, the 25th percentile marks the border with thinness, the 85th percentile is the limit for overweight, and values above the 95th percentile (included) define obesity states.34
According to data from the meta-analysis conducted by Okorodudu et al.,35 which assessed the value of BMI for the detection of body adiposity, BMI levels are a highly specific parameter for the diagnosis of obesity, although they are less sensitive when it comes to identifying the degree of adiposity.
In addition, BMI is helpful in predicting certain conditions and disorders such as cardiovascular conditions, and an association has been established between BMI values and some cardiovascular risk factors in adults and children, such as the increasingly common occurrence of hypertension in children and adolescents and high lipoprotein levels in blood.36
Body circumferencesMeasurements of certain body circumferences in healthy subjects provide adequate information about body composition and, ultimately, fat, muscle, and bone volumes.37 Many circumferences may be measured, including those of the arm, thigh, waist, and hip. Of these, the muscle circumference of the arm is of the greatest interest in the field of nutritional anthropometrics because it is used to assess body muscle mass and because of its correlation to protein reserve. Arm circumference is measured with a measuring tape at the equidistant point between the acromion and olecranon. Since arm circumference depends on the fat and muscle compartments, formulas have been devised to estimate the muscle and fat areas, using the Gurney and Jelliffe nomogram. Thus, the muscle area is considered to measure the protein reserve, while the fat area measures the energy reserve. These are used to calculate the muscle/fat index, the ratio between the fat and muscle areas, which results from dividing the tricipital skinfold by arm circumference.38
Another parameter of interest in subjects with overweight or obesity is the measurement of waist and hip perimeters to calculate the so-called waist–hip ratio (WHR). WHR is an accurate indicator for estimating the amount of visceral fat in an individual.39 However, it should not be forgotten that some aspects, such as gluteal muscle mass volume or subject age will somewhat decrease the accuracy of WHR as an estimator.40
Other researchers have raised doubts about the efficacy of WHR for the diagnosis of chronic conditions in children.41 By contrast, many studies have emphasized the significance of WHR for nutritional assessment in children and adolescents, as it provides information about the potential development of metabolic syndrome in the future.42 Some authors even think that the WHR has a greater predictive value than BMI for some conditions such as cardiovascular disease or diabetes in children.43
Other epidemiological studies in obese subjects have similarly established that the combination of abdominal and hip circumferences is the best discriminant factor for the detection and quantification of the risk of suffering cardiovascular disease, thus showing its greater sensitivity as compared to abdominal circumference alone.44
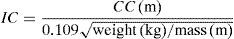
The conicity index proposed by Valdez et al.45 in 1992 is also of particular value for assessing body fat distribution. This index is used to assess fat volume in the abdominal region of adult subjects. The use and effectiveness of the conicity index in children and adolescents is still questioned. To calculate the index, the waist circumference above the umbilical level in meters, the maximum height of the subject in meters, and total body weight in kilograms are required. The conicity index considers the human body as a cylinder which has at its smaller end an index of 1.00. Its greater end would correspond to the base of two perfect cones whose wider point would be identified with the subject's abdomen, which would represent an index with a maximum value of 1.73.
In 1993, these authors showed a high correlation between the conicity index and WHR (r=0.64–0.86). As compared to the WHR, the conicity index provides information about total adiposity volume but, unlike the WHR, it does not take hip circumference into account, which according to Wardle et al.46 gives it an advantage when comparing subjects of different body builds. Despite this, however, many authors recommend a more detailed analysis of the ability of the index to assess both abdominal adiposity and its potential value for predicting cardiovascular risk in adults, adolescents, and children.47
An additional indicator of fat accumulation pattern in children is the centrality index, which correlates measurements of skinfolds in the abdominal region and limbs. The subscapular and tricipital skinfolds are most commonly measured. High scores in the centrality index suggest an android fat distribution pattern, while low values correlate to a gynoid fat distribution pattern.48
ConclusionsExcess body fat is related to cardiovascular problems such as atherosclerosis, high blood pressure, diabetes, dyslipidemia, chronic obstructive pulmonary disease, and osteoarthritis. It is therefore essential that healthcare professionals (both nurses and physicians) are trained and updated on the use of these procedures. The early detection and diagnosis of severe conditions such as obesity and their impact on health, particularly in the younger population, depends to a certain extent on the adequate management and routine use of such procedures in the population at risk.
Conflicts of interestThe author states that he has no conflicts of interest.
Please cite this article as: González Jiménez E. Composición corporal: estudio y utilidad clínica. Endocrinol Nutr. 2013;60:69–75.
