


Gestational diabetes mellitus is a significant risk factor for metabolic syndrome and cardiovascular disease.
AimsTo assess the relationships between components of the metabolic syndrome and cytokine and adhesion molecule levels in women with GDM during pregnancy and after delivery.
Patients and methodsA prospective case–control study on a sample of 126 pregnant women (63 with and 63 without gestational diabetes mellitus). In an intra-subject analysis, 41 women with history of gestational diabetes mellitus and 21 controls were re-assessed in the postpartum period. Clinical data and levels of cytokines and adhesion molecules were recorded during weeks 24–29 of pregnancy and 12 months after delivery.
ResultsIn the postpartum period, there were significantly higher levels of tumor necrosis factor alpha in both cases and controls, and of adiponectin in controls. Cases showed higher leptin levels, with no significant differences during and after pregnancy. No significant differences were seen in adhesion molecules and interleukin-6 between cases and controls during pregnancy and in the postpartum period, but levels of both were higher in cases. During pregnancy and after delivery, adiponectin decreased in cases and increased in controls. Significant positive correlations were seen between adiponectin and fasting blood glucose levels and vascular cell adhesion molecule-1, and also between leptin and tumor necrosis factor alpha levels.
ConclusionsThe results suggest that increased inflammation and transient hyperglycemia during pregnancy would represent a latent form of metabolic syndrome, with an increased risk for type 2 diabetes mellitus and future cardiovascular disease.
La diabetes mellitus gestacional es un factor de riesgo importante para el síndrome metabólico y la enfermedad cardiovascular.
ObjetivosSe evaluaron las relaciones entre los componentes del síndrome metabólico, los niveles de citocinas y moléculas de adhesión en mujeres con diabetes gestacional durante el embarazo y en el posparto.
Pacientes y métodosEstudio prospectivo de casos y controles. Se analizaron 126 mujeres gestantes (63 con diabetes mellitus gestacional y 63 controles). En el periodo posparto, se reevaluaron 41 casos y 21 controles. Se analizaron variables clínicas, niveles de citocinas y moléculas de adhesión durante las semanas 24-29 de la gestación y 12 meses después del parto.
ResultadosEn el periodo posparto, el factor de necrosis tumoral alfa en casos y controles, y la adiponectina en controles fueron significativamente más altos. Los casos mostraron mayores niveles de leptina, sin diferencias significativas durante el embarazo y después del parto. No se observaron diferencias significativas en las moléculas de adhesión y la interleucina 6 entre casos y controles durante el periodo de embarazo y el posparto, pero ambos fueron mayores en los casos. Durante el embarazo y posparto, la adiponectina disminuyó en los casos y aumentó en los controles. Observamos correlaciones positivas significativas entre adiponectina con glucemia en ayunas y moléculas de adhesión celular vascular-1, y entre leptina y factor de necrosis tumoral alfa.
ConclusionesLos resultados indican que el aumento de la inflamación y la hiperglucemia transitoria durante el embarazo representarían una forma latente de síndrome metabólico, con un mayor riesgo de diabetes mellitus tipo 2 y de enfermedad cardiovascular en el futuro.
Gestational diabetes mellitus (GDM) is defined as carbohydrate intolerance that begins, or is first recognized, during pregnancy. It complicates about 1–14% of all pregnancies worldwide. GDM mothers and their offspring are at increased risk of developing type 2 diabetes mellitus (T2DM) and cardiovascular disease (CVD). However, the mechanisms underlying these processes are unclear.1
Metabolic syndrome (MetS) is the clustering of central-trunk obesity, hypertriglyceridemia, low high-density lipoprotein (HDL) cholesterol, hypertension and dysglycemia. However, there is no consensus as to what defines MetS. Insulin resistance (IR) is proposed as the common link between the different manifestations of MetS and, as well, the cause of most of the associated abnormalities.2
Adipokines regulate glucose metabolism, insulin secretion and its activity, and fetal development. A high correlation between adiposity and IR with interleukin 6 (IL-6) concentrations has been described. High IL-6 secretion may aggravate IR in pregnancy and participate in the pathogenesis of GDM. Tumor necrosis factor alpha (TNF-α) has been used to predict GDM and its prognosis.3 TNF-α and IL-6 are involved in mechanisms that contribute to endothelial damage, including inhibition of endothelial nitric oxide synthase, vascular smooth muscle proliferation, and elevated concentrations of adhesion molecules.4 Pregnancy, such as obesity, associates a hypothalamic leptin resistance and, therefore, a rise in plasma leptin levels. However, the role of leptin in GDM is unclear.5 Adiponectin is a protein secreted exclusively by adipose tissue, with an inverse statistical correlation with MetS, together with a predictive role in the development of T2DM and atherosclerosis.6 Higher leptin, IL-6 and TNF-α with lower adiponectin levels in women with GDM compared with controls have been reported, together with low leptin, adiponectin, TNF-α and IL6 levels in offspring with macrosomia.6
Several cell adhesion molecules (AMs) are implicated in early stages of atherosclerosis development through the adhesion of monocytes to the endothelium cells. Among the AMs are: intercellular adhesion molecule-1 (ICAM-1), vascular adhesion molecule-1 (VCAM-1) and cellular molecule (E-selectin) all of which correlate with the concentrations of pro-inflammatory cytokines.7 Elevated E-selectin and VCAM-1 serum concentrations have been reported in women at risk of developing T2DM.8 This could be related to the degree of glycemic control that influences E-selectin concentrations through its effect on oxidative stress.9 Other markers of endothelial dysfunction include fibrinogen, microalbuminuria10 and hyperuricemia.11
Hence, the aim of the present study was to evaluate the levels of cytokines and AMs and CVD risk markers in women with GDM during and after pregnancy. The results could provide an insight into the pathogenesis of GDM as well as MetS.
Materials and methodsThe study protocol was approved by the ethical committee of the University Hospital Puerta del Mar, and conformed to the guidelines of the Helsinki protocol.
Subjects and inclusion criteriaThe study is prospective and case-controlled with a sample of 126 pregnant women (63 with GDM, 63 without GDM as controls). Intra-subject reassessment analysis was with 41 women with history of GDM (cases) and 21 controls, in the postpartum period.
Pregnancy evaluationWe compared a population with late-onset GDM (cases; n=63) with another sample of pregnant women with similar characteristics but without GDM (controls; n=63). Cases and controls were advised to healthy lifestyle recommendations (1750kcal per day diet and regular exercise). The patients diagnosed as having late-onset GDM were recruited between June 2007 and October 2008 from among those attending our high-risk-pregnancy clinic. The inclusion criteria were the following: normal glucose tolerance in early pregnancy, diagnosis of GDM in the 2nd or 3rd trimester of gestation according to the criteria of the National Diabetes Data Group,12 aged between 18 and 40 years, absence of any form of pre-pregnancy diabetes or family history suggestive of monogenic diabetes, BMI<40kg/m2, and absence of concomitant chronic or acute systemic diseases, or infectious. The selection of control individuals was from among pregnant women with the same characteristics, but with normal glucose tolerance (normal O'Sullivan test conducted between the 24th and 26th week of gestation).
Postpartum evaluationAn intra-subject reassessment analysis was performed at least one year postpartum with 41 cases and 21 control individuals from among those who participated in the original evaluation during pregnancy.
Experimental designWomen were informed of the characteristics and objectives of both studies (pregnancy and postpartum evaluation), before they signed fully-informed consent forms agreeing to participation in the project. Physical examination included height and weight (from which the body mass index (BMI) was calculated), waist circumference (WC) and blood pressure (BP). A venous blood sample for biochemical analyses was taken following a minimum of 8h fast. The blood was maintained at 4°C, centrifuged, plasma distributed in aliquots, and stored at −80°C until needed for laboratory analyses. Plasma glucose and insulin post-100g and post-75g oral glucose tolerance test (OGTT) were measured in pregnancy and postpartum evaluation, respectively.
Laboratory analysesPlasma glucose (mmol/L) was analyzed using the modular DPD biochemical system (Roche Diagnostics). HbA1c (% and mmol/mol) was measured using an immunoturbidimetric method for completely hemolysed-anticoagulated blood in a Cobas Integra 700 autoanalyzer (Roche Diagnostics). Plasma insulin (pmol/L) was performed by electrochemiluminescence (E-170, Roche diagnostics, Mannheim, Germany) and C-peptide (μg/L) by electrochemiluminescence (Liaison de DiaSorin, Saluggia, Italy). The HOMA index was calculated by the formula: [fasting insulin (mU/ml)×fasting glucose (mmol/L)]÷22.5. Uric acid (mmol/L), the lipid profile including total cholesterol (total-Chol, mmol/L), triglycerides (TG, mmol/L), LDL-cholesterol (LDL-Chol, mmol/L) and HDL-cholesterol (HDL-Chol, mmol/L) were quantified by enzymatic colorimetry in a modular DPD biochemical autoanalyzer. The urinary albumin/creatinine ratio (g/mol) was determined by an immunoturbidimetric test in a Cobas Integra 700 system (Roche Diagnostics). Plasma adipokine levels (TNF-α, leptin, IL-6 and adiponectin) were measured manually using commercial kits (Luminex® 100 LINCO plex Kit, St Louis, MO, USA) and expressed in pg/ml (except adiponectin which was expressed as ng/ml). Markers of vascular damage (ICAM-1, VCAM-1 and E-selectin) were measured manually using commercial kit multiplex analysis (Luminex® 100 LINCO Plex Kit, St Louis, MO, USA) and the results expressed in ng/ml.
Statistical methodsDescriptive statistics included mean, median, standard deviation (SD), standard error (SE) and ranges for quantitative variables, and percentages for qualitative variables. Associations between categorical variables-of-interest and their dependent and independent variables were determined by the Mantel-Henszel χ2 test with the Yates correction, or the Fisher test if the variable contained <5 measurements. The magnitude of association was calculated using the odds ratio (OR) and the Cornfield approximation with a 95% confidence interval (95%CI). Data from patients with previous GDM versus control individuals in the postpartum period were compared using the Student t-test and one way analysis of variance (ANOVA) for parametric variables. Non-parametric variables were evaluated with the Mann–Whitney and Wilcoxon tests. Correlations between variables were evaluated using Spearman's correlation. Independent variables were introduced into the model using the reverse stepwise method. A level of p<0.05 was accepted as being statistically significant.
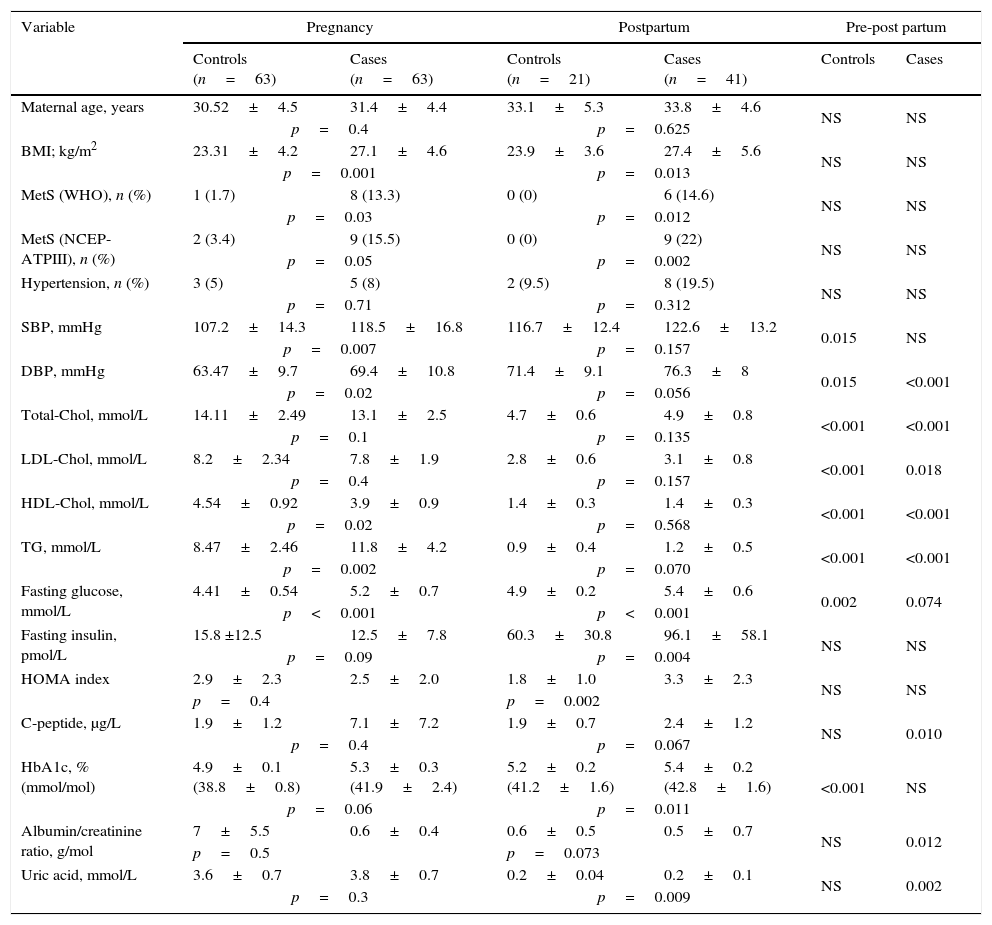
ResultsDemographic, clinical and laboratory variables of the studied population are summarized in Table 1. Treatment of GDM was diet in 68.9% and insulin in 31.1% of patients, with no significant differences in the variables analyzed.
Demographic, clinical and laboratory variables during pregnancy and the postpartum period.
| Variable | Pregnancy | Postpartum | Pre-post partum | |||
|---|---|---|---|---|---|---|
| Controls (n=63) | Cases (n=63) | Controls (n=21) | Cases (n=41) | Controls | Cases | |
| Maternal age, years | 30.52±4.5 | 31.4±4.4 | 33.1±5.3 | 33.8±4.6 | NS | NS |
| p=0.4 | p=0.625 | |||||
| BMI; kg/m2 | 23.31±4.2 | 27.1±4.6 | 23.9±3.6 | 27.4±5.6 | NS | NS |
| p=0.001 | p=0.013 | |||||
| MetS (WHO), n (%) | 1 (1.7) | 8 (13.3) | 0 (0) | 6 (14.6) | NS | NS |
| p=0.03 | p=0.012 | |||||
| MetS (NCEP-ATPIII), n (%) | 2 (3.4) | 9 (15.5) | 0 (0) | 9 (22) | NS | NS |
| p=0.05 | p=0.002 | |||||
| Hypertension, n (%) | 3 (5) | 5 (8) | 2 (9.5) | 8 (19.5) | NS | NS |
| p=0.71 | p=0.312 | |||||
| SBP, mmHg | 107.2±14.3 | 118.5±16.8 | 116.7±12.4 | 122.6±13.2 | 0.015 | NS |
| p=0.007 | p=0.157 | |||||
| DBP, mmHg | 63.47±9.7 | 69.4±10.8 | 71.4±9.1 | 76.3±8 | 0.015 | <0.001 |
| p=0.02 | p=0.056 | |||||
| Total-Chol, mmol/L | 14.11±2.49 | 13.1±2.5 | 4.7±0.6 | 4.9±0.8 | <0.001 | <0.001 |
| p=0.1 | p=0.135 | |||||
| LDL-Chol, mmol/L | 8.2±2.34 | 7.8±1.9 | 2.8±0.6 | 3.1±0.8 | <0.001 | 0.018 |
| p=0.4 | p=0.157 | |||||
| HDL-Chol, mmol/L | 4.54±0.92 | 3.9±0.9 | 1.4±0.3 | 1.4±0.3 | <0.001 | <0.001 |
| p=0.02 | p=0.568 | |||||
| TG, mmol/L | 8.47±2.46 | 11.8±4.2 | 0.9±0.4 | 1.2±0.5 | <0.001 | <0.001 |
| p=0.002 | p=0.070 | |||||
| Fasting glucose, mmol/L | 4.41±0.54 | 5.2±0.7 | 4.9±0.2 | 5.4±0.6 | 0.002 | 0.074 |
| p<0.001 | p<0.001 | |||||
| Fasting insulin, pmol/L | 15.8 ±12.5 | 12.5±7.8 | 60.3±30.8 | 96.1±58.1 | NS | NS |
| p=0.09 | p=0.004 | |||||
| HOMA index | 2.9±2.3 | 2.5±2.0 | 1.8±1.0 | 3.3±2.3 | NS | NS |
| p=0.4 | p=0.002 | |||||
| C-peptide, μg/L | 1.9±1.2 | 7.1±7.2 | 1.9±0.7 | 2.4±1.2 | NS | 0.010 |
| p=0.4 | p=0.067 | |||||
| HbA1c, % (mmol/mol) | 4.9±0.1 (38.8±0.8) | 5.3±0.3 (41.9±2.4) | 5.2±0.2 (41.2±1.6) | 5.4±0.2 (42.8±1.6) | <0.001 | NS |
| p=0.06 | p=0.011 | |||||
| Albumin/creatinine ratio, g/mol | 7±5.5 | 0.6±0.4 | 0.6±0.5 | 0.5±0.7 | NS | 0.012 |
| p=0.5 | p=0.073 | |||||
| Uric acid, mmol/L | 3.6±0.7 | 3.8±0.7 | 0.2±0.04 | 0.2±0.1 | NS | 0.002 |
| p=0.3 | p=0.009 | |||||
Data expressed as means±SD and as n (%); p=statistical significance between different groups according to the Mann–Whitney test and, in the same groups, according to the Wilcoxon test; DM, diabetes mellitus; BMI, body mass index; WC, waist circumference; MetS, metabolic syndrome; WHO, World Health Organization; NCEP-ATPIII, National Education Program Cholesterol-III Adult Treatment Panel; SBP, systolic blood pressure; DBP, diastolic blood pressure; total-Chol, total cholesterol; LDL-Chol, low density lipoprotein cholesterol; HDL-Chol, high density lipoprotein cholesterol; TG, triglycerides; OGTT, oral glucose tolerance test; HOMA index, homeostasis model assessment index; HbA1c, glycosylated hemoglobin.
In the postpartum period, diastolic BP and uric acid levels were significantly higher and glucose at 120′ post-75g, C-peptide, lipid profile and albumin/creatinine ratio were significantly lower in patients with previous GDM. Conversely, controls showed significantly higher figures of systolic BP and diastolic BP, higher levels of fasting glucose and HbA1c, and lower levels of lipids.
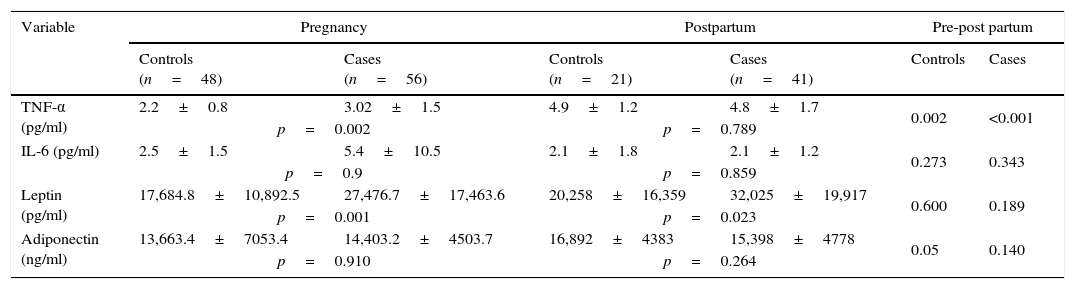
With regard to adipokines (Table 2), plasma concentrations of TNF-α were significantly higher in cases during pregnancy and in both groups in postpartum period respect to pregnancy. Leptin levels were higher in cases during gestation and postpartum period.
Profile of adipokines during pregnancy and the postpartum period in cases and control groups.
| Variable | Pregnancy | Postpartum | Pre-post partum | |||
|---|---|---|---|---|---|---|
| Controls (n=48) | Cases (n=56) | Controls (n=21) | Cases (n=41) | Controls | Cases | |
| TNF-α (pg/ml) | 2.2±0.8 | 3.02±1.5 | 4.9±1.2 | 4.8±1.7 | 0.002 | <0.001 |
| p=0.002 | p=0.789 | |||||
| IL-6 (pg/ml) | 2.5±1.5 | 5.4±10.5 | 2.1±1.8 | 2.1±1.2 | 0.273 | 0.343 |
| p=0.9 | p=0.859 | |||||
| Leptin (pg/ml) | 17,684.8±10,892.5 | 27,476.7±17,463.6 | 20,258±16,359 | 32,025±19,917 | 0.600 | 0.189 |
| p=0.001 | p=0.023 | |||||
| Adiponectin (ng/ml) | 13,663.4±7053.4 | 14,403.2±4503.7 | 16,892±4383 | 15,398±4778 | 0.05 | 0.140 |
| p=0.910 | p=0.264 | |||||
Data expressed as means±SD; p=statistical significance in different groups according to the Mann–Whitney test and in the same groups according to the Wilcoxon test; TNF-α, tumor necrosis factor alpha; IL-6, interleukin 6.
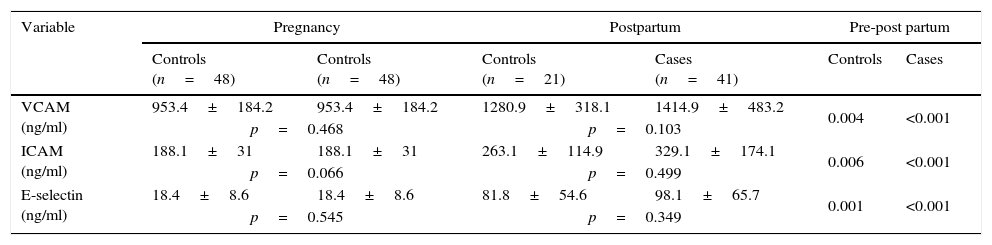
Table 3 summarizes the results of the AMs. No significant differences were observed between cases and controls during pregnancy and postpartum period. Of note is that both groups experienced significant increases of these variables in the postpartum period, the increases being higher in cases but not significantly.
Adhesion molecule profiles during pregnancy and postpartum period in cases and control groups.
| Variable | Pregnancy | Postpartum | Pre-post partum | |||
|---|---|---|---|---|---|---|
| Controls (n=48) | Controls (n=48) | Controls (n=21) | Cases (n=41) | Controls | Cases | |
| VCAM (ng/ml) | 953.4±184.2 | 953.4±184.2 | 1280.9±318.1 | 1414.9±483.2 | 0.004 | <0.001 |
| p=0.468 | p=0.103 | |||||
| ICAM (ng/ml) | 188.1±31 | 188.1±31 | 263.1±114.9 | 329.1±174.1 | 0.006 | <0.001 |
| p=0.066 | p=0.499 | |||||
| E-selectin (ng/ml) | 18.4±8.6 | 18.4±8.6 | 81.8±54.6 | 98.1±65.7 | 0.001 | <0.001 |
| p=0.545 | p=0.349 | |||||
Data expressed as means±SD; p=statistical significance between the different groups according to the Mann–Whitney test, and in the same group according to the Wilcoxon test; ICAM-1, intercellular adhesion molecule-1; VCAM-1, vascular cell adhesion molecule-1.
Analyses of variables before and after delivery in cases and controls showed some significant changes. Levels of HbA1c increased (p=0.003), while levels of total-Chol (p=0.001), LDL-Chol (p=0.006), and HDL-Chol (p=0.045) decreased in both groups; the decreases being greater in controls. Levels of adiponectin decreased in cases and increased in controls (p=0.006). In addition, levels of uric acid increased to near-significance in both groups; the increase being greater in cases (p=0.060).
Analyses of relationships between MetS parameters, cytokines and vascular damage in the total study population showed significant positive correlations of uric acid versus LDL-Chol, total-Chol and TG (r=0.288, p=0.039; r=0.308, p=0.026; and r=0.297, p=0.033, respectively), between adiponectin versus fasting glycemia and VCAM-1 (r=0.482, p=0.015; and r=0.480, p=0.008, respectively), between leptin versus TNF-α (r=0.391, p=0.005), between VCAM-1 versus ICAM-1 and E-selectin (r=0.740, p<0.001; r=0.761, p<0.001, respectively) and between E-selectin versus ICAM-1 (r=0.726; p<0.001). In addition, some significant inverse correlations were found between adiponectin versus HDL-Chol and IL-6 (r=−0.372, p=0.05; r=−0.750, p=0.032, respectively), between albumin/creatinine ratio versus ICAM-1 and E-selectin (r=−0.541, p=0.005; r=−0.442, p=0.027, respectively); and between leptin versus VCAM-1, ICAM-1 and E-selectin (r=−0.302, p=0.029; r=−0.315, p=0.023; r=−0.512, p<0.001, respectively). No other significant correlations were observed in cases and in controls.
The prevalence of obesity (defined as BMI≥30) in cases and controls in the postpartum period was 24.4% (n=10) and 4.8% (n=1), respectively (p=0.056). Table 3 summarizes the results of the possible influence of obesity on the clinical and laboratory variables measured in patients with a history of GDM. There were significant differences in levels of fasting glucose (5.9±0.8 versus 5.2±0.4mmol/L, p=0.027), fasting insulin (135.6±78.9 versus 83.2±44.5mmol/L, p=0.015), insulin at 120′ post-75g OGTT (497.2±238.9 versus 210.9±205.2mmol/L, p=0.001), HOMA index (5.1±3.5 versus 2.7±1.5, p=0.006), C-peptide (3.1±1.4 versus 2.1±1.0mg/L, p=0.032), HbA1c (5.6±0.3 versus 5.3±0.2%, p=0.002), uric acid (0.3±0.1 versus 0.2±0.05mmol/L, p=0.002), albumin/creatinine ratio (0.7±1.2 versus 0.4±0.3g/mol, p=0.643), leptin (52,630.2±21,258.2 versus 25,378.8±14,359.2pg/ml, p<0.001), adiponectin (13,167.8±2356.0 versus 16,045.8±5126.8ng/ml, p=0.024) and in the prevalence of IFG (50% versus 3.4%; p<0.001), all of which were higher in patients with obesity, except adiponectin levels, which were lower.
DiscussionOur study showed a higher prevalence of MetS in women with previous GDM, significant differences in blood pressure, uric acid levels, albumin/creatinine ratio, as well as carbohydrate, lipid, adipokine, oxidative stress and endothelial function profiles; all of which are important factors for future development of CVD.
The relationship between GDM and MetS has been widely investigated, but with conflicting results. We had recently published data indicating that women with late-onset GDM had an atherogenic lipid profile and higher carbohydrate intolerance, than controls during pregnancy13 and the postpartum period (with central-trunk adiposity, as well)14 probably related to the development of MetS. We have observed a prevalence of MetS in cases in the postpartum period that is higher than that reported by other authors15 (14.6–22% versus 9%). Regardless of MetS definition applied, three times higher prevalence of MetS have been described (differences were mainly attributed to increased BMI), and a high risk of developing T2DM and other CVD risk factors, in women with a history of GDM. Further, a recent meta-analysis16 (mean follow up from 3 months to 15 years) demonstrated that women with a history of GDM had nearly fourfold increased risk of developing MetS. We found that pre-pregnancy obesity was an independent risk factor (and the most important modifiable risk factor) in the development of GDM and carbohydrate intolerance in the postpartum period.13,14 Thus, women with prior GDM had higher risk of MetS when they had a higher BMI. Also, the risk of MetS after one to five years of follow-up was higher than after 1 year,16 a possible reason for not finding any significant differences in our study. In contrast to other authors,17,18 we found no statistically significant differences in lipid profile between cases and controls in the postpartum period. This could have been due to our short period of postpartum follow-up and the small sample size. In addition, cases and controls showed significantly lower levels of lipids in the postpartum period, probably because gestation carries a physiological, and transient, MetS. Our results are in accord with those described in the literature17 with regard to glucose metabolism. As with some reports,5 we found higher levels of fasting plasma glucose in controls in the postpartum period. Note that women with previous GDM show a marked hyperinsulinemia related to insulin resistance, common nexus with MetS, that determines the alteration of glucose metabolism, dyslipidemia, hypertension, endothelial dysfunction, inflammation, etc.
Inflammation is considered the missing link between GDM and MetS, which is associated with insulin resistance. In line with other investigators,15 we found high uric acid levels in women with previous GDM. Changes in uric acid levels in women with GDM have not been well studied despite the potential involvement in endothelial dysfunction and generalized atherosclerosis.10
Adipose tissue plays an important role in the regulation of insulin sensitivity through adipocytokines secretion. We had noted that plasma concentrations of TNF-α and leptin were higher in women with a history of GDM whereas IL-6 and adiponectin were similar compared to controls during pregnancy with no differences in postpartum, except plasma leptin levels that remained higher in cases in the postpartum period.14 These results are similar to those studies that found no difference between groups in adiponectin19 and higher levels of leptin in pregnancy and postpartum.3,20 High levels of TNF-α in pregnancy3,20 and postpartum21 together with high levels of IL-6,22 and low adiponectin levels3,23 had been described too. Serum TNF-α has been shown to be inversely related to insulin sensitivity, and has been proposed as an independent predictor of insulin sensitivity and GDM.3,24
Our previous data showed that ICAM-1, VCAM-1 and E-selectin levels were slightly higher, but not significantly so in all cases, and that ICAM-1 levels were higher in patients with greater deterioration of carbohydrate metabolism, insulin resistance and MetS.25 Significantly higher levels of ICAM-1 and VCAM-126 and also E-selectin27 have been described post-delivery in women with previous GDM. In our study, no significant differences were observed between cases and controls during pregnancy and postpartum.25 However, we did find significant increases of AMs in both groups in the postpartum period, while E-selectin and VCAM-1 decreased 12 weeks after delivery in controls and remained unchanged in GDM postpartum by Retnakaran et al.18 These data contrast with those studies that observed no differences in E-selectin levels and no correlation with insulin resistance.28 We found no conclusive studies in the literature regarding the role of AMs levels in relation to vascular and metabolic changes in women with previous GDM, and in relation to their possible involvement in future T2DM development. Nevertheless, elevated plasma concentrations of AMs have been described in T2DM29 and T1DM patients with retinopathy and nephropathy complications.30
Some limitations of the study need to be highlighted. These include the relatively small study sample size, no data on the weight gain during pregnancy, heterogeneity of duration of postpartum periods, and the lack of consensus regarding normal ranges for the variables analyzed. Other limitation is that adipokines and endothelial dysfunction were only analyzed in fasting samples. Since the majority of cases of GDM are diagnosed on the basis of an OGTT, the measurement of the variables post-OGTT would have been of considerable value. Further, there is growing evidence that the simple interpretation of fasting plasma glucose and glucose 120′ post-75g OGTT would lead to significant loss of information, while glucose 60′ post-75g OGTT has been shown to distinguish women at low or high MetS and CVD risk.26
ConclusionsOur results suggest that inflammation, adipokines and AMs could be involved in the mechanisms underlying chronic insulin resistance and hyperglycemia in GDM. It is not yet known the possible importance of higher levels of TNF-α, leptin and AMs in the postpartum period respect to pregnancy. Therefore, an appropriate time-scale during pregnancy and postpartum should be determined for GDM women to take steps to decrease their risks. Data focusing on CVD in females with a history of GDM are still lacking and, as such, studies with larger sample sizes, extended follow-up, and post-OGTT evaluations are warranted to validate our findings. A better understanding of the risks of MetS and GDM is necessary in determining the true prognostic significance of the new emerging markers of CVD and T2DM in women with previous GDM.
Conflict of interestThe authors declare that they have no conflict of interest.
Editorial assistance was by Dr. Peter R Turner. This study was financed, in part, by grants from the Andalusia Department of Health (CTS-368: PI-0525-2012; PI-405/06; PI-11/00676).
