


Increased prevalence of obesity and its comorbidities has shown the need to implement social policies to help curb this trend. Nutritional risk factors are recognized as key drivers of obesity and other chronic diseases in Spain and in other Western countries. Front-of-package labels (FoPLs) are efficient tools to help consumers make healthier choices. To be useful in purchasing situations, consumers need to understand the information provided by FoPLs. The study objective was to assess objective understanding by consumers of five types of FoPLs, i.e. Health Star Rating system (HSR), Multiple Traffic Lights (MTL), Nutri-Score, Reference Intakes (RIs), and Warning symbol in Spain.
MethodsIn 2018, 1000 Spanish participants were recruited and requested to rank three sets of label-free products (one set of three pizzas, one set of three cakes, and one set of three breakfast cereals) according to their nutritional quality in an on-line survey. Participants were then randomized to one of the five types of FoPLs, and were requested to rank the same sets of products again, this time with a given FoPL displayed on the package. Changes in ability to correctly rank products according to FoPLs were compared between both tasks using ordinal logistic regression.
ResultsFor all three food categories, Nutri-Score performed significantly better, followed by MTL, the Warning symbol, HSR and RIs.
ConclusionsNutri-Score emerged as the most efficient FoPL in conveying information on the nutritional quality of foods among Spanish consumers.
El incremento de la prevalencia de obesidad y de enfermedades asociadas conlleva la necesidad de aplicar políticas sociales que ayuden a frenar esta tendencia. El etiquetado frontal de los envases (EFE) es una herramienta eficiente para ayudar a los consumidores a tomar decisiones más saludables en el momento de la compra. Para ello es importante que los consumidores comprendan la información proporcionada por los EFE. El objetivo es evaluar en una muestra de consumidores españoles la comprensión objetiva de 5 tipos de EFE: sistema de clasificación de estrellas de salud, semáforo múltiple, Nutri-Score, ingestas de referencia y símbolo de advertencia.
MétodosEn 2018 se reclutaron 1.000 participantes españoles y se les pidió que clasificaran 3 productos por categoría, repitiendo esto para 3 categorías distintas de productos analizados anteriormente sin etiquetado (3 tipos de pizzas, 3 tipos de pasteles y 3 tipos de cereales de desayuno), de acuerdo con su calidad nutricional usando una encuesta on-line. Seguidamente, los participantes fueron asignados al azar a uno de los 5 tipos de EFE y se les pidió clasificar de nuevo los mismos productos. Se realizaron varios modelos de regresión logística multivariante.
ResultadosNutri-Score fue el sistema que mejor clasificó los alimentos según su calidad nutricional en las 3 categorías de alimentos, seguido del semáforo múltiple, el símbolo de advertencia y el sistema clasificación de estrellas de salud respecto a las ingestas de referencia.
ConclusionesNutri-Score apareció, entre los consumidores españoles, como el EFE más eficiente para transmitir información sobre la calidad nutricional de los alimentos.
In recent decades both in Spain and worldwide, the prevalence of obesity has increased exponentially, reaching epidemic levels.1,2 According to the World Health Organization (WHO), the prevention of obesity and other chronic diseases is a public health priority. The increased prevalence of obesity and associated diseases such as diabetes, arterial hypertension and dyslipidemia implies the need to apply social policies to help curb this tendency.3 In this regard, the sustained implementation of policies based on scientific evidence and the promoting of regular physical activity and healthy eating habits is important. However, it is essential for these healthy dietary options to be available, affordable and easily accessible to the entire population. This is particularly relevant in those population groups with limited financial resources and a lesser knowledge of nutrition, as they often have a lower educational level and a greater prevalence of obesity.4
In order to improve the diet of the population, one of the multiple interventions adopted by the public health authorities in the European Union is to establish nutritional labeling which provides health warnings. In this context, over the past few decades there has been an increased interest in front-of-package labels (FoPLs), with the aim of providing consumers with simple information on the nutritional quality of food, and thus facilitating the choice of foods with higher nutritional quality at the time of purchase, while also promoting the production of food products with a higher nutritional quality on the part of the food industry.3,5
Several nutritional labeling models have been used in different countries. These labels can be classified into two large groups: labeling based on specific nutrients, and labeling that offers a summary of nutritional quality. Examples of the nutrient-based approach are the multiple traffic lights (MTLs) system applied in the United Kingdom since 20056; the daily food guides developed and implemented internationally by the agri-food industry in 2006 and recently modified by the reference intakes (RIs)7; and the warning symbols applied since 2016 in Chile.8 With regard to the nutritional quality summaries approach, which takes into account the global nutritional quality of food, mention should be made of the Green Keyhole, introduced in the 1980s in Sweden and subsequently in Denmark9; the Choices logo introduced in The Netherlands in the year 200010; the Health Star Rating (HSR) used in Australia since 201411; and the Nutri-Score system adopted in France in 2017, in Belgium in 2018, and probably also soon in Spain.12
Scientific research suggests that the use of logos in the FoPLs, by summarizing the nutritional information, reduces the cognitive effort and the time needed to mentally process the label content, potentially helping consumers to identify healthier food options and thus constituting an additional strategy to help reduce chronic diseases. However, this only applies to the extent that the information provided can be clearly understood by the consumer.13
Therefore, in order for public health authorities to recommend a specific FoPL, taking into account the sociocultural context, it is necessary to ensure that the labeling is truly useful for consumers and that its validity is contrasted with existing labels. The present study was therefore designed to assess the specific results relating to the objective understanding of 5 types of FoPLs (HSR, MTL, Nutri-Score, RI and warning symbols) in a sample of the Spanish population included in the Front-of-Pack International Comparative Experimental study, conducted in 12 countries.14
Material and methodsA total of 1000 participants were recruited in Spain from a web panel of an ISO accredited international provider (PureProfile) using quota sampling based on gender, age and income level.
The study involved an experimental, comparative, two-phase randomized design.
The participants were exposed to three food product categories (pizzas, cakes and breakfast cereals) with great variability in their nutritional quality and commonly consumed in Spain, and to three different products in each of the categories.
These foods were presented with “fake containers” in the form of fictitious brands (Stofer), and were used to prevent other factors such as familiarity, fidelization or consumption habits from interfering with the evaluation of the product.
In a first phase, the participants were asked to classify, at their own discretion, the nutritional quality of the three different products, and to do so for each of the categories (pizzas, cakes and breakfast cereals), as follows: “1. High nutritional quality”; “2. Intermediate nutritional quality”; “3. Low nutritional quality”; and “4. I don’t know.” In this first phase, all products of the three categories were presented to the participants without front labeling.
In a second phase, the participants were randomized to one of the 5 FoPLs: HSR, MTL, Nutri-Score, RI or warning symbols, and were asked to again classify the different products of each food category (pizzas, cakes and breakfast cereals), but this time the products carried the FoPL logo assigned to them. Fig. 1 shows the example of one of the three categories of products used (breakfast cereals with its three products), with the 5 evaluated FoPLs.

The study protocol was approved by the Institutional Review Board of the French Institute for Health and Medical Research (IRB Inserm no. 17-404) and the Ethics Committee for Human Research of the University of Curtin, France (approval reference: HRE2017-0760).
Statistical analysisThose participants who claimed to never or only very rarely purchase at least two of the three food categories were considered non-eligible.
For each participant and food category, the number of correct answers was calculated for tasks to be performed without a logo and with FoPL. An answer was considered correct when the participant correctly classified the nutritional quality of the three products in each category, while an incorrect answer was recorded when one or more of the products in the category were misclassified. For each participant, we calculated the changes in the number of correct answers to the three product categories between the situations without and with the logo that had been assigned to the participant at random.
The calculation yielded a score between −1 (a worsening) and +1 (an improvement), with 0 indicating that no changes had occurred between the two situations. The sum of the scores of the three food categories obtained by the participants could range within an overall score from −3 to +3.
Different multivariate ordinal logistic regression models were generated to evaluate the association between the different FoPLs and the changes in the ability to correctly classify the products of the three food categories between the situations without and with the logo. The RI logo was used as a reference in the multivariate logistic regression models because on the one hand it is the logo used at the European level, and on the other hand it is far from being intuitive and indeed stands out for its low and even ineffective level of comprehension.12 The adjustment variables included gender, age, educational level, household income, involvement in food purchase, and the self-assessment of knowledge regarding nutrition and food quality of the participant. The methodology has been published elsewhere.14
Sensitivity analyses were performed, with those participants who at the end of the questionnaire stated that they had not seen the FoPL assigned to them during the study being excluded.
Evaluation was made of the potential interactions between the different FoPLs and the individual characteristics of the participants regarding their ability to correctly classify the products of the different food categories.
The statistical analyses were performed using the SAS version 9.3 statistical package (SAS Institute Inc., Cary, NC, USA). Statistical significance was considered for p≤0.05.
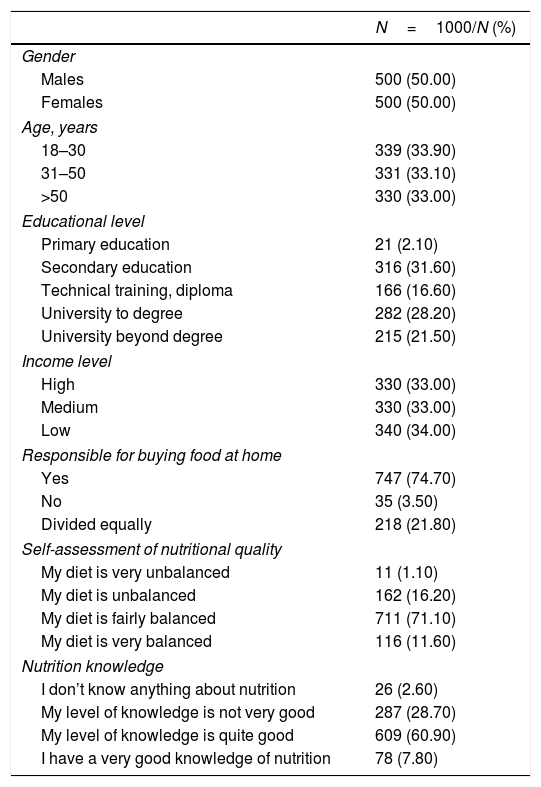
ResultsTable 1 shows the individual characteristics of the Spanish population sample included in the study. Fifty percent of the sample consisted of females; 33% of the participants were over 51 years of age; 28% were university graduates; 34% had a low income level; and 75% were responsible for buying food for the home. Seventy-one percent reported a fairly balanced diet, and 61% claimed to be fairly well-informed regarding nutrition.
Description of the study population.
| N=1000/N (%) | |
|---|---|
| Gender | |
| Males | 500 (50.00) |
| Females | 500 (50.00) |
| Age, years | |
| 18–30 | 339 (33.90) |
| 31–50 | 331 (33.10) |
| >50 | 330 (33.00) |
| Educational level | |
| Primary education | 21 (2.10) |
| Secondary education | 316 (31.60) |
| Technical training, diploma | 166 (16.60) |
| University to degree | 282 (28.20) |
| University beyond degree | 215 (21.50) |
| Income level | |
| High | 330 (33.00) |
| Medium | 330 (33.00) |
| Low | 340 (34.00) |
| Responsible for buying food at home | |
| Yes | 747 (74.70) |
| No | 35 (3.50) |
| Divided equally | 218 (21.80) |
| Self-assessment of nutritional quality | |
| My diet is very unbalanced | 11 (1.10) |
| My diet is unbalanced | 162 (16.20) |
| My diet is fairly balanced | 711 (71.10) |
| My diet is very balanced | 116 (11.60) |
| Nutrition knowledge | |
| I don’t know anything about nutrition | 26 (2.60) |
| My level of knowledge is not very good | 287 (28.70) |
| My level of knowledge is quite good | 609 (60.90) |
| I have a very good knowledge of nutrition | 78 (7.80) |
Compared to the absence of the logo, the Nutri-Score was the FoPL exhibiting a significantly greater increase in correct answers. This was observed for all products. In the pizzas category, the correct answers increased from 88 to 133 in the presence of the logo, corresponding to a 51% increment. In the cakes category, the correct answers increased from 24 to 85 in the presence of the logo, corresponding to a 254% increment. In the breakfast cereals category, the correct answers increased from 58 to 109 in the presence of the logo. Fig. 2 shows the percentages of correct answers referring to the other FoPLs. All the FoPLs improved the percentage of correct answers when compared to the non-labeled situation, though the results differed according to food category. The results of the percentages of correct answers under the two labeling conditions for each randomized FoPL group are shown in Fig. 2.

Percentage of correct answers in the sample studied, with the increase between the options without and with the front-of-package labels, corresponding to each labeling group and food category.
FoPL: front-of-package label; HSR: Health Star Rating System; MTL: Multiple Traffic Lights; RI: Reference intake, without front-of-package labeling.
When asked whether they had seen the FoPL assigned to them, 57% of the participants said that they had seen it, 27.5% said that they had not seen it, and 15% were in doubt. Fig. 3 shows the sensitivity analyses limited to the subgroup of participants who recalled having seen the FoPL on the packages. The results showed use of the Nutri-Score to result in greater improvement in the assessment of the nutritional quality of the products evaluated. The exception was the pizzas category, where MTL and Nutri-Score yielded similar results. Table 2 shows the results of the association of the different FoPLs with the ability to correctly classify the products. For the three food product categories, and compared to the reference labeling (RI), the Nutri-Score was associated with a significantly greater increase in the ability to correctly classify the products, followed by MTL, warning symbols and HSR.

Percentage of correct answers among the participants that recalled seeing the logo, with the increase with respect to the non-labeled situation, according to front-of-package labeling and food category.
FoPL: front-of-package label; HSR: Health Star Rating system; MTL: Multiple Traffic Lights; RI: Reference intake, without front-of-package labeling.
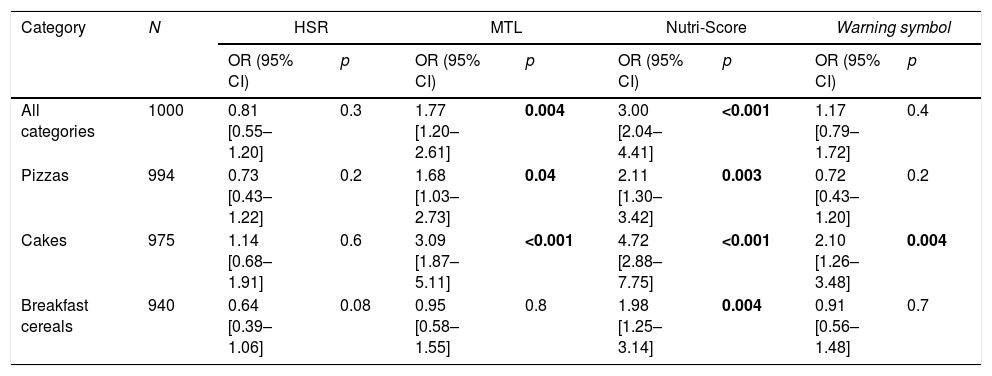
Associationa between the different front-of-package labels and change in the ability to correctly classify products between the non-labeled and labeled situations.
| Category | N | HSR | MTL | Nutri-Score | Warning symbol | ||||
|---|---|---|---|---|---|---|---|---|---|
| OR (95% CI) | p | OR (95% CI) | p | OR (95% CI) | p | OR (95% CI) | p | ||
| All categories | 1000 | 0.81 [0.55–1.20] | 0.3 | 1.77 [1.20–2.61] | 0.004 | 3.00 [2.04–4.41] | <0.001 | 1.17 [0.79–1.72] | 0.4 |
| Pizzas | 994 | 0.73 [0.43–1.22] | 0.2 | 1.68 [1.03–2.73] | 0.04 | 2.11 [1.30–3.42] | 0.003 | 0.72 [0.43–1.20] | 0.2 |
| Cakes | 975 | 1.14 [0.68–1.91] | 0.6 | 3.09 [1.87–5.11] | <0.001 | 4.72 [2.88–7.75] | <0.001 | 2.10 [1.26–3.48] | 0.004 |
| Breakfast cereals | 940 | 0.64 [0.39–1.06] | 0.08 | 0.95 [0.58–1.55] | 0.8 | 1.98 [1.25–3.14] | 0.004 | 0.91 [0.56–1.48] | 0.7 |
HSR: Health Star Rating system; CI: confidence interval; MTL: Multiple Traffic Lights; OR: odds ratio.
Reference Intakes was used as reference for the multivariate logistic regression models. The multivariate models were adjusted for: gender, age, educational level, household income, involvement in food purchase, self-assessment of nutrition knowledge and nutritional quality.
The values in boldface correspond to significant values after multiple test corrections (p≤0.05).
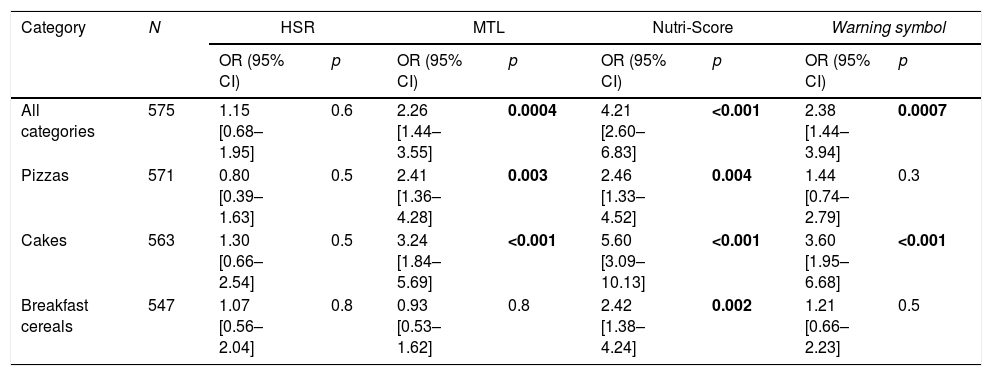
Table 3 shows the results of the association of the different FoPLs with change in the ability to correctly classify the products among the participants who recalled having seen the logo. For the three food categories, the Nutri-Score was associated with a significantly greater increase in the ability to correctly classify the products versus the RI. The warning symbol ranked behind the Nutri-Score in the cakes category and behind the MTL in the pizzas category.
Associationa between the different front-of-package labels and change in the ability to correctly classify products between the non-labeled and labeled situations, among those participants that noted the logo.
| Category | N | HSR | MTL | Nutri-Score | Warning symbol | ||||
|---|---|---|---|---|---|---|---|---|---|
| OR (95% CI) | p | OR (95% CI) | p | OR (95% CI) | p | OR (95% CI) | p | ||
| All categories | 575 | 1.15 [0.68–1.95] | 0.6 | 2.26 [1.44–3.55] | 0.0004 | 4.21 [2.60–6.83] | <0.001 | 2.38 [1.44–3.94] | 0.0007 |
| Pizzas | 571 | 0.80 [0.39–1.63] | 0.5 | 2.41 [1.36–4.28] | 0.003 | 2.46 [1.33–4.52] | 0.004 | 1.44 [0.74–2.79] | 0.3 |
| Cakes | 563 | 1.30 [0.66–2.54] | 0.5 | 3.24 [1.84–5.69] | <0.001 | 5.60 [3.09–10.13] | <0.001 | 3.60 [1.95–6.68] | <0.001 |
| Breakfast cereals | 547 | 1.07 [0.56–2.04] | 0.8 | 0.93 [0.53–1.62] | 0.8 | 2.42 [1.38–4.24] | 0.002 | 1.21 [0.66–2.23] | 0.5 |
HSR: Health Star Rating system; MTL: Multiple Traffic Lights; OR: odds ratio; CI: confidence interval.
Reference Intakes was used as reference for the multivariate logistic regression models. The multivariate models were adjusted for: gender, age, educational level, household income, involvement in food purchase, self-assessment of nutrition knowledge and nutritional quality.
The values in boldface correspond to significant values after multiple test corrections (p≤0.05).
No interactions were observed with respect to gender, age, educational level, income level, involvement in food purchase, and the self-assessment of nutrition knowledge and food quality of the participants.
DiscussionThis is the first study which demonstrates in the Spanish population the superiority of the Nutri-Score FoPL in helping consumers to better classify the nutritional quality of food products. Compared to the RI (the reference FoPL), the Nutri-Score showed a greater increase in the ability to correctly classify the products, followed by MTL, warning symbols and HSR. The results corresponding to the other FoPLs differed according to the category of the products evaluated.
These results are consistent with those previously obtained in France15,16 and with those observed in the other 11 countries of the Front-of-Pack International Comparative Experimental study.14 This superiority was shown in all categories regarding age, gender, educational level and socioeconomic status. Given these results, two main characteristics appear to influence understanding among Spanish consumers: the use of colors known for their meaning, and the fact of informing about overall nutritional quality instead of specific data per nutrient. The FoPLs associated with the greatest increase in objective understanding were the Nutri-Score and MTL, which are the only FoPLs of the 5 considered in the study that are expressed with colors. The second element of an FoPL that may influence and increase understanding of the nutritional quality of a product is the fact of offering a summary rather than simply providing data according to nutrients. In fact, of the two color logos, the Nutri-Score summarizing logo yielded significantly better results than MTL, which refers to specific nutrients. This observation is consistent with previous results showing that consumers understand summarizing labels better17–19 than per nutrient labeling, since they minimize possible confusion related to interpretation of the nutritional terms (e.g., saturated fats, sugar, sodium, etc.).20
The Nutri-Score, by summarizing the nutritional information, reduces the cognitive effort required and the time required to process the labels, thereby allowing for the easier interpretation of the information provided.16,21 While the MTL logo provides 5 different specific nutrient information elements, the Nutri-Score appears to be a more effective tool for influencing consumer choice at the moment of purchase, when decisions are usually made very quickly.18 For these reasons, the added value of the Nutri-Score regarding objective comprehension is the use of properly interpretable colors, as well as its simple, intuitive, summarizing and gradual design that is comprehensible to all consumers.
In addition to its interest in helping consumers to recognize the nutritional quality of food and guide their shopping choices toward healthier foods, a recent study has shown the superiority of the Nutri-Score over other logos (MTL and the Evolved Nutrition Label [ENL], a logo recently proposed by a consortium of 5 large multinationals)22 in reducing the size of food portions considered to be less healthy.23 The results of our study show that the Nutri-Score, and to a lesser extent MTL, allows for reducing the size of portions of products considered less favorable to health, thus helping consumers to improve their identification of the overall quality of their diet. This latter aspect is particularly interesting and positive from a public health point of view. By contrast, the ENL, with the same graphic format as MTL but calculated per serving and not per 100g of food, was found to have a limited and even unfavorable impact on the size of the portions selected by the participants in relation to the studied product categories. This suggests that the ENL could lead to a potential increase in the size of the portions of foods for which small amounts are advised. In conclusion, in our study the Nutri-Score appears to be the most effective FoPL for transmitting information about nutritional quality of food to Spanish consumers. It may therefore be a useful tool in terms of public health, since it helps consumers guide their purchasing choices, so improving their nutritional status and preventing chronic diseases resulting from inadequate nutrition.
AuthorshipAll the authors contributed to the design, analysis and interpretation of the results, and to the writing and critical review of the manuscript. ME, JC, SH and SP contributed to data collection. Analysis and interpretation of the results were performed primarily by ME, CJ, SH, PG, NB and JS-S. The critical review of the article was the contribution mainly of ME, CJ, SH, PG, NB, JS-S and SP. All the signing authors have approved the final version of the manuscript.
FundingThis study received funding from Santé Publique France (the French Public Health Agency) and Curtin University.
Conflicts of interestThe authors declare that they have no conflicts of interest.
The authors thank Mr. Mark Orange for creating the specific brands and packaging for the study. Thanks are also due to all the investigators, especially Zenobia Talati, and to the doctoral students that participated in the study.
Please cite this article as: Galan P, Egnell M, Salas-Salvadó J, Babio N, Pettigrew S, Hercberg S, et al. Comprensión de diferentes etiquetados frontales de los envases en población española: resultados de un estudio comparativo. Endocrinol Diabetes Nutr. 2020;67:122–129.
