


To examine the triglyceride/glucose index (TyG) as an insulin resistance marker in obese children and adolescents and its relation to clinical and biochemical parameters, body composition and lifestyle.
Patients and methodSixty patients aged 7–16 years of age were enrolled. Anthropometric variables were recorded, together with pubertal stage, blood pressure and body composition assessed by bioimpedance. The TyG index was calculated as ln (fasting glucose (mg/dL) × triglycerides (mg/dL))/2 and the HOMA (homeostatic model assessment) index as fasting insulin (μU/mL) × fasting glucose (mmol/L)/22.5. Feeding habits were documented by adherence to the Mediterranean dietary pattern questionnaire, while physical activity was assessed using the International Sedentary Assessment Tool (ISAT), as well as accelerometry (Actigraph wGT3X+).
ResultsThe mean TyG index was 4.45 ± 0.18, and proved higher in the pubertal group. We found a positive correlation with the HOMA index (r = 0.39; P = 0.03) and TG/HDL-c index (r = 0.53; P < 0.001). The best cut-off point of the TyG index for predicting insulin resistance was 4.21 in prepubertal children (sensitivity 84%, specificity 100%; AUC: 0.84) and 4.33 in pubertal children (sensitivity 89%, specificity 69%; AUC: 0.61). A positive correlation was found with screen time (r = 0.39; P = 0.01), as well as a negative correlation with caloric expenditure (Kcal/day) in the prepubertal group (r = −0.81; P = 0.005).
ConclusionsThe TyG index could be a useful insulin resistance marker in the pediatric population. Moderate to vigorous physical activity should be encouraged, as well as restricting screen time for leisure purposes, mainly in the prepubertal group.
El objetivo es estudiar el índice triglicéridos/glucosa (TyG) como marcador de insulinorresistencia en niños y adolescentes obesos y su relación con otros parámetros clínicos, analíticos, composición corporal y hábitos de vida.
Pacientes y métodosFueron incluidos 60 pacientes obesos de 7 a 16 años. Se recogieron variables antropométricas, estadio puberal, tensión arterial y composición corporal por bioimpedanciometría. El índice TyG se definió como: ln (glucosa en ayunas [mg/dL] × triglicéridos [mg/dL])/2 y el índice HOMA (homeostatic model assessment): insulinemia (μU/mL) × glucemia (mmol/L)/22,5. Los hábitos de alimentación fueron recogidos a través de la encuesta de calidad de dieta mediterránea, mientras que los de actividad física lo fueron por el International Sedentary Assesment Tool (ISAT) así como acelerometría (Actigraph wGT3X+).
ResultadosLa media del índice TyG fue 4,45 ± 0,18, mayor en puberales. Encontramos una correlación positiva con el índice HOMA (r = 0,39; p = 0,03) y el índice TG/c-HDL (r = 0,53; p < 0,001). El mejor valor como punto de corte del índice TyG para determinar insulinorresistencia fue de 4,21 en pacientes prepuberales (sensibilidad 84%, especificidad 100%; ABC: 0,84), y de 4,33 en puberales (sensibilidad 89%, especificidad 69%; ABC: 0,61). Se objetivó una correlación positiva con el tiempo de pantalla (r = 0,39; p = 0,01) así como una correlación negativa con el gasto calórico (kcal/día) en pacientes prepuberales (r = −0,81; p = 0,005).
ConclusionesEl índice TyG podría utilizarse como marcador de insulinorresistencia en la población infantil. Se debe fomentar que la actividad deportiva sea de moderada a vigorosa intensidad, así como limitar el tiempo de pantalla dedicado al ocio, especialmente en población prepuberal.
The prevalence of childhood obesity has been increasing in recent decades due to changes in diet and lifestyle. In Spain, an estimated 23.2% of children are overweight and an estimated 18.1% are obese.1 This temporal trend has stabilised and even decreased in recent years, probably thanks to different social policies as well as earlier detection and treatment by paediatricians.2 The development of information and communication technologies and their widespread use at increasingly younger ages contribute to the fact that sedentary lifestyle and screen time associated with leisure are nowadays key points in the management of obesity.
From the very early years of life, children are already showing metabolic abnormalities that predispose them to cardiovascular disease in the future. One of these is insulin resistance, a central feature of metabolic syndrome. Different clinical and biochemical markers related to insulin resistance have been used over the years, but many require expensive techniques and are not very reproducible in day-to-day practice, such as the hyperinsulinaemic-euglycaemic clamp (considered the gold standard) and measurement of different cytokines. It is important to broaden knowledge of markers in order to enable any doctor to easily and inexpensively identify obese patients with higher metabolic risk so these patients can receive specialised care.
In recent years, several studies have been published on the triglyceride/HDL-cholesterol (TG/HDL-c) ratio in children, with variability in terms of ethnicity and age. In general, this marker has a positive correlation with the Homeostasis Model Assessment (HOMA) and baseline blood insulin levels, so it could be a good predictor of type 2 diabetes mellitus and metabolic syndrome.3,4 With regard to the triglyceride and glucose (TyG) index, studies conducted in adults show modest correlations with the HOMA index, although correlations are good compared to the hyperinsulinaemic-euglycaemic clamp.5 There are few references in the literature to this index in the paediatric population, and it is difficult to extrapolate it to a Spanish setting as these references are so heterogeneous, with different ethnicities, different ages, different stages of puberty, etc. Although it seems to be a good predictor of insulin resistance, more data are needed to consider it a good marker that identifies patients at higher risk. Therefore, the TyG index and its association with other variables, including lifestyle-related ones, must be studied in a Spanish population.
For years, it has been known that there is a relationship between sedentary lifestyle and/or less moderate/vigorous physical activity and increased adiposity and insulin resistance. To measure these habits, different questionnaires completed by the family or the patient about the patient's usual activity levels are widely used. However, these tests are not the most reliable and should be supplemented with an objective method such as accelerometry.
In view of the above, the aim of our study was to assess the TyG index as a potential marker of insulin resistance in a population of obese children and adolescents, as well as its association with other clinical, laboratory, body composition and lifestyle parameters.
Patients and methodsSixty patients 7–16 years of age referred to the Children’s Endocrinology clinic in 2019 for obesity took part in the study. Those with monogenic or syndromic obesity, chronic disease or prior treatment that could interfere with the study parameters and the obligation to remain at rest for medical reasons were excluded in advance.
Puberty stage was determined according to the Tanner stages (I–V). Weight was measured using Seca scales (precision of 100 g) and height was measured using a Seca stadiometer (precision of 1 mm). Body mass index (BMI) (kg/m2) was calculated using the formula weight/height.2 Obesity was considered to be a BMI above two standard deviations (SD) according to the Hernández et al. reference graphs for age and sex.6 Waist circumference was measured using a non-stretchable measuring tape (precision of 1 mm) with the patient standing, at the end of a normal expiration, with arms relaxed on each side, at the midpoint between the last rib and the iliac crest. Body composition was analysed by bioelectrical impedance using a Tanita TBF300 monitor (TANITA, Middlesex, United Kingdom) on an empty stomach, with no physical activity in recent hours and wearing underwear. Systolic and diastolic blood pressure were determined by taking three measurements with the Dynamap XL device and averaging them, using the values published in Pediatrics 2004 by the National High Blood Pressure Education Program (NHBPEP) working group as reference values.7
Eating habits were assessed using the KIDMED questionnaire, a Mediterranean Diet Quality Index, with true/false answers and scores ranging from 0 to 12 (the higher the score, the better the diet quality). Information about physical activity and sedentary behaviour both on weekdays and on weekends was obtained in two ways: first, using questionnaires such as the International Sedentary Assessment Tool (ISAT) and second, using an objective method such as triaxial accelerometry, performed using an Actigraph wGT3X+ (49 E. Chase St; Pensacola, FL 32502; United States), which the patient wore on their wrist for six days, two of which were either weekend days or holidays. This accelerometer provides measurements of physical activity including: raw acceleration, energy expenditure, ratios of working metabolic rate to resting metabolic rate (metabolic equivalents of task [METs]) and intensity of physical activity. METs measure the metabolic expenditure of an activity (<1.5 METs: sedentary; 1.5–3 METs: light; 3–6 METs: moderate; >6: strenuous/very strenuous).
Laboratory determinations were all made in our hospital's laboratory between 8:00 AM and 9:00 AM after fasting for at least 12 h. Insulin was measured by electrochemiluminescence immunoassay on a Cobas 601 autoanalyser (Roche) and glucose was measured using a glucose oxidase method on a modular 6000 autoanalyser (Roche) along with the rest of the general clinical chemistry parameters. The oral glucose tolerance test (OGTT) was performed with a dose of 1.75 g/kg body weight (maximum 75 g). The HOMA index was defined as blood insulin (μU/mL) × blood glucose (mmol/l)/22.5; and the quantitative insulin sensitivity check index (QUICKI) was defined as 1/(log fasting insulin [μU/mL] + log fasting glucose [mg/dl]). The TG/HDL-c ratio was determined with the triglyceride (mg/dl)/HDL-c (mg/dl) ratio. The TyG index was calculated using the following formula: ln [fasting glucose (mg/dl) × triglycerides (mg/dl)]/2. The SDs of insulin, the HOMA index and the QUICKI were calculated from the reference values for our population.8 Insulin resistance was considered to be a HOMA index ≥2 SDs according to sex and puberty stage.
Statistical analysisQualitative variables of frequency were expressed in terms of percentages and quantitative variables were expressed in terms of mean ± SD. These were compared with the corresponding statistical test (chi-squared test, Student's t test or analysis of variance [ANOVA]) and correlations were examined using Spearman's rho. The sensitivity and specificity of the cut-off point of the TyG index for the diagnosis of insulin resistance was established using receiver operating characteristic (ROC) curves, taking into account the area under the curve (AUC) to determine the accuracy of the test. Data analysis was performed with the SPSS ver. 21.0 statistical program. A p value <0.05 was considered statistically significant.
Consent and confidentialityAfter the study was approved by our hospital's Independent Ethics Committee, informed consent was requested from the parents or guardians of the patients before starting the study. Patients who were older children also signed the informed consent form. The study was conducted with a commitment to respect the updated Declaration of Helsinki on ethical principles for medical research. Personal data were processed anonymously and always in accordance with the data protection principles set out in the new European General Data Protection Regulation legislation of 25 May 2018.
ResultsA total of 60 patients took part in the study (51.7% female and 48.3% male). The mean age was 12.1 (±2.14 years) and their ages ranged from 7.4 to 15.7 years of age. Of them, 26.7% were prepubertal (Tanner I). The mean BMI was 28.58 kg/m2 (±3.37), while their z-score was +3.88 SDs (±1.27) (range: 2.02–7.07 SDs), with no statistically significant differences in relation to sex. When these data were assessed taking into account whether or not the patients were pubertal, a higher degree of obesity was found in prepubertal patients (+4.61 SDs ±1.65) than in adolescent patients (+3.61 SDs ±0.99) (p = 0.006).
The mean waist circumference was 94.16 cm (±10.56), being above p95 for age and gender in 100% of cases, with no differences between sexes. With regard to body composition, we found greater lean mass in males (46.9 kg ± 11) than in females (40.5 kg ± 8.7) (p = 0.01) and in adolescents (47.0 kg ± 9.5) than in prepubertal children (33.8 kg ± 4.4) (p < 0.001).
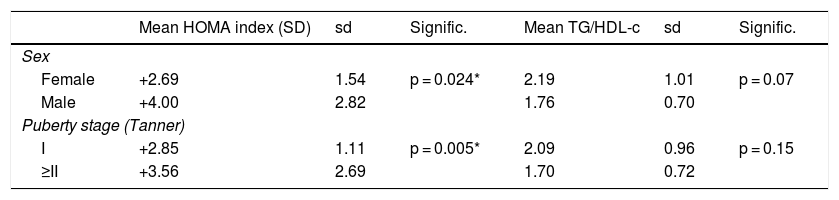
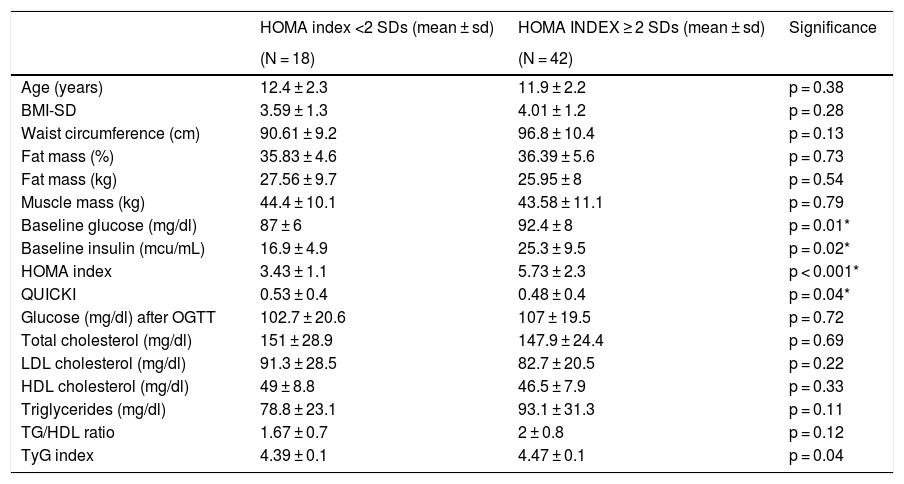
As for laboratory findings, no statistically significant differences were found in relation to sex. Prepubertal children had lower insulin levels, HOMA index scores and QUICKI scores in absolute values. The TG/HDL-c ratio was 1.99 ± 0.91, with no significant differences in relation to sex or puberty stage. The results are shown in Table 1. Different clinical and laboratory parameters were also compared depending on whether or not the patients presented insulin resistance (HOMA index ≥2 SDs) (Table 2).
Standard deviations of the HOMA index and TG/HDL-c ratio according to sex and puberty stage.
| Mean HOMA index (SD) | sd | Signific. | Mean TG/HDL-c | sd | Signific. | |
|---|---|---|---|---|---|---|
| Sex | ||||||
| Female | +2.69 | 1.54 | p = 0.024* | 2.19 | 1.01 | p = 0.07 |
| Male | +4.00 | 2.82 | 1.76 | 0.70 | ||
| Puberty stage (Tanner) | ||||||
| I | +2.85 | 1.11 | p = 0.005* | 2.09 | 0.96 | p = 0.15 |
| ≥II | +3.56 | 2.69 | 1.70 | 0.72 | ||
SD: standard deviations; sd: standard deviation.
Anthropometric and laboratory parameters depending on the presence or absence of insulin resistance (HOMA index ≥2 SDs).
| HOMA index <2 SDs (mean ± sd) | HOMA INDEX ≥ 2 SDs (mean ± sd) | Significance | |
|---|---|---|---|
| (N = 18) | (N = 42) | ||
| Age (years) | 12.4 ± 2.3 | 11.9 ± 2.2 | p = 0.38 |
| BMI-SD | 3.59 ± 1.3 | 4.01 ± 1.2 | p = 0.28 |
| Waist circumference (cm) | 90.61 ± 9.2 | 96.8 ± 10.4 | p = 0.13 |
| Fat mass (%) | 35.83 ± 4.6 | 36.39 ± 5.6 | p = 0.73 |
| Fat mass (kg) | 27.56 ± 9.7 | 25.95 ± 8 | p = 0.54 |
| Muscle mass (kg) | 44.4 ± 10.1 | 43.58 ± 11.1 | p = 0.79 |
| Baseline glucose (mg/dl) | 87 ± 6 | 92.4 ± 8 | p = 0.01* |
| Baseline insulin (mcu/mL) | 16.9 ± 4.9 | 25.3 ± 9.5 | p = 0.02* |
| HOMA index | 3.43 ± 1.1 | 5.73 ± 2.3 | p < 0.001* |
| QUICKI | 0.53 ± 0.4 | 0.48 ± 0.4 | p = 0.04* |
| Glucose (mg/dl) after OGTT | 102.7 ± 20.6 | 107 ± 19.5 | p = 0.72 |
| Total cholesterol (mg/dl) | 151 ± 28.9 | 147.9 ± 24.4 | p = 0.69 |
| LDL cholesterol (mg/dl) | 91.3 ± 28.5 | 82.7 ± 20.5 | p = 0.22 |
| HDL cholesterol (mg/dl) | 49 ± 8.8 | 46.5 ± 7.9 | p = 0.33 |
| Triglycerides (mg/dl) | 78.8 ± 23.1 | 93.1 ± 31.3 | p = 0.11 |
| TG/HDL ratio | 1.67 ± 0.7 | 2 ± 0.8 | p = 0.12 |
| TyG index | 4.39 ± 0.1 | 4.47 ± 0.1 | p = 0.04 |
Metabolic syndrome was diagnosed in 5% of the patients (three cases) according to International Diabetes Federation (IDF) criteria, although 33.3% overall had at least one of the metabolic/cardiovascular abnormalities: 13.3% had fasting blood glucose ≥100 mg/dl, 5.4% had triglycerides ≥150 mg/dl, 13.3% had HDL ≤ 40 mg/dl and 6.6% had systolic blood pressure ≥130 mmHg. None of the patients had diastolic blood pressure ≥85 mmHg, impaired glucose tolerance or diabetes after the OGTT.
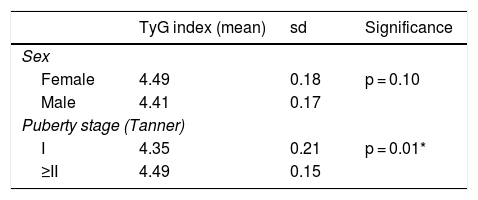
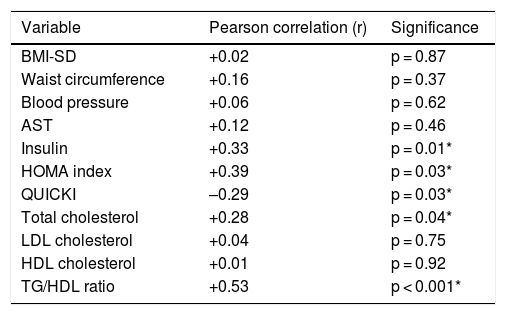
TyG index as a marker of insulin resistanceThe mean TyG index was 4.45 ± 0.18 (range: 3.94–4.80). No differences were found in relation to sex, but differences were found in relation to puberty (Table 3). When the TyG index was compared to other laboratory parameters, a significant positive correlation was found with insulin levels, the HOMA index, total cholesterol and the TG/HDL-c ratio, and a significant negative correlation was found with the QUICKI (Table 4).
Mean TyG index according to sex and puberty stage.
| TyG index (mean) | sd | Significance | |
|---|---|---|---|
| Sex | |||
| Female | 4.49 | 0.18 | p = 0.10 |
| Male | 4.41 | 0.17 | |
| Puberty stage (Tanner) | |||
| I | 4.35 | 0.21 | p = 0.01* |
| ≥II | 4.49 | 0.15 | |
sd: standard deviation.
Correlation between the TyG index and other clinical and laboratory parameters.
| Variable | Pearson correlation (r) | Significance |
|---|---|---|
| BMI-SD | +0.02 | p = 0.87 |
| Waist circumference | +0.16 | p = 0.37 |
| Blood pressure | +0.06 | p = 0.62 |
| AST | +0.12 | p = 0.46 |
| Insulin | +0.33 | p = 0.01* |
| HOMA index | +0.39 | p = 0.03* |
| QUICKI | –0.29 | p = 0.03* |
| Total cholesterol | +0.28 | p = 0.04* |
| LDL cholesterol | +0.04 | p = 0.75 |
| HDL cholesterol | +0.01 | p = 0.92 |
| TG/HDL ratio | +0.53 | p < 0.001* |
When the ROC curves were analysed, it was estimated that the best cut-off point for the TyG index for predicting insulin resistance would be 4.21 in prepubertal children (sensitivity 84%, specificity 100%; AUC: 0.84) and 4.33 in adolescents (sensitivity 89%, specificity 69%; AUC: 0.61). With these results, in our population, 74% of prepubertal children and 82% of adolescents would have insulin resistance. Considering the second formula used in other publications, ln (fasting glucose [mg/dl] × triglycerides [mg/dl]/2), we would obtain a cut-off point of 7.86 for prepubertal children (sensitivity 92%, specificity 100%; AUC: 0.96) and 8.19 for adolescents (sensitivity 72%, specificity 54%; AUC: 0.70).
TyG index in relation to lifestyle habits and physical activityA positive correlation was found overall between the TyG index and screen time (tablets, mobile phones, video games, etc., excluding television) reported in the questionnaires completed on weekdays (r = 0.39; p = 0.01), such that significant differences were found between those who spent ≥1.5 h/day (TyG 4.53 ± 0.8) and those who spent <1.5 h/day (TyG 4.42 ± 0.1) (p = 0.03). A positive correlation was also observed between the TyG index and hours spent doing homework/reading books at home on weekdays in prepubertal patients (r = 0.67; p = 0.02). No relationship was found with the KIDMED score or with days of physical activity at school or after school.
When the accelerometry data were analysed, a good negative correlation was found between the TyG index and calorie expenditure (kcal/day) in prepubertal patients (r = −0.81; p = 0.005). The TyG index was higher in children with a mean activity on weekdays <3 METs/day (TyG: 4.56 ± 0.15) than in those who with a mean of ≥3 METs/day (TyG: 4.21 ± 0.16), although these differences were not statistically significant (p = 0.07). In this same group of patients, a positive correlation was found with the percentage of sedentary activity (r = 0.61; p = 0.04). The findings in adolescent patients were not significant except for a negative correlation between the TyG index and sedentary activity (r = −0.52; p = 0.006) as well as light activity on weekends (r = −0.43; p = 0.01).
DiscussionThe findings of our study show the usefulness of the TyG index as a marker of insulin resistance in obese children and adolescents. They also identify a relationship with other metabolic risk factors, including eating habits and physical activity.
Simental-Mendía et al. were the first to propose the TyG index as a useful parameter for measuring insulin resistance in view of the results they obtained in normal-weight and obese adult patients compared to the hyperinsulinaemia-euglycaemia clamp, considered the gold-standard test for this purpose.5,9 Many subsequent studies have analysed the same in the adult population, but have compared the TyG index to other parameters of insulin resistance, the most widely used being the HOMA index. A systematic review in adult patients published in 2020 concluded that the evidence to confirm the usefulness of this index as a biochemical marker is of moderate to low quality, mainly due to the lack of a standardised definition and the great deal of heterogeneity between the different studies.10 The main problem lies in the interpretation of the formula to obtain the TyG index: while in the publications of the authors who proposed the method used the formula ln (fasting glucose [mg/dl] × triglycerides [mg/dl]/2), other authors who subsequently analysed this index used the formula ln (fasting glucose [mg/dl] × triglycerides [mg/dl]/2), resulting in disparate values. In our study, we performed the analysis using the formula of the original group, although we also obtained the cut-off points with the second formula proposed in order to be able to make comparisons to other publications.
In recent years, interest has grown in examining the TyG index in the paediatric population. Two studies have compared it to the hyperinsulinaemia-euglycaemia clamp. The first was conducted in healthy and obese Mexican patients, both prepubertal and pubertal (TyG cut-off points: 4.65 and 4.70, respectively). The second was conducted only in pubertal obese children of different ethnicities (TyG: 8.3). Both found a moderate correlation between the two tests.11,12
As in other studies, we compared the TyG index to other parameters of insulin resistance such as baseline blood insulin levels and the HOMA index, the latter being the most commonly referenced in the literature. We found a moderate positive correlation, similar to that published in prior studies, with correlation coefficients of 0.38–0.46.13–16 We did not find differences in the TyG index in relation to sex, but we did find differences according to puberty stage; pubertal patients had a higher TyG index than prepubertal patients. This was consistent with the higher degree of insulin resistance (higher HOMA-SD) found in pubertal patients. Apart from a study by Rodríguez-Morán et al., which provided different cut-off points for the TyG index according to puberty,11 no other studies in the literature have taken this aspect into account. However, we consider it an important factor, given that triglyceride levels are not the same in both groups. Another factor to take into consideration is ethnicity. Lower TyG index levels have been found in black people compared to white and Asian people, possibly due to the fact that black people normally have lower levels of triglycerides than other ethnic groups.12,17 All this is regardless of BMI, with which a good correlation has not been found. In fact, it should be noted that despite the higher degree of obesity according to the BMI-SD of our prepubertal patients, we found greater insulin resistance compared to the reference values in pubertal patients. It is difficult to compare the cut-off points obtained with the ROC curves between different studies, partly because of the above-mentioned formula problem. In our case, it seemed to be a more valid test for prepubertal than pubertal patients and our cut-off values were lower than those reported by Rodríguez-Morán et al. in their study in a Mexican population, but similar to those reported by Calcaterra et al., an Italian group.11,15
Insulin resistance is one of the first metabolic complications that occurs in obese children. Indeed, in our study, most patients had insulin resistance, at a rate much higher than those of other abnormalities such as dyslipidaemia or high blood pressure. One explanation may be the relationship between abdominal obesity, a factor in all our patients, and a decrease in insulin sensitivity. This is important because we would be able to detect these initial abnormalities in obese children and adolescents using the TyG index, even from primary care. This would allow specialised interventions to be made early, which could perhaps prevent progression to metabolic syndrome. Various studies have demonstrated the usefulness of the TyG index as a marker of metabolic syndrome in both adult and child populations.18–20 It has also been assessed as a possible marker for abnormal glucose metabolism in children, being a good test for diabetes screening but yielding less certain results for prediabetic states.21,22 In our case, the small sample of patients with these diseases did not allow us to analyse them. It is difficult to explain why we found a rate of metabolic syndrome of only 5% in our sample compared to the results of other similar populations, in which rates thereof vary widely. However, the answer may lie not in BMI severity, but in adiposity. We found no correlation between blood pressure levels and this index, but to date this matter is largely unstudied in children and adolescents and those studies that have been conducted have yielded variable results.23,24 We were able to show a positive correlation between the TyG index and the TG/HDL-c ratio, also used as a marker of insulin resistance, metabolic syndrome and cardiovascular risk.3,25
Another of our objectives was to assess the possible relationship between eating habits, physical activity and sedentary lifestyle and the TyG index. These variables are usually collected through surveys. However, as there is a demonstrated difference between what patients estimate and what they actually do,26 methods need to be as objective as possible. Therefore, in addition to validated surveys, we collected information on physical activity using a triaxial accelerometer that patients wore both on both weekdays and weekends.
Regarding Mediterranean diet quality, no differences were found when the TyG index was analysed according to the score obtained. A better system to corroborate whether or not there is a relationship with diet would be to weigh the patients' food on a daily basis, but we decided that it would be difficult for families to comply with this. Looking at physical activity, children and adolescents with an average daily metabolic rate higher than three METs, considered moderate activity, had a lower degree of insulin resistance than those with values lower than three METs. This supports the importance of regular moderate-to-intense physical exercise in the paediatric population with the aim of preventing metabolic complications of obesity, among other things. This intensity of physical activity is normally achieved through supervised exercises more than through games in the park, walks, etc., so it is important to stress not only the role of educational centres but also the responsibility of families in encouraging such activities. When we compared the HOMA index and the TyG index to the number of days per week of physical exercise according to questionnaires, we found no significant differences. It is therefore important to stress exercise intensity, perhaps even more than the number of days of sporting activities. This is consistent with a systematic review by Ekelund et al., who concluded that duration of moderate-to-vigorous physical activity has a greater influence on metabolic risk factors than sedentary time.27
We also found a negative correlation between the TyG index and calorie expenditure (kcal/day) and a positive correlation between the TyG index and the percentage of sedentary activity in prepubertal children. These same findings were not seen in pubertal patients, perhaps because their activity is more variable, particularly on weekends. In fact, in this group we found a moderate negative correlation between the TyG index and sedentary activity on weekends (the more sedentary the patient, the lower the TyG index), which was somewhat contradictory. One possible explanation could be that patients who had worse metabolic complications, being older and aware that they were being monitored, may have altered their usual activity during the week they were wearing the accelerometer. In any case, there seemed to be a better correlation between markers of insulin resistance and physical activity in prepubertal patients than in pubertal patients. The only study to compare the TyG index with lifestyle habits was a study conducted by Vieira-Ribeiro et al. in 402 Brazilian children four to seven years of age in which the researchers found a significant relationship between the TyG index on the one hand and physical activity and adiposity on the other hand (the higher the TyG index, the lower the physical activity, measured by surveys, and the greater the adiposity).28
With respect to sedentary lifestyle calculated by accelerometry as an independent risk factor in insulin resistance, the literature presents inconclusive results in both adult and child populations and more prospective studies are needed to define this association.29 Our study found a positive correlation in prepubertal patients between the TyG index and duration of sedentary activity and, more specifically, between the TyG index and the amount of screen time for leisure purposes (tablets, mobile phones, etc.). Hence, it is important for families to control the time children spend using new technologies.
One of the limitations of our study was the modest number of patients analysed. Another was the difficulty of extrapolating the results to the child populations in other countries, due to the influence of ethnicity on metabolic variables, as both BMI and parameters of insulin resistance were calculated based on our reference population. Added to that was the fact that lifestyle data from surveys may have been better than data from real life; data collection through surveys remains a subjective method, and the data obtained by accelerometry may have been biased by the Hawthorne effect, as patients were aware they were being monitored.
In conclusion, the TyG index could be used as a marker of insulin resistance in the child population. It would enable paediatricians to determine, out of all obese children and adolescents, those at higher risk of metabolic complications and to start more intensive and specialised follow-up. Families should be encouraged to adopt healthy lifestyles, with a particular emphasis on the fact that sporting activity must be moderate to vigorous in intensity. They should also be encouraged to limit screen time for leisure purposes, especially in the prepubertal population.
FundingThis study was partially funded through a grant awarded in the X Convocatoria Proyectos de Investigación Santander [10th Santander Research Project Call for Proposals] of the Fundación Universidad Alfonso X El Sabio [Alfonso X El Sabio University Foundation]. Spain. Project 1010938.01.
Conflicts of interestThe authors declare that they have no conflicts of interest.
Please cite this article as: Sánchez-Escudero V, García Lacalle C, González Vergaz A, Mateo LR, Marqués Cabrero A. El índice triglicéridos-glucosa como marcador de insulinorresistencia en población pediátrica y su relación con hábitos de alimentación y actividad física. Endocrinol Diabetes Nutr. 2021;68:296–303.
