


The CDKAL1 (CDK5 Regulatory Subunit Associated Protein 1 Like 1) gene encodes cyclin-dependent kinase 5 (CDK5) regulatory subunit-associated proten1 like 1. This protein has been shown to contribute to the glucose-dependent regulation of insulin secretion in pancreatic islets.
AimsThe aim of our study was to analyze the effects of the rs7756992 genetic variant of CDKAL1 gene on fasting glucose and insulin resistance after weight loss secondary to partial meal replacement hypocaloric diet (pMRHD).
MethodsThis was a non-randomized, single-treatment study with a formula-diet in 44 obese subjects. The patients received nutritional education and a modified diet with two intakes of a normocaloric hyperproteic formula for 3-months. Anthropometric parameter and biochemical profile were measured at basal time and after 3 months. The variant of CDKAL1 gene rs7756992 was assessed.
ResultsThe following genetic distribution was observed; [27AA (61.3%), 12 AG (27.3%) and 5 GG (11.4%)]. After the pMRHD, body weight, the body mass index (BMI), fat mass, waist circumference and blood pressure decreased in both genotypes. Non-G allele carriers showed a significant improvement in fasting glucose levels (AA vs. AG + GG) (−6.1 ± 1.4 md/dl vs. −1.2 ± 0.7 mg/dl; p = 0.01), fasting insulin levels (−3.6 ± 0.2 mU/l vs. −1.3 ± 0.6 mU/l; p = 0.02) and HOMA-IR (−1.2 ± 0.2 units vs. −0.3 ± 0.2 units; p = 0.01). Fasting plasma glucose levels were higher in G allele carriers than non G allele carriers.
ConclusionsOur data suggest that the genetic variant (rs7756992) of CDKAL1 gene is associated with glycaemic status after a pMRHD, with greater improvements in fasting glucose, insulin and HOMA-IR in subjects without the G allele.
El gen CDKAL1 (proteína 1 asociada con la subunidad reguladora CDK5 1) codifica el gen proten1 asociado con la subunidad 5 dependiente de la quinasa 5 dependiente de ciclina (CDK5). Esta proteína ha demostrado contribuir a la regulación dependiente de glucosa de la secreción de insulina en islotes pancreáticos.
ObjetivosEl objetivo de nuestro estudio fue analizar los efectos de la variante genética rs7756992 del gen CDKAL1 sobre la glucosa en ayunas y la resistencia a la insulina, tras la pérdida de peso secundaria a la dieta hipocalórica con reemplazo parcial de comidas (pMRHD).
MétodosEl diseño fue no aleatorizado de un solo brazo de tratamiento con una dieta de fórmula en 44 sujetos con obesidad. Los pacientes recibieron educación nutricional y una dieta modificada con dos ingestas con una fórmula hiperproteica normocalórica durante tres meses. Los parámetros antropométricos y el perfil bioquímico se midieron en el tiempo basal y después de tres meses. Se evaluó la variante del gen CDKAL1 rs7756992.
ResultadosSe observó la siguiente distribución genética; (27AA [61,3%], 12 AG [27,3%] y 5 GG [11,4%]). Después de la pMRHD, el peso corporal, el índice de masa corporal (IMC), la masa grasa, la circunferencia de la cintura y la presión arterial disminuyeron en ambos genotipos. Los no portadores del alelo G mostraron una disminución significativa en los niveles de glucosa en ayunas (AA vs. AG + GG) (−6,1 ± 1,4 mg/dL vs. −1,2 ± 0,7 mg/dL; p = 0,01), niveles de insulina en ayunas (−3,6 ± 0,2 mU/L vs. −1,3 ± 0,6 mU/L; p = 0,02) y HOMA-IR (−1,2 ± 0,2 unidades vs. −0,3 ± 0,2 unidades; p = 0,01). Los niveles de glucosa en ayunas fueron más altos en los portadores del alelo G que en los no portadores del alelo G.
ConclusionesNuestros datos sugieren que la variante genética (rs7756992) del gen CDKAL1 está asociada con el estado glucémico después de una pMRHD, con una mejoría significativa de la glucosa en ayunas, la insulina y el HOMA-IR en sujetos sin alelo G.
Obesity is a growing pandemic. In addition, type 2 diabetes mellitus (T2DM) has traditionally been understood as a consequence of metabolic syndrome induced by insulin resistance secondary to obesity. Global prevalence of obesity is 12%,1 while in Spain it is 22%.2 The cornerstone of obesity treatment options is a low calorie diet with exercise, with the goal of achieving clinically significant weight loss of at least 5%–10%. Even this relatively small amount of weight loss can reduce the risk of developing T2DM and insulin resistance, and protect beta cell function. There is evidence that partial meal replacement hypocaloric diets (pMRHDs) are helpful in inducing weight loss. An interesting meta-analysis3 comparing partial meal replacement programmes with traditional energy-restricted food-based diets showed that pMRHDs produced a 7% loss in body weight, compared to 3% in traditional diets.
There are metabolic pathways that link obesity, T2DM and worsening beta cell function. The CDKAL1 gene (CDK5 regulatory subunit-associated protein 1-like 1) in chromosome 6p22.3 encodes the protein associated with the cyclin-dependent kinase 5 (CDK5)-regulatory subunit.4 This 65 kD protein shares amino acid homology with CDK5RAP1, an inhibitor of CDK5 activation.5 CDK5 plays a major role in neuronal development,6 but is also involved in various activities outside the brain.7 It has been demonstrated that this protein contributes to glucose-dependent insulin secretion regulation in pancreatic islets.8 The mechanism consists of phosphorylating the L-type voltage-gated Ca2+ channel in Ser783, thus inhibiting Ca2+ influx into beta cells and insulin secretion.9 Since excessive CDK5 activity is associated with loss of beta cell function and reduced insulin secretion under high glucose conditions, negative regulation of CDK5 mediated by CDKAL1 would benefit normal functioning of beta cells. Lastly, CDKAL1 variants associated with this decrease in beta cell function have shown a significant association with T2DM in Caucasians.10,11 For example, the single nucleotide polymorphism (SNP) rs7756992 (c.371 + 30,101 A > G) showed an odds ratio (OR) of 1.09 for G allele carriers to develop T2DM.12
In obese subjects with T2DM, a previous study13 showed that the rs7756992 genetic variant of theCDKAL1 gene is associated with drug response to a DPP-4 inhibitor. However, there are no studies in the literature with dietary intervention with significant weight loss evaluating the effect of this SNP on glycaemic metabolism.
The objective of our study was to analyse the effects of the rs7756992 genetic variant of the CDKAL1 gene on fasting glucose and insulin resistance, after weight loss secondary to pMRHD in subjects with obesity but without T2DM.
MethodsStudy designDuring the patient recruitment period (January 2018 to September 2019), written informed consent was obtained from each eligible patient. This intervention study was approved by our Ethics Committee (HCUVA Committee 07/2018), in accordance with the Declaration of Helsinki. The patients were informed of their right to withdraw from the study without compromising their treatment. The design was a non-randomised, single-treatment pMRHD study with a normocaloric-hyperprotein formula. The recruitment of 44 obese patients was carried out using a consecutive sampling method among the subjects referred to our nutrition unit from primary care. Exclusion criteria were any of the following: history of thyroid disease, heart attack, stroke, severe kidney or liver disorders, active alcoholism or malignant tumour; or within the three months prior to the study the patient was receiving lipid-influencing medications (hormone therapy, glucocorticoids or anti-inflammatory drugs) or medications influencing glucose levels (metformin, sulfonylureas, thiazolidinedione, insulin, GLP-1 receptor antagonists, S-GLT2, DPP-IV inhibitors or any other medication related to the treatment of diabetes mellitus). Subjects with obesity were eligible to participate if they met the following inclusion criteria: body mass index (BMI) greater than 35 kg/m2 and aged between 30 and 70 years old.
After obtaining written informed consent, we collected 10 ml of peripheral venous blood in tubes containing EDTA-Na2. After labelling each sample with an anonymised study number, we measured levels of insulin, total cholesterol, LDL cholesterol, HDL cholesterol and triglycerides. The CDKAL1 genetic variant was evaluated by polymerase chain reaction. All anthropometric parameters (weight, height, BMI, waist circumference [WC] and fat mass by impedance) and blood pressure were recorded at baseline and also after three months.
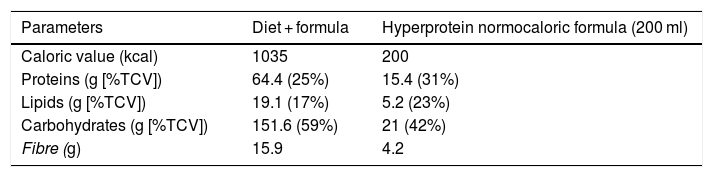
Dietary interventionAfter their inclusion in the study, all patients were advised on ways to modify their usual diet to a partial meal replacement hypocaloric diet (pMRHD), with two normocaloric hyperprotein formula cartons. The nutritional characteristics of the pMRHD and the artificial formula are shown in Table 1. This dietary intervention is structured in five meals (breakfast, mid-morning snack, lunch, afternoon snack, dinner, after-dinner snack). Lunch and dinner were replaced by the normocaloric hyperprotein formula (Vegestart® Complet), the nutritional characteristics of which are described in Table 1. A dietitian provided telephone support every seven days. The different parameters were measured before the start of the dietary intervention and three months after the start of the intervention.
Dietary composition of the five intakes diet (three intakes as natural food and two intakes as artificial formula), as indicated in the “Methods” section.
| Parameters | Diet + formula | Hyperprotein normocaloric formula (200 ml) |
|---|---|---|
| Caloric value (kcal) | 1035 | 200 |
| Proteins (g [%TCV]) | 64.4 (25%) | 15.4 (31%) |
| Lipids (g [%TCV]) | 19.1 (17%) | 5.2 (23%) |
| Carbohydrates (g [%TCV]) | 151.6 (59%) | 21 (42%) |
| Fibre (g) | 15.9 | 4.2 |
Vegestart® Complet hyperprotein normocaloric formula.
%TCV: percentage of total caloric value.
Weight was determined without clothing with an accuracy of ±100 g, using an automatic scale (Seca, Birmingham, UK). Height was determined with the subject in an upright position to the nearest centimetre, using a manual stadiometer (Seca Birmingham, UK). BMI was calculated using the usual equation: weight (kg)/height × height (m2). The weight difference was calculated by the percentage of weight loss (%WL): (weight before the intervention − weight after the intervention [kg]/baseline weight [kg]) × 100. Abdominal adiposity was calculated by waist circumference (WC). Waist circumference (WC) was measured at the narrowest diameter between the xiphoid process and the iliac crest. A bioelectrical impedance analysis (BIA) was performed on all subjects. An alternating electric current of 0.8 mA at 50 kHz, produced by a calibrated signal generator (EFG, Akern, Firenze, Italy) was used and applied to the skin by means of adhesive electrodes located on the back of the left hand and the left foot.14
Blood pressure was measured three times after a 10 min rest, with a random-zero mercury sphygmomanometer, and averaged (Omron, LA, CA, USA).
Biochemical parametersThe general lipid profile (levels of total cholesterol and triglycerides) was determined by an enzymatic colorimetric technique (Technicon Instruments, Ltd., New York, New York, USA). LDL cholesterol was calculated using the Friedewald formula (LDL cholesterol = total cholesterol − HDL cholesterol − triglycerides/5).15 HDL cholesterol was determined enzymatically in the supernatant after precipitation of other lipoproteins with dextran sulfate-magnesium. Insulin was determined by radioimmunoassays (RIA Diagnostic Corporation, LA, CA), with a sensitivity of 0.5 mIU/l (normal range 0.5−30 mIU/l),16 and plasma glucose levels were determined by a glucose oxidase method (glucose analyser 2, Beckman Instruments, Fullerton, CA, USA). The evaluation of the homeostasis model assessment of insulin resistance (HOMA-IR) was obtained using these values with this equation: (fasting insulin [mU/l] × glucose [mmol/l]/22.5).17
Genetic studyGenotyping (rs7756992) was done using the TaqMan genotyping platform™ OpenArray™ (ThermoFisher, Pittsburgh, PA, USA). Samples were loaded using the AccuFill system, and amplification was performed on the instrument QuantStudio 12K Flex Real-Time qPCR (ThermoFisher, Pittsburgh, PA, USA.) A total volume of 7.5 µl with 2.5 µl of TaqMan™ OpenArray™ Master Mix (Applied Biosystems, Foster City, CA, USA) and 2.5 µl of human DNA samples were loaded and amplified into arrays following the manufacturer’s instructions TaqMan Genotyper (LifeTechnologies, Carlsbad, CA, USA.) The CDKAL1 genetic variant was in Hardy–Weinberg equilibrium (p = 0.33).
Partial meal replacement hypocaloric diet (pMRHD)Before and three months after the intervention, all obese subjects completed a 72-h dietary record to assess calorie and nutrient intake. The first record was done before starting the intervention to assess baseline dietary intakes. The second dietary record was done to assess adherence to pMRHD. The records were reviewed by a dietitian and analysed by the program Dietsource® (Nestlé, Geneva, Switzerland). National food composition tables were used as a reference.18 The exercise recommendations for patients in both groups were aerobic physical activities, at least four times a week (one hour each time). The exercises prescribed to the subjects were walking, running, cycling and swimming. Muscle strength exercises (weight training or weight lifting) were contraindicated. The patients’ exercise activity was self-reported through a self-completed questionnaire.
Statistical analysisThe data were analysed with the SPSS program (version 19.0 Armonk, NY, USA.) Results are shown as mean ± SD. The sample size was calculated to detect differences in more than two units in HOMA-IR with 90% power and 5% significance (n = 40). The normality of each variable was examined with the Kolmogorov–Smirnov test. Categorical variables were analysed with the χ2 test, with Yates’ correction, as necessary, and Fisher’s test. The importance of the interaction between the clinical/biochemical characteristics and the SNP was evaluated using an analysis of variance (ANOVA), with the Bonferroni test post hoc. To analyse the effect of the intervention in each group (p time) and to analyse the interaction (p time-group), which reports whether the effect of the intervention is the same for the two groups. The Student’s t test was also used to analyse the differences between the two groups in the main variable (before and after) (p genotype). Statistical analysis was performed for the AG and GG genotypes combined as a group and the AA genotype as the second group (wild-type genotype), with a dominant model. The genotype distribution was tested for deviation from Hardy–Weinberg equilibrium using a χ2 test.
ResultsA total of 44 subjects with BMI >35 kg/m2 were included, with the following genetic distribution; (27AA [61.3%], 12 AG [27.3%] and 5 GG [11.4%]). All patients completed the three-month follow-up period without withdrawals and no adverse symptoms related to the intervention were reported. The mean age was 61.1 ± 5.3 years (range: 35–70 years) and the mean BMI was 38.4 ± 2.1 kg/m2 (range: 36.1–40.6 kg/m2). Age was similar in both genotype groups (wild type [AA] vs. mutant type [AG + GG]) (62.0 ± 6.2 years vs. 60.9 ± 7.0 years: ns). In the total group, the distribution by sex was 34 men (77.3%) and 10 women (22.7%). The distribution by sex was similar in both groups of genotypes, men (25.9% vs. 19.6%) and women (74.1% vs. 80.4%).
Baseline assessment of dietary intake (before obese subjects received a pMRHD) with a three-day food record showed the following data: total calorie intake of 1713.9 ± 491.81 cal/day, carbohydrate intake of 160.2 + 53.9 g/day (39.6% of calories), fat intake of 65.4 + 21.8 g/day (37% of calories), protein intake of 77.5 ± 20.1 g/day (23.4% of calories) and dietary fibre consumption of 15.1 + 7.0 g/day. After three months of pMRHD, these subjects met the recommendations; 1061.1 calories per day, 148.1 ± 42.2 g/day of carbohydrates (64.2% of calories), 27.9 ± 17.3 g/day of lipids (23.2% of calories), 62.3 ± 12.0 g/day of protein (23.6% of calories) and 18.4 + 3.0 g/day of dietary fibre. The fat distribution was as follows; 32.7% saturated fat, 50.2% monounsaturated fat and 17.1% polyunsaturated fat. Physical activity was similar in both genotype groups (139.2 ± 21.3 min/week vs. 141.0 ± 26.2 min/week; p = 0.31).
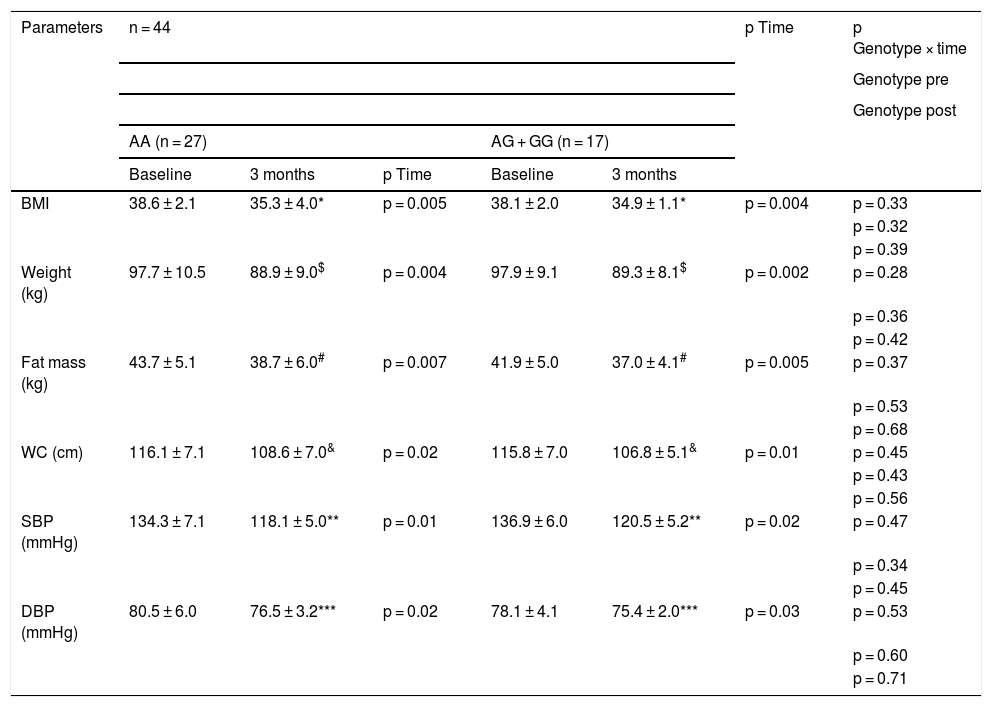
As shown in Table 2, there were no statistical differences related to genotype (baseline and after dietary intervention) in blood pressure and adiposity parameters. After pMRHD, body weight, body mass index (BMI), fat mass, waist circumference and blood pressure decreased in both genotypes. The percentage of weight reduction at three months was 9.0% (5.3%–9.7%) in non-carriers of the G allele and a similar weight loss in carriers of the G allele of 8.7% (6%–11%). The improvement in body weight (−8.8 ± 2.3 kg vs. −8.6 ± 1.9 kg; p = 0.21), BMI (−3.3 ± 0.5 kg/m2 vs. −3.2 ± 0.6 kg/m2; p = 0.32), fat mass (−5.0 ± 1.1 kg vs. −4.9 ± 1.1 kg; p = 0.31) and waist circumference (−7.5 ± 1.2 cm vs. −9.0 ± 1.3 cm; p = 0.42) were similar in carriers and non-carriers of the G allele. The improvement in blood pressure was similar in both genotypes (Table 2).
Anthropometric parameters and blood pressure (mean ± SD).
| Parameters | n = 44 | p Time | p Genotype × time | ||||
|---|---|---|---|---|---|---|---|
| Genotype pre | |||||||
| Genotype post | |||||||
| AA (n = 27) | AG + GG (n = 17) | ||||||
| Baseline | 3 months | p Time | Baseline | 3 months | |||
| BMI | 38.6 ± 2.1 | 35.3 ± 4.0* | p = 0.005 | 38.1 ± 2.0 | 34.9 ± 1.1* | p = 0.004 | p = 0.33 |
| p = 0.32 | |||||||
| p = 0.39 | |||||||
| Weight (kg) | 97.7 ± 10.5 | 88.9 ± 9.0$ | p = 0.004 | 97.9 ± 9.1 | 89.3 ± 8.1$ | p = 0.002 | p = 0.28 |
| p = 0.36 | |||||||
| p = 0.42 | |||||||
| Fat mass (kg) | 43.7 ± 5.1 | 38.7 ± 6.0# | p = 0.007 | 41.9 ± 5.0 | 37.0 ± 4.1# | p = 0.005 | p = 0.37 |
| p = 0.53 | |||||||
| p = 0.68 | |||||||
| WC (cm) | 116.1 ± 7.1 | 108.6 ± 7.0& | p = 0.02 | 115.8 ± 7.0 | 106.8 ± 5.1& | p = 0.01 | p = 0.45 |
| p = 0.43 | |||||||
| p = 0.56 | |||||||
| SBP (mmHg) | 134.3 ± 7.1 | 118.1 ± 5.0** | p = 0.01 | 136.9 ± 6.0 | 120.5 ± 5.2** | p = 0.02 | p = 0.47 |
| p = 0.34 | |||||||
| p = 0.45 | |||||||
| DBP (mmHg) | 80.5 ± 6.0 | 76.5 ± 3.2*** | p = 0.02 | 78.1 ± 4.1 | 75.4 ± 2.0*** | p = 0.03 | p = 0.53 |
| p = 0.60 | |||||||
| p = 0.71 | |||||||
To analyse the effect of the intervention in each group p < 0.05 (* BMI, $ weight, # fat mass, & WC, ** SBP, *** DBP) (p time). A value for the interaction (p time-group) that reports whether the effect of the intervention is the same for the two groups; Student’s t test for the analysis of the differences between the two groups in the main variable (before and after) (p pre and post genotype).
BMI: body mass index; DBP, diastolic blood pressure; SBP, systolic blood pressure; WC, waist circumference; SD: standard deviation.
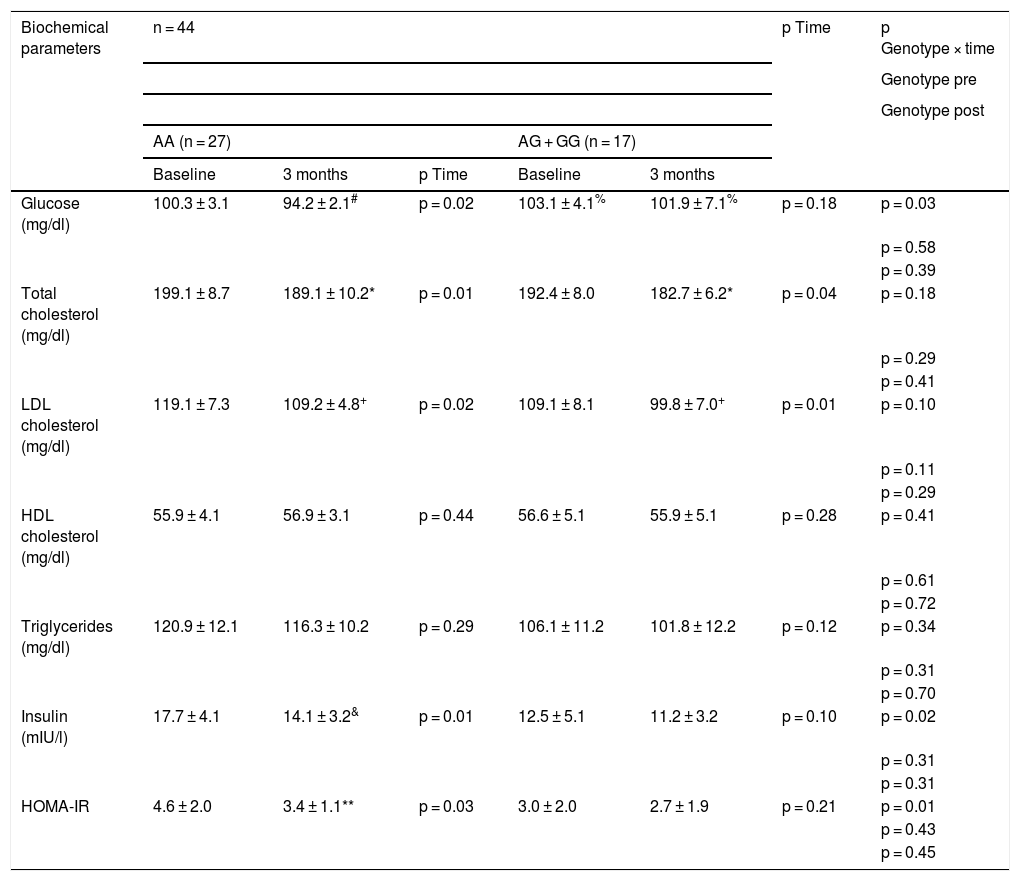
Table 3 shows the changes in the biochemical parameters. After the dietary intervention with pMRHD, non-carriers of the G allele showed a significant improvement in fasting glucose levels (AA vs. AG + GG) (−6.1 ± 1.4 mg/dl vs. −1.2 ± 0.7 mg/dl; p = 0.01), fasting insulin levels (−3.6 ± 0.2 mU/l vs. −1.3 ± 0.6 mU/l; p = 0.02) and HOMA-IR (−1.2 ± 0.2 units vs. −0.3 ± 0.2 units; p = 0.01). Fasting plasma glucose levels were higher in G allele carriers than non-carriers (baseline delta; −3.1 ± 0.2 mg/dl; p = 0.02) and (delta at three months: −5.7 ± 0.4 mg/dl; p = 0.01). Finally, the improvement in LDL cholesterol and total cholesterol levels was similar in both genotypes (Table 3).
Biochemical parameters (mean ± SD).
| Biochemical parameters | n = 44 | p Time | p Genotype × time | ||||
|---|---|---|---|---|---|---|---|
| Genotype pre | |||||||
| Genotype post | |||||||
| AA (n = 27) | AG + GG (n = 17) | ||||||
| Baseline | 3 months | p Time | Baseline | 3 months | |||
| Glucose (mg/dl) | 100.3 ± 3.1 | 94.2 ± 2.1# | p = 0.02 | 103.1 ± 4.1% | 101.9 ± 7.1% | p = 0.18 | p = 0.03 |
| p = 0.58 | |||||||
| p = 0.39 | |||||||
| Total cholesterol (mg/dl) | 199.1 ± 8.7 | 189.1 ± 10.2* | p = 0.01 | 192.4 ± 8.0 | 182.7 ± 6.2* | p = 0.04 | p = 0.18 |
| p = 0.29 | |||||||
| p = 0.41 | |||||||
| LDL cholesterol (mg/dl) | 119.1 ± 7.3 | 109.2 ± 4.8+ | p = 0.02 | 109.1 ± 8.1 | 99.8 ± 7.0+ | p = 0.01 | p = 0.10 |
| p = 0.11 | |||||||
| p = 0.29 | |||||||
| HDL cholesterol (mg/dl) | 55.9 ± 4.1 | 56.9 ± 3.1 | p = 0.44 | 56.6 ± 5.1 | 55.9 ± 5.1 | p = 0.28 | p = 0.41 |
| p = 0.61 | |||||||
| p = 0.72 | |||||||
| Triglycerides (mg/dl) | 120.9 ± 12.1 | 116.3 ± 10.2 | p = 0.29 | 106.1 ± 11.2 | 101.8 ± 12.2 | p = 0.12 | p = 0.34 |
| p = 0.31 | |||||||
| p = 0.70 | |||||||
| Insulin (mIU/l) | 17.7 ± 4.1 | 14.1 ± 3.2& | p = 0.01 | 12.5 ± 5.1 | 11.2 ± 3.2 | p = 0.10 | p = 0.02 |
| p = 0.31 | |||||||
| p = 0.31 | |||||||
| HOMA-IR | 4.6 ± 2.0 | 3.4 ± 1.1** | p = 0.03 | 3.0 ± 2.0 | 2.7 ± 1.9 | p = 0.21 | p = 0.01 |
| p = 0.43 | |||||||
| p = 0.45 | |||||||
Statistical differences p < 0.05, in each genotype group (# glucose, & insulin, * cholesterol, + LDL cholesterol, **HOMA-IR) (p time). A value for the interaction (p time-group) that reports whether the effect of the intervention is the same for the two groups; Student’s t test for the analysis of the differences between the two groups in the main variable (before and after) (p pre and post genotype).
HOMA-IR: homeostasis model assessment of insulin resistance; SD: standard deviation.
In this study we demonstrated how obese subjects without an SNP rs7756992 G allele showed an improvement in fasting baseline glucose levels, insulin levels and HOMA-IR compared with G allele carriers after a partial meal replacement hypocaloric diet (pMRHD). Fasting baseline glucose levels were higher in G allele carriers than in non-carriers.
Along the same vein of worsening of glyacemic metabolism due to this risk allele that we found in our work, there are already data in the literature. A previous study11 demonstrated that carriers of the G allele of rs7756992 have a 22% lower insulin response than non-carriers of the G allele with standard glucose load. Chistiakov et al.19 showed significantly reduced levels of serum insulin at two hours in response to glucose stimulation in diabetic and non-diabetic patients with the G allele of this CDKAL1 variant. This risk allele is related to impaired beta cell homeostasis and reduced beta cells. The deleterious effect of this risk allele on glycaemic metabolism has been demonstrated not only in adults, but also in children.20 Furthermore, this negative effect may begin as early as foetal age, since an association of the G allele with low birth weight, a known independent risk factor for obesity and type 2 diabetes mellitus, has been demonstrated.21 Given that this variant of CDKAL1 is related to problems with the secretion of insulin, a well-known foetal growth factor, the reduction of foetal insulin secretion in the uterus results in this low birth weight.22
To explain the worse response in our study in fasting glucose levels, fasting insulin levels and insulin resistance after weight loss in G allele carriers, we propose a pathophysiological hypothesis. We could put forward the hypothesis that this association is likely to be secondary to reduced beta cell sensitivity and decreased insulin response.23 A reduced sensitivity to glucose in beta cells indicates a decrease in insulin secretion, in this case in obese subjects with peripheral insulin resistance. Furthermore, this decrease in glucose sensitivity was related to progression to abnormal glucose tolerance,24 as we have been able to verify in obese patients who carry the G allele in our study, who had higher fasting glucose levels before and after weight loss, secondary to nutritional intervention.
As far as we are aware, this is the first study to evaluate the effect of this genetic variant on the glycaemic effects secondary to weight loss after a dietary intervention in obese patients. In the literature, some previous studies have evaluated the effect of antidiabetic drugs and this genetic variant. For instance, Chistiakov et al.19 reported better postprandial blood glucose after sulfonylureas (SU) in patients at risk of the rs7756992 G allele. Similarly, Schroner et al.25 reported that fasting blood glucose after SU was also lowered further in subjects with the G allele. The mechanisms underlying this relationship between the rs7756992 risk allele and the therapeutic response to SU are unclear. The improvement of KATP channels and the ATP generated by mitochondria has been implicated in these actions,19,25 with a better response in patients who carry the G allele. The negative effect of the G allele in our work is only in glycaemic control, since we were able to see how the lipid profile improved in patients of both genotypes.
The limitations of our study are the inclusion in the trial of obese subjects without established type 2 diabetes mellitus. Secondly, we only analysed one SNP of the CDKAL1 gene, so other genetic variants in this gene or others could be related to the results. Third, the absence of a no-diet control group could be a bias. Fourth, we did not determine the postprandial blood glucose response. Finally, self-reported dietary intake is not entirely reliable and could include under- or over-reporting bias. The strength of our study was in its design as an interventional trial with high adherence to partial meal replacement and the G allele frequencies were in accordance with previous studies.26,27
In summary, our data suggest that the genetic variant (rs7756992) of the CDKAL1 gene is associated with glycaemic status after a partial meal replacement intervention, with greater improvement in fasting glucose, insulin and HOMA-IR in subjects without the G allele. The exact underlying mechanisms of this genetic variant of the CDKAL1 gene that modify glucose levels and insulin sensitivity are not yet clear and should be investigated in further studies to evaluate the role in diabetes mellitus28 and its complications.29
Statement of ethicsThis interventional study was approved by our Ethics Committee (HCUVA Committee 07/2018). The patients were informed of their right to withdraw from the study without compromising their treatment and all patients were informed and signed an informed consent
Author contributionsDaniel de Luis drafted the article and designed the study. Olatz Izaola drafted the article and conducted a nutritional evaluation. David Primo conducted biochemical evaluations. J.J. López conducted nutritional evaluations and statistical work.
FundingThis study has not received any type of funding.
Conflicts of interestThe authors declare that they have no conflicts of interest.
Please cite this article as: Izaola-Jáuregui O, Primo-Martín D, López JJ, de Luis-Román DA. La presencia de la variante de riesgo de CDKAL1 (rs7756992) altera los niveles de glucosa en ayunas y la resistencia a la insulina después de una dieta hipocalórica con reemplazo parcial de comidas. Endocrinol Diabetes Nutr. 2021;68:548–556.
