


Parathyroid hormone (PTH) and vitamin D are essential components in mineral metabolism. Our aims were to estimate the thresholds of 25-hydroxyvitamin D [25(OH)D] and estimated glomerular filtration rate (eGFR) that inhibit PTH, establish PTH reference intervals (RIs), and the stratify need based on age and gender.
Materials and methodsWe conducted a cross-sectional study on participants older than 18 years. Segmented regressions (SR) were performed to determine the thresholds of 25(OH)D and eGFR in relation to PTH levels. Multivariate regression was used to evaluate the associations between PTH and 25(OH)D, gender, age, eGFR, and season. To establish the PTH RIs, extreme percentiles were calculated.
ResultsA total of 2794 subjects were analyzed (women, 77.56%). Multivariate regression indicated that age, gender, 25(OH)D, and eGFR explained PTH variation. SR demonstrated that PTH stabilized when eGFR>46.64mL/min/1.73m2, and PTH increased when 25(OH)D was <15.8ng/mL. Stratification by gender and age revealed different RIs, with women and over 70 years showing higher limits.
ConclusionOur study suggests a stabilization point in PTH with an eGFR>46.64mL/min/1.73m2, indicating a significant interaction between renal function and PTH regulation. Additionally, the significant increase in PTH in individuals with 25(OH)D<15.8ng/mL emphasizes the importance of vitamin D in regulation. An association between age and PTH was also evident, particularly a substantial increase after the age of 70. Finally, we established the need to define partitioned RIs for PTH based on age and gender.
La hormona paratiroidea (PTH) y la vitamina D son componentes fundamentales en el metabolismo mineral. Nuestros objetivos fueron estimar los umbrales de 25-hidroxivitamina D [25(OH)D] y la tasa de filtración glomerular estimada (TFGe) que inhiben la PTH, establecer intervalos de referencia (IR) para la PTH y la necesidad de estratificar según la edad y el género.
Materiales y métodosSe realizó un estudio transversal en sujetos mayores de 18 años. Se llevaron a cabo regresiones segmentadas (RS) para determinar los umbrales de 25(OH)D y TFGe en relación con los niveles de PTH. La regresión multivariada se utilizó para evaluar las asociaciones entre PTH y 25(OH)D, género, edad, TFGe y estación. Para establecer los IR de PTH, se calcularon los percentiles extremos.
ResultadosSe analizaron 2.794 sujetos (mujeres 77,56%). La regresión multivariada indicó que la edad, el género, la 25(OH)D y el TFGe explican la variación de PTH. La RS demostró que la PTH se estabilizó cuando la TFGe superó los 46,64ml/min/1,73 m2 y la PTH aumentó cuando la 25(OH)D fue inferior a 15,8 ng/ml. La estratificación por género y edad reveló IR distintos, con mujeres y mayores de 70 años en los límites superiores.
ConclusiónNuestro estudio indica un punto de estabilización en la PTH con una TFGe superior a 46,64ml/min/1,73 m2, lo que indica una interacción significativa entre la función renal y la regulación de PTH. Además, el aumento significativo de PTH en individuos con 25(OH)D inferior a 15,8 ng/ml subraya la importancia de la vitamina D en la regulación. También se evidenció una asociación entre la edad y PTH, particularmente, un aumento sustancial después de los 70 años. Finalmente, establecimos la necesidad de definir IR partidos para PTH según edad y género.
Parathyroid hormone (PTH) and vitamin D play crucial roles in mineral metabolism and operate within a tightly regulated feedback loop. PTH is secreted by the parathyroid glands and regulates plasma calcium levels by stimulating the synthesis of 1,25-dihydroxyvitamin D, which, in turn, exerts negative feedback on the parathyroid glands.1,2 This process results in increased calcium absorption from the gut, increased reabsorption of filtered calcium in the renal tubular system, and elevated release of calcium from bone through activation of the bone remodeling system.3
The measurement of PTH is crucial for diagnosing disorders related to calcium/phosphorus metabolism, monitoring parathyroid function, and managing patients with chronic kidney disease (CKD).4 However, the target range for PTH can vary considerably based on factors like creatinine clearance and/or vitamin D status, determined by the sum of circulating levels of 25(OH)D2 and 25(OH)D3.5,6
Establishing a reference interval (RI) for PTH, especially the upper limits of normal (ULN), has the potential to significantly improve the accuracy in diagnosing and treating conditions such as primary hyperparathyroidism and end-stage renal disease.7–9 Therefore, achieving a comprehensive understanding of what constitutes “normal” PTH levels within the RI in healthy individuals without calcium metabolism disorders is indispensable. Furthermore, considering the interconnected nature of PTH and vitamin D, reference ranges for PTH might be inflated if established within a population of generally healthy individuals without assessing vitamin D deficiency. it is appealing to determine the 25(OH)D threshold (point of inflection or breaking point) for maximal PTH suppression, indicating vitamin D sufficiency.10,11 Several studies have documented estimated thresholds ranging from 4 up to 50ng/mL,12–14 although no studies have ever been conducted on this matter in our population.
The elusive definition of vitamin D sufficiency, the intricacies involved in establishing criteria for reference populations, the ongoing debate regarding age and gender influences on PTH, and the variations observed among countries and ethnicities have collectively hindered efforts to establish accepted PTH RIs. In this study, during the assessment of PTH determinants, we aimed to estimate the threshold levels of both creatinine clearance and 25(OH)D linked to elevated PTH levels, followed by reporting the PTH RIs. Finally, we explored the need to partition RIs based on age, gender, and seasons of the year.
Material and methodsStudy populationWe conducted a cross-sectional study with participants who underwent routine physical examinations from January 1st, 2019 to December 31st, 2022. Data were retrospectively retrieved from subjects who had simultaneous serum analyses of 25(OH)D and PTH, along with their corresponding biochemical parameters, gender, age, and measurement date. All biochemical data were extracted from the laboratory information management system of our institution. This study was approved by the Ethics Committee.
Inclusion and exclusion criteriaPatients with hypercalcemic primary hyperparathyroidism, those with hypoparathyroidism, and individuals with chronic kidney disease undergoing renal replacement therapy were excluded. Additionally, specific medical conditions or medication records, including diagnoses of hypophosphatasia, idiopathic hypocalciuric hypercalcemia, osteomalacia, and the use of drugs, such as bisphosphonates, denosumab, romosozumab, and teriparatide, were excluded during the data retrieval process. Subsequently, apparently healthy subjects were selected based on evaluations of their mineral metabolism and renal function. Inclusion criteria comprised individuals aged over 18 years old, with the serum biochemical parameters falling within their respective reference: adjusted calcium for albumin (8.5–10.5mg/dL), serum phosphate (2.5–4.5mg/dL), and 24-h urine calcium excretion (<250mg/day in women, <300mg/day in men). Verification of inclusion and exclusion criteria was conducted by reviewing the electronic health records. Strategies to handle missing data were applied, including the exclusion of incomplete records for key study variables.
Sample detectionAll 25(OH)D and PTH tests were conducted by the electrochemiluminescence assay on Cobas E411 analyzer (Roche Diagnostics, Indianapolis, IN, USA). According to the manufacturer's instructions, the functional sensitivity was 6.0pg/mL, and the reference range was 15–65pg/mL. Albumin-adjusted serum calcium was calculated using the following formula: corrected calcium=(measured serum calcium concentration in mg/dL)+0.8×(4−albumin concentration in g/dL).
Estimated glomerular filtration rate (eGFR) was calculated using the Chronic Kidney Disease Epidemiology Collaboration (CKD-EPI) equation. The blood collection period was categorized into 4 groups: summer (December, January, and February), autumn (March, April, and May), winter (June, July, and August), and spring (September, October, and November). Subjects were stratified into 7 age groups (18–29, 30–39, 40–49, 50–59, 60–69, 70–79, ≥80 years), and 5 eGFR groups (≥90, 90–60, 60–45, 45–30, ≤30mL/min/1.73m2).
Statistical analysisThe Shapiro–Wilk was used to assess normality, and parametric or non-parametric tests were used, as appropriate. Continuous variables were expressed as median and interquartile range (IQR). To establish a “normal population”, logPTH outliers were eliminated using the Tukey fence method. Visual inspection of histograms was utilized to test for normality, considering that formal normality tests were very sensitive for large test numbers in this study. Multivariate linear regression was performed to evaluate the associations between PTH and variables. PTH was the dependent variable, while 25(OH)D, gender, age, eGFR, and season were introduced as independent variables. The final model selection was conducted based on Akaike's Information Criterion (AIC) and the p-value. The exact values of cut-off points of 25(OH)D and eGFR were determined by the segmented regression.15 The slopes of PTH according to eGFR and 25(OH)D were estimated using a linear test model considering the obtained cut-off points. We used a Z-test, as suggested by Harris, to assess whether the RIs should be stratified based on factors as age and gender.16 To establish the PTH RIs, the serum PTH concentrations extreme percentiles (2.5 and 97.5) were calculated. All figures were made by GraphPad Prism 8 (GraphPad Software Corporation, California, USA). For the statistical analysis, R software version 4.2.3 was used. p values<0.05 were considered statistically significant.
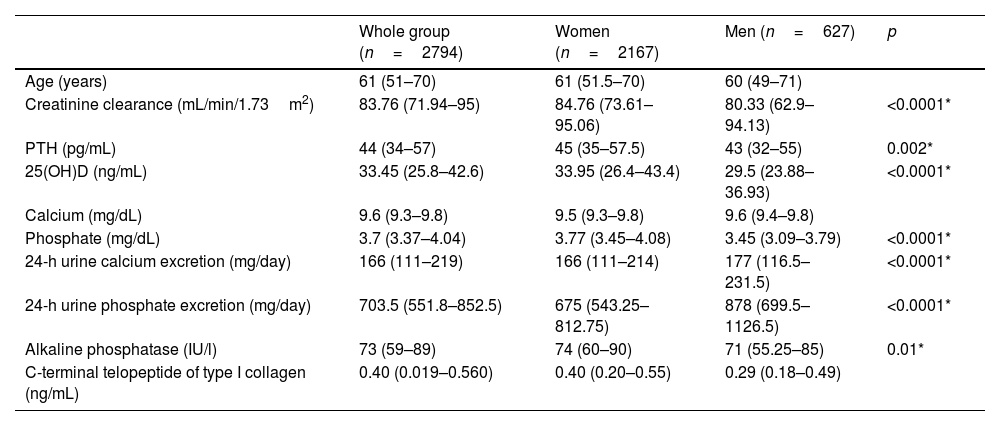
ResultsAnalysis populationResults from 2794 individuals, among whom 2167 (77.56%) were women and 627 (22.44%) were men, aged 18–99 years (50.38±9.46) were included in this study (Fig. 1). The median vitamin D level was 33.45 (25.8–42.6)ng/mL, with 61.34% had optimal levels of vitamin D, while 11.12% and 0.89% exhibited deficiency and severe deficiency, respectively. Vitamin D levels were lowers during winter and spring (summer, 35.15ng/mL; autumn, 34ng/mL; winter, 33.70ng/mL; spring, 30.7ng/mL). The number of measurements was similar across the 4 seasons of the year (summer, 25.38%; autumn, 23.87%; winter, 24.52%; spring, 26.23%). The population characteristics are described in Table 1.

Descriptive characteristics of the study population.
| Whole group (n=2794) | Women (n=2167) | Men (n=627) | p | |
|---|---|---|---|---|
| Age (years) | 61 (51–70) | 61 (51.5–70) | 60 (49–71) | |
| Creatinine clearance (mL/min/1.73m2) | 83.76 (71.94–95) | 84.76 (73.61–95.06) | 80.33 (62.9–94.13) | <0.0001* |
| PTH (pg/mL) | 44 (34–57) | 45 (35–57.5) | 43 (32–55) | 0.002* |
| 25(OH)D (ng/mL) | 33.45 (25.8–42.6) | 33.95 (26.4–43.4) | 29.5 (23.88–36.93) | <0.0001* |
| Calcium (mg/dL) | 9.6 (9.3–9.8) | 9.5 (9.3–9.8) | 9.6 (9.4–9.8) | |
| Phosphate (mg/dL) | 3.7 (3.37–4.04) | 3.77 (3.45–4.08) | 3.45 (3.09–3.79) | <0.0001* |
| 24-h urine calcium excretion (mg/day) | 166 (111–219) | 166 (111–214) | 177 (116.5–231.5) | <0.0001* |
| 24-h urine phosphate excretion (mg/day) | 703.5 (551.8–852.5) | 675 (543.25–812.75) | 878 (699.5–1126.5) | <0.0001* |
| Alkaline phosphatase (IU/l) | 73 (59–89) | 74 (60–90) | 71 (55.25–85) | 0.01* |
| C-terminal telopeptide of type I collagen (ng/mL) | 0.40 (0.019–0.560) | 0.40 (0.20–0.55) | 0.29 (0.18–0.49) |
PTH: parathyroid hormone; 25(OH)D: 25-hydroxyvitamin D.
* Indicates significant differences between men and women.
The levels of vitamin D were lower during winter and spring (summer, 35.15ng/mL; autumn, 34ng/mL; winter, 33.70ng/mL; spring, 30.7ng/mL; p<0.0001). PTH levels were higher during winter and spring (summer, 43pg/mL; autumn, 42pg/mL; winter, 47pg/mL; spring, 45pg/mL; p<0.0001), but the analysis of covariance showed a significant interaction with 25(OH)D levels (p<0.0001).
A multiple linear regression analysis was conducted to explain the variation in PTH levels, incorporating age, gender, vitamin D levels, creatinine clearance, and seasons of the year as explanatory variables. The model that demonstrated the best fit for data only included age, gender, vitamin D, and creatinine clearance (Adjusted-R2=0.07. p<0.0001. AIC=7887.5).
Considering the categories of chronic kidney disease, PTH levels were significantly higher in patients with a glomerular filtration rate below 45mL/min/1.73m2 (Fig. 2).

PTH levels according to glomerular filtration rate. Kruskal–Wallis test. * Is indicative of significant differences vs ≤30, # is indicative of significant differences vs 30–45, & indicate significant differences vs 45–60, $ is indicative of significant differences vs ≥90mL/min/1.73m2. GFR: glomerular filtration rate.
The segmented regression analysis suggested that PTH reached a plateau when creatinine clearance is ≥46.64mL/min/1.73m2, while PTH rose steeply when creatinine clearance is below this cutoff point. The linear regression analysis showed that when creatinine clearance is ≥46.64mL/min/1.73m2, the coefficient is −0.173, whereas when it is <46.64mL/min/1.73m2, the coefficient is −0.626. For this reason, to assess the effect of the remaining variables, we will exclude patients with a clearance<46.64mL/min/1.73m2.
PTH levels were higher when patients exhibited deficiency and severe deficiency of vitamin D (Fig. 3). Segmented regression suggested that PTH reached a plateau when 25(OH)D levels are ≥15.8ng/mL, while PTH rose when levels are <15.8ng/mL. It was shown that when 25(OH)D is >15.8ng/mL, the coefficient is −0.126 (p<0.0009), whereas when it is <15.8ng/mL, the coefficient is −2.318 (p=0.02). To evaluate the impact of age and establish reference values, we excluded from the analysis patients with 25(OH)D levels<15.8ng/mL.
D levels. Kruskal–Wallis test. * Is indicative of significant differences vs <10, # is indicative of significant differences vs 10–20ng/mL.")
PTH levels vary among different age groups, with higher levels observed in individuals older than 70 years [20–30 years: 39pg/mL (29–47.5) vs >70 years: 46pg/mL (38–60), Kruskal–Walis, Bonferroni post-test. p<0.05].
PTH reference intervalsConsidering the population with 25(OH)D levels>15.8ng/mL and creatinine clearance>46.64mL/min/1.73m2, the RI for PTH was 21–89pg/mL, being higher in women (women, 22–89.88pg/mL vs men, 20–83.15pg/mL; p<0.005). To assess the need for separate divisions within the PTH RI based on age and gender, considering the identified determinants of PTH in our study, a Z-test was conducted using gender and age (based on significant differences in PTH among age groups). The results indicated the necessity to stratify the PTH RIs by gender and age ranges (Table 2). In Table 3, the RIs for PTH established according to age and gender are shown.
Z* values in PTH RIs establishment.
| Subjects | Groups | Z | Z* | Intervals kept separate |
|---|---|---|---|---|
| Gender | Men/women | 5.21 | 2.50 | Yes |
| Age | <39 y/≥40 <70 y | 13.21 | 2.50 | Yes |
| ≥40 <70 y/≥70 y | 8.09 | 2.50 | Yes |
According to Harris's methodology, if Z>Z*, both groups should be kept separate.
PTH RIs: parathyroid hormone reference intervals.
Serum PTH reference interval adjusted for age and gender.
| PTH RIs (pg/mL) | <30y | ≥40<70 y | ≥70 y | |
|---|---|---|---|---|
| Whole group | 2.5th percentile | 19.58 | 22 | 22 |
| 97.5th percentile | 78.55 | 84 | 94 | |
| Women | 2.5th percentile | 20 | 23 | 21.88 |
| 97.5th percentile | 83.95 | 84 | 94.13 | |
| Men | 2.5th percentile | 19 | 20 | 23.43 |
| 97.5th percentile | 67.40 | 83.25 | 87.75 |
PTH RIs: parathyroid hormone reference intervals.
In this study, we established age- and gender-stratified RIs for PTH in a sample of Argentine adult subjects considering strict criteria recommended by the literature and a normal phosphocalcium metabolism. Unlike other studies, we also excluded patients with idiopathic hypercalciuria, hypophosphatasia, and drugs affecting mineral metabolism. Additionally, we determined thresholds for both 25(OH)D and creatinine clearance associated with an increase in PTH levels.
The first step in establishing serum PTH RIs involves selecting a healthy reference population. We showed that the median PTH level was 44pg/mL, slightly higher in women, and the 25(OH)D level was 33.45ng/mL. Exclusion criteria within this population include scenarios that could potentially influence PTH concentrations, including both factors that could raise or lower PTH. In this context, it is widely accepted that PTH might go up in certain individuals with eGFRs<60mL/min/1.73m2.4 The causes are diverse and include decreased calcitriol production due to phosphate retention and increased secretion of FGF23, a progressive shift toward a higher level of calcium set point, and resistance to PTH action for unclear reasons.4 Consistent with previous observations,17 PTH significantly and progressively rises from stages 2 up to 5. However, our study is the first ever conducted to assess the exact threshold value of creatinine clearance (46.64mL/min/1.73m2) associated with an increase in the rate of PTH elevation and the higher occurrence of abnormally elevated PTH values (>46.64mL/min/1.73m2: 13.2% vs <46.64: 38.3%; χ2; p<0.0001). These findings suggest the potential need to reassess the established creatinine clearance cut-off point for defining PTH RIs in future research. Hence, this specific eGFR value was employed to analyze the remaining variables and determine the RI for PTH. Moreover, our findings bear therapeutic significance, particularly in non-dialysis chronic kidney disease patients, in whom the aim resides in maintaining PTH levels within a normal range.4
Within this spectrum of conditions, vitamin D deficiency emerges as remarkably prevalent in the general population.18 Our prior investigations revealed an incidence of insufficiency ranging between 28.7% and 32.4%, with a deficiency prevalence ranging between 13.3% and 18%.19 Acknowledging the potential of vitamin D insufficiency to stimulate increased PTH secretion, coupled with observed PTH normalization after vitamin D supplementation,20 it becomes clinically reasonable to exclude individuals with deficient vitamin D levels from a reference population intended for establishing normative PTH RIs. This approach closely aligns with robust recommendations delineated in the latest guidelines on the diagnosis and management of primary hyperparathyroidism.7 A point that deserves consensus, however, is the 25(OH)D cut-off point below what may be considered “low”. Indeed, at least 2 25(OH)D cut-off points, 20ng/mL and 30ng/mL, are debated. The 30ng/mL cut-off point is supported by the Endocrine Society and is intended for the care of patients.21 We demonstrated that there is an inverse correlation between PTH and 25(OH)D levels. Furthermore, we demonstrated that patients with both deficiency and severe deficiency exhibited higher levels of PTH. Additionally, upon assessing the relationship between both variables, we established a cut-off value of 15.8ng/mL, beyond which PTH increases more prominently. Although controversy remains regarding the definition of vitamin D status, the estimated cutoff value in our study aligns closely with the one suggested by the IOM,22 as observed in previous studies employing a similar research methodology.14
Gender, age, menopausal status, calcium intake, body mass index, smoking, and season were potential factors for PTH RIs stratification. In the multivariate analysis, the most significant determinants of PTH levels were age, gender, creatinine clearance, and 25(OH)D levels. We showed higher PTH levels during winter and spring. However, during these periods, 25(OH)D levels are lower, and indeed, the analysis of covariance demonstrates a significant interference. PTH concentrations fluctuate with the seasons (lower in summer and higher in winter), likely reflecting the fluctuations of 25(OH)D levels.23,24 Furthermore, our study establishes a direct relationship between age and PTH levels, demonstrating a significant rise in concentrations beyond the age of 70. Considering these findings alongside gender disparities, we assessed the necessity of segmenting PTH RIs based on age and gender categories. Like prior studies, we reaffirmed the need for age-specific stratification in establishing RIs for PTH.8,25–27 Moreover, our findings suggest the relevance of gender stratification, contrary to previous research.25,28
Over the past 20 years, PTH methodologies have substantially progressed in terms of specificity and the molecular form of detected PTH molecules.29 Hence, it is crucial to research and establish adjusted RIs to accurately mirror the method performance. In our case, we evaluated the most widely used PTH assay, Roche Diagnostics’ Cobas kit, for which the established ULN is 65pg/mL, following the Horn algorithm.30 We reported a PTH RI of 21–89pg/mL for the total population, 22–89.88pg/mL for women, and 20–83.15pg/mL for men. These values were 36.92%, 38.28%, and 27.92% higher than the manufacturer's instructions, respectively. Furthermore, the difference is more pronounced in subjects over 70 years old, with a 44.61% higher ULN. This could be relevant to the fact that manufacturers tend to recruit young donors for the reference population.28 Like our findings, three studies indicated a significantly higher ULN than the value suggested by the manufacturer.14,25,26 Inaccurate RIs have the potential for unnecessary follow up and intervention. Implementing the updated ranges outlined in this study is expected to enhance the proper evaluation of abnormal PTH values.
Our study has several strengths. The sample size was relatively large to provide more statistical power in thoroughly assessing the relationship between PTH and related variables. We also employed strict inclusion and exclusion criteria. However, we acknowledge several limitations. Firstly, RIs are only applicable to Roche immunoassays. Secondly, our results may not generalize to other populations or ethnicities, and we present a marked gender imbalance. Thirdly, we did not consider calcium intake nor serum magnesium levels. To minimize the impact of omitting this information, we only included patients with calcium levels adjusted for albumin within the normal range and excluded patients with abnormal serum phosphate levels and severe renal dysfunction that could affect mineral metabolism. Finally, the lack of data on vitamin D supplementation could potentially weaken our findings. However, since the use of vitamin D supplements has not been an exclusion criterion in similar studies focusing on the threshold of 25(OH)D that maximally inhibits PTH, we consider the bias resulting from the lack of vitamin D supplementation data as acceptable.
ConclusionsOur study was the first to explore the thresholds of 25(OH)D and creatinine clearance in relation to PTH, establishing standard RIs for the adult population in Argentina. This was achieved by employing strict criteria recommended in the literature and reasonably excluding subjects with potential factors that could potentially alter PTH levels.
We wish to thank Youyi Fong, from the Department of Biostatistics, Bioinformatics and Epidemiology, Vaccine and Infectious Disease Division, Fred Hutchinson Cancer Research Center (USA) for teaching us how to conduct segmented regression analysis.
