


Primary aldosteronism (PA) is the most common cause of endocrine hypertension, with a prevalence rate of 6–12% in hypertensive patients. Aldosterone/renin ratio (ARR) is the screening test of choice for PA. Because of the variable cut-off points of ARR, reference values related to the populations and methods considered are recommended.
Objectives(i) To optimize the ARR cut-off points for PA screening with current methods; (ii) to assess the correlation and diagnostic sensitivity of the plasma aldosterone concentration/plasma renin activity (ARR) ratio and the aldosterone concentration/renin concentration (ARC) ratios for PA screening, and (iii) to determine the prevalence of PA in our population.
Materials and methodsPlasma aldosterone concentration and plasma renin activity levels were measured using radioimmunoassays (RIAZENco Zentech and RIA DiaSorin respectively), while a chemiluminescence assay (Liaison Diasorin) was used to test renin concentration. ARR and ARC ratios were calculated in 345 subjects (136 healthy subjects and 209 hypertensive patients).
ResultsPrevalence of PA was 5.9% after diagnostic confirmation. ROC curve analysis suggested an ARR threshold of 48.9(ng/dL)/(ng/mL/h) (100% sensitivity, 93.6% specificity) and an ARC threshold of 2.3(ng/dL)/(μIU/mL) (100% sensitivity, 90.9% specificity). Good correlation was seen between ARR and ARC (ρ=0.83, p<0.0001), with a presumptive diagnostic concordance of 96.6%.
ConclusionsNew cut-off values of ARR and ARC for screening of PA, with high sensitivity and good diagnostic concordance, were determined in the study population. It is important to have valid normal ranges to avoid diagnostic errors.
El hiperaldosteronismo primario (HAP) es la causa más frecuente de hipertensión endocrina, con una prevalencia del 6-12% en pacientes hipertensos. El cociente aldosterona/renina es el método de cribado de elección. Dada la variabilidad de sus puntos de corte, se sugiere contar con valores de referencia propios.
Objetivos1) Optimizar los puntos de corte del cociente aldosterona/renina para el cribado de hiperaldosteronismo con la metodología actual; 2) evaluar la correlación y la sensibilidad diagnóstica de los cocientes aldosterona/actividad de renina plasmática (RAA) y aldosterona/concentración de renina (RAC) para el cribado de hiperaldosteronismo, y 3) determinar la prevalencia de hiperaldosteronismo en nuestra población.
Materiales y métodosSe determinaron los niveles de aldosterona (RIA competitivo en fase sólida RIAZENco Zentech), actividad de renina plasmática (RIA en fase sólida DiaSorin) y concentración de renina (quimioluminiscencia Liaison DiaSorin) en 345 sujetos (136 controles y 209 hipertensos). Se calcularon los cocientes RAA y RAC.
ResultadosLa prevalencia de HAP, tras confirmación diagnóstica, fue del 5,9% de los hipertensos. El valor de corte para sospecha de HAP determinado por curvas ROC fue 48,9(ng/dl)/(ng/ml/h) para RAA (sensibilidad 100% y especificidad 93,6%) y 2,3(ng/dl)/(μUI/ml) para RAC (sensibilidad 100% y especificidad 90,9%). Se observó buena correlación entre RAA y RAC (ρ=0,83; p<0,0001), con una concordancia diagnóstica presuntiva del 96,6%.
ConclusionesHemos determinado en nuestra población nuevos valores de corte de RAA y RAC para el cribado de HAP, con buena sensibilidad y concordancia como métodos de cribado. Es importante contar con rangos de normalidad propios para evitar errores diagnósticos.
Primary aldosteronism (PA) is the most common cause of secondary arterial hypertension of endocrine origin, affecting 6–12% of all hypertensive patients, with a higher prevalence in individuals with treatment resistant hypertension (20%). At equal blood pressure levels, these patients suffer a higher frequency of cardiovascular events than those with essential (primary) hypertension.1
The screening method of choice for the diagnosis of PA is the plasma aldosterone (A)/renin (R) ratio. The latter can be measured as plasma renin activity (PRA), which is the capacity to convert angiotensinogen into angiotensin, or as immunoreactive plasma renin concentration (RC), giving rise to the aldosterone/plasma renin ratio (ARR) and the aldosterone/renin concentration ratio (ARC).2 The measurement of PRA is based on a radioimmunoassay (RIA), which is a complex, laborious manual and operator-dependent technique that makes any comparison of results between laboratories difficult. Automated methods for quantifying renin concentration are currently available that are easy to implement in the clinical laboratory, with better reproducibility and shorter processing times, but with poorer sensitivity at low values, as has been reported in the literature.3
The lack of uniformity in the diagnostic protocols and laboratory methods used in the determination of A and R implies substantial variability in the cut-off values of ARR and ARC. Differences in pre-analytical conditions and in patient selection, as well as variations in R and A, geographical location and ethnic origin, explain the important variety of ARR cut-off values, ranging from 7.2 to 100.1(ng/dl)/(ng/ml/h),4 though most authors speak of values between 20 and 40(ng/dl)/(ng/ml/h).2 A multicenter study conducted by the Argentinean Society of Endocrinology (Sociedad Argentina de Endocrinología [SAEM])5 determined cut-off values of 36(ng/dl)/(ng/ml/h) for ARR and 2.39(ng/dl)/(μIU/ml) for ARC. The method for measuring A was RIA DPC (Diagnostic Product Corporation, CA, USA) and that for measuring RC was IRMA DSL (Diagnostic Systems Laboratories Inc., TX, USA). The methodology currently used in our department and in other reference centers differs from that described in the SAEM study. New reference values are therefore needed.
The objectives of the present study were to:
- •
Optimize the ARR and ARC cut-off points for the screening of PA with the methodology currently being used at our hospital.
- •
Evaluate the correlation and diagnostic sensitivity of ARR and ARC for the screening of PA.
- •
Determine the prevalence of PA in our hypertensive patient population using as the detection value that described in the SAEM study.5
A prospective, cross-sectional study was conducted at a hospital in Buenos Aires (Argentina) in the period 2015–2017, with the evaluation of 345 subjects of both sexes. The study comprised 136 healthy controls and 209 patients diagnosed with arterial hypertension. The following exclusion criteria were applied: (1) individuals under 18years of age; (2) pregnant women; (3) patients with endocrine disorders (thyroid dysfunction without adequate treatment, diabetes mellitus, hyperparathyroidism, adrenal insufficiency, pheochromocytoma, Cushing's syndrome); (4) patients with cardiological contraindications to modifying antihypertensive medication interfering with biochemical parameters (beta-blockers, angiotensin-converting enzyme inhibitors [ACEIs], angiotensin receptor blockers [ARBs], diuretics) or to receiving a normal sodium diet; and (5) patients with kidney, heart or liver failure.
The included subjects were clinically evaluated, with the recording of anthropometric parameters (weight, height, the body mass index [BMI], and blood pressure). Blood pressure was measured using Omron HEM-7200 oscillometric tensiometers. The blood pressure values were obtained according to the guidelines of the European Society of Hypertension,6 the average of three recordings on each arm being calculated: at baseline, and after 3 and 5min.
Biochemical measurements were requested for the assessment of the renin–angiotensin–aldosterone system (RAAS). Patients with a history of arterial hypertension (AHT) receiving antihypertensive treatment were evaluated by the AHT department to determine the feasibility of switching their medication to drugs that would not interfere with the measurement of A and R. Beta-blockers, ACEIs and ARBs were discontinued for two weeks, and diuretics for 4–6weeks, with a switch being made to calcium antagonists (amlodipine) in the absence of cardiological contraindications. Potassium supplementing was prescribed when necessary. The patients were instructed to follow a normal sodium diet during the two weeks before the study, and an ion profile was requested before blood sampling. The measurements were made under conditions of normokalemia.
All the included subjects gave their informed consent to their participation in the study.
Laboratory methodsSampling was performed in the morning between 8:00 am and 9:00 am, under 2h post-walking conditions, in a tube with EDTA-K2. After centrifugation, the plasma samples were aliquoted and stored immediately at −20°C until processing. Each aliquot was thawed a single time. We determined A with a solid phase competitive RIA (RIAZENco, Zentech S.A., Belgium), PRA using a solid phase RIA (DiaSorin Inc., USA), and RC with a chemiluminescent technique on an automated platform (LIAISON, DiaSorin, Saluggia, Italy). The following reference ranges were adopted in accordance with the specifications of the manufacturer: A 3.8–30ng/dl, PRA 1.3–3.9ng/ml/h and RC 4.4–46.4μIU/ml.
Study designThe following was calculated for the screening of aldosteronism: ARR based on the A (ng/dl)/PRA (ng/ml/h) ratio and ARC using the A (ng/dl)/RC (μIU/ml) ratio. Suspected PA was based on ARR values >36ng/dl/(ng/ml/h) associated with aldosterone measurements of ≥15ng/ml (cut-off points established in a previous national study),5 consistent with current guidelines2 and the international literature.7
In cases of pathological ARR, the diagnosis of PA was confirmed by captopril and/or saline overload testing to demonstrate the lack of suppression of aldosterone production.2 The current literature does not identify any concrete confirmatory test as the gold standard. In our department we use the captopril test for greater patient safety, though saline overload is performed in some cases in which captopril is not available, depending on the clinical condition of the patient.
In the saline overload test8 we administered 2l of physiological saline solution (0.9%) via the intravenous route as a 4h infusion. The blood samples for the determinations of PRA and A were collected at the start of the test and at 4h, with strict blood pressure control. The test is considered positive if the A values persist >10ng/ml.
In the captopril test9 the A and PRA levels were measured at baseline and 1h after 50mg of captopril were administered via the oral route. Under normal conditions, the action of this drug (an ACEI) causes a decrease in A levels and an increase in PRA. The test is considered positive if the A values decrease less than 30% versus the baseline value and PRA remains suppressed. Four patients underwent both tests.
All patients diagnosed with PA based on a pathological confirmation test were subjected to abdominal CAT and selective adrenal vein catheterization were indicated and feasible (33.3% of the patients).
Statistical analysisThe IBM SPSS version 21 statistical package was used. Differences between the groups with nonparametric data distribution were analyzed using the Mann–Whitney U-test, the Kruskal–Wallis test and the Spearman correlation method, and the receiver operating characteristic (ROC) curves were calculated to define the cut-off values for ARR and ARC.
Correlations between ARR and ARC were assessed using the presumptive diagnostic concordance (PDC) as parameter.3 The latter was calculated as the percentage of samples that, based on the laboratory data, are equally classified as under or above the cut-off point established by the literature.5
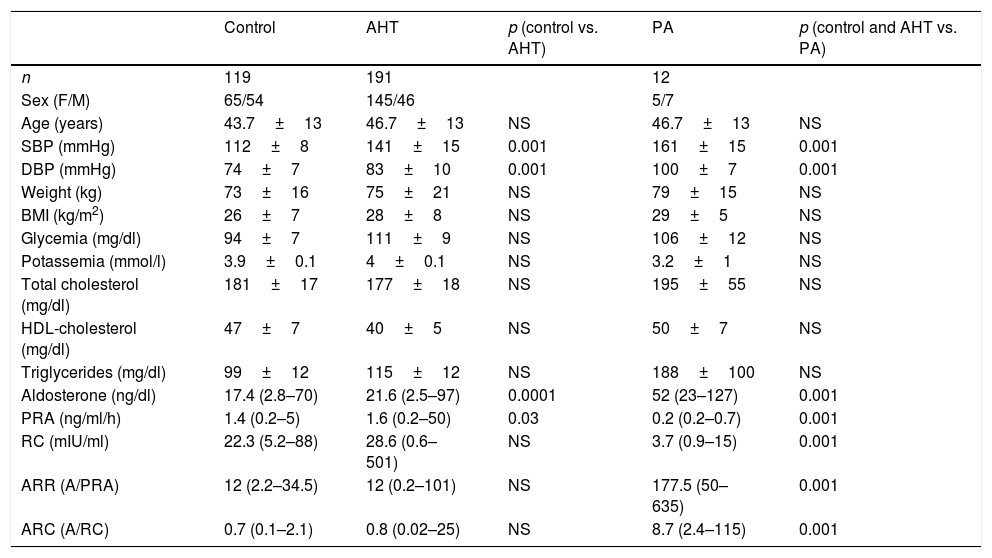
ResultsA total of 345 subjects (136 controls and 209 hypertensive patients) participated in the study. Of these, 23 were lost to follow-up without having completed the requested tests, and were thus excluded. A total of 322 patients were included in the final analysis (119 controls and 203 hypertensive subjects). In this group of hypertensive patients, 12 cases of PA were diagnosed (5.9% of the total hypertensive subjects). Fig. 1 shows the characteristics of the study population.

There were no significant differences in age or clinical characteristics (weight, the BMI) between the groups. The blood pressure values were higher in the hypertensive patients than in the controls, and higher in patients with PA than in subjects with primary hypertension or the controls. The values corresponding to blood glucose, ion profile and lipid profile were similar in all three groups. In patients with PA, the serum potassium levels were lower than in the other two groups, but statistical significance was not reached (p=0.06) (Table 1).
Characteristics of the subjects included in the study.
| Control | AHT | p (control vs. AHT) | PA | p (control and AHT vs. PA) | |
|---|---|---|---|---|---|
| n | 119 | 191 | 12 | ||
| Sex (F/M) | 65/54 | 145/46 | 5/7 | ||
| Age (years) | 43.7±13 | 46.7±13 | NS | 46.7±13 | NS |
| SBP (mmHg) | 112±8 | 141±15 | 0.001 | 161±15 | 0.001 |
| DBP (mmHg) | 74±7 | 83±10 | 0.001 | 100±7 | 0.001 |
| Weight (kg) | 73±16 | 75±21 | NS | 79±15 | NS |
| BMI (kg/m2) | 26±7 | 28±8 | NS | 29±5 | NS |
| Glycemia (mg/dl) | 94±7 | 111±9 | NS | 106±12 | NS |
| Potassemia (mmol/l) | 3.9±0.1 | 4±0.1 | NS | 3.2±1 | NS |
| Total cholesterol (mg/dl) | 181±17 | 177±18 | NS | 195±55 | NS |
| HDL-cholesterol (mg/dl) | 47±7 | 40±5 | NS | 50±7 | NS |
| Triglycerides (mg/dl) | 99±12 | 115±12 | NS | 188±100 | NS |
| Aldosterone (ng/dl) | 17.4 (2.8–70) | 21.6 (2.5–97) | 0.0001 | 52 (23–127) | 0.001 |
| PRA (ng/ml/h) | 1.4 (0.2–5) | 1.6 (0.2–50) | 0.03 | 0.2 (0.2–0.7) | 0.001 |
| RC (mIU/ml) | 22.3 (5.2–88) | 28.6 (0.6–501) | NS | 3.7 (0.9–15) | 0.001 |
| ARR (A/PRA) | 12 (2.2–34.5) | 12 (0.2–101) | NS | 177.5 (50–635) | 0.001 |
| ARC (A/RC) | 0.7 (0.1–2.1) | 0.8 (0.02–25) | NS | 8.7 (2.4–115) | 0.001 |
PRA: plasma renin activity; RC: renin concentration; F: female; PA: primary aldosteronism; AHT: arterial hypertension; BMI: body mass index, weight/height2; M: male; NS: nonsignificant; DBP: diastolic blood pressure; SBP: systolic blood pressure; ARR: aldosterone/plasma renin activity ratio; ARC: aldosterone/renin concentration ratio.
Values are given as the mean±standard deviation (SD) and the renin–angiotensin–aldosterone system (RAAS) measurements as the median and range.
The results corresponding to the renin–angiotensin–aldosterone system (RAAS) are shown in Table 1. On comparing the control group with the hypertensive patients, significant differences in A and PRA values were detected. Hypertensive patients had higher A values (p=0.0001) and lower PRA (p=0.03), with no significant differences in RC or in the ARR and ARC ratios (Table 1). It should be noted that despite the differences found between the controls and the hypertensive patients, the individual values of the measurements in both groups were within the normal range.
All of the controls showed normal ARR and ARC ratios. Among the hypertensive patients, we identified 39 pathological ratios, and confirmatory tests were performed in these cases. In this group, 27 cases corresponded to primary hypertension, while in 12 cases the diagnosis of PA was confirmed.
In the first group we performed 25 captopril and two saline overload tests, all of which proved negative.
Twelve patients had a diagnosis of PA. In this group we performed 7 captopril tests and one saline overload test, while four patients underwent both tests. In the latter the tests were made to confirm the results, which in all cases proved consistent.
Venous catheterization was performed in one-third of the patients (4 cases) in different hospital centers (because this is not available at our institution), with no selectivity being found. For this reason, and based on the clinical and imaging findings, 6 patients underwent unilateral adrenalectomy. The pathology study confirmed the presence of three aldosterone-producing adenomas (APAs), one adrenal carcinoma, a patient with multiple cortical adenomas, and one case reported as normal adrenal gland (after surgery the patient temporarily normalized her aldosterone levels, but hypertension persisted). Four patients were put under medical treatment, with suspected idiopathic bilateral hyperplasia. Two patients presented CAT images consistent with adenoma, but catheterization could not be performed (one patient rejected the procedure and the other had a medical contraindication due to a history of coronary disease). Medical treatment was therefore prescribed.
The patients with PA had a median aldosterone value of 52 (range 23–127) ng/dl, ARR 177.5 (50–653) (ng/dl)/(ng/ml/h) and ARC 8.7 (2.4–115) (ng/dl)/(μIU/ml), which proved significantly higher than in the other two groups.
Determination of cut-off points using current methodologyWe retrospectively calculated ROC curves for ARR (area under the curve [AUC]=0.987, p<0.001, 95% confidence interval [95%CI]: 0.972–1.000) and ARC (AUC=0.975, p<0.001, 95%CI: 0.954–0.996). The optimum cut-off value, considering the best specificity and sensitivity, in a presumed diagnosis of PA was 48.9(ng/dl)/(ng/ml/h) for ARR (sensitivity 100% and specificity 93.6%) and 2.3(ng/dl)/(μIU/ml) for ARC (100% sensitivity and 90.9% specificity) (Fig. 2).

For this ARR value, the positive predictive value (PPV) was 37.50% (95%CI: 19.16–55.84%) and the negative predictive value (NPV) 100% (95%CI: 99.83–100%), with Youden's index (J) 0.94 (95%CI: 0.91–0.96). With regard to ARC, the PPV was 31.43% (95%CI: 14.62–48.24%) and the NPV 100% (95%CI: 99.82–100%), with J=0.92 (95%CI: 0.89–0.95).
In all patients with ARR between 36 and 48.9(ng/dl)/(ng/ml/h) the confirmatory tests proved negative.
In our study, on considering the total population (controls, primary AHT and PA), the PDC between ARR and ARC was 96.6%.
Moreover, a good correlation was observed between ARR and ARC in both the overall population (ρ=0.83; p<0.0001) (Fig. 3) and in the control group (ρ=0.74; p<0.0001), the patients with primary AHT (ρ=0.85; p<0.0001), and in those with PA (r=0.89; p<0.0001).
Discussion/(ng(ml/h) and ARC: 2.3(ng/dl)/(mU/l).")
In the present study we defined cut-off values of 48.9(ng/dl)/(ng/ml/h) for ARR (sensitivity 100% and specificity 93.6%) and 2.3 (ng/dl)/(μIU/ml) for ARC (100% sensitivity and 90.9% specificity), determining a 5.9% prevalence of PA in our population. This is consistent with the figures reported in the current literature.2
The early detection of PA in hypertensive patients is essential in order to resolve the disease, and moreover allows for the reversal of organ damage secondary to excess aldosterone. The A/R ratio is widely used as a screening test for PA in hypertensive patients, but high sensitivity measurements should be obtained for this purpose. The ranges of the published guidelines are broad and variable; it is thus suggested that each population should have its own reference value. According to the guidelines of the Endocrine Society,2 the range is 20–40(ng/dl)/(ng/ml/h) for ARR and 2.4–4.9(ng/dl)/(μIU/ml) for ARC. The Taiwanese Society10 advocates equal ARR values and a range of 2.4–7.7(ng/dl)/(μIU/ml) for ARC. In 2009, the Japanese Society of Endocrinology11 recommended an ARR cut-off point>20(ng/dl)/(ng/ml/h) for suspected PA, while the PAPY (PA Prevalence in Hypertensives) study12 used an ARR value>40(ng/dl)/(ng/ml/h).
In the multicenter SAEM study,5 cut-off values of 36(ng/dl)/(ng/ml/h) were set for ARR and of 2.39(ng/dl)/(μIU/dl) for ARC.
Following the diagnosis of the PA population with confirmatory tests, we retrospectively evaluated the cut-off points to optimize them according to our methodology, defining new cut-off values of 48.9(ng/dl)/(ng/ml/h) for ARR and 2.3(ng/dl)/(μIU/ml) for ARC. We consider that the difference between the SAEM cut-off points and our own results is mainly due to the change in methodology as a consequence of technological development, though it cannot be discarded that the difference may be due in part to the different populations involved. Rossi et al.,7 using the same methodology, established cut-off values of 38.7(ng/dl)/(ng/ml/h) for ARR and 2–3(ng/dl)/(mU/l) for ARC, with high specificity and sensitivity. These figures are very close to our own.
It should be noted that by updating the cut-off values, unnecessary confirmatory tests can be avoided. In this population, on comparing the ARR cut-off point from the study of the SAEM5 with our own value, 18% of the confirmatory tests would have been avoided.
The technique for the determination of RC used in the present study (chemiluminescence; LIAISON, DiaSorin) is easier to implement in the clinical laboratory (due to its better reproducibility, the shorter processing time and independence of the substrate-angiotensinogen). As a result, it has been used on a routine basis and for a number of years by international reference centers with extensive experience in the field.7,13,14 Rossi et al.7 found a high level of correlation (r=0.92, p<0.0001) between the PRA and RC measures, with ARC being superior to ARR for the detection of PA in a population of hypertensive subjects. Unger et al.15 likewise found a very good correlation (r=0.91, p<0.001) between the two renin measurement methods in a population of adrenal incidentaloma patients without any suspension of the hypertensive medication, showing the clinical superiority of RC due to the technical benefits of this determination. Glinicki et al.16 moreover recorded very good correlations between ARR and ARC in both the supine position and after two hours in the standing position, the values being similar to those reported by Ferrari et al.17 In our study, ARR and ARC showed a very good correlation in both the global population and in the analyzed subgroups, with a presumptive diagnostic concordance (PDC) of 96.6%. Both areas under the curve were comparable, with similar sensitivity and specificity in the detection of PA. Thus, and considering the technical benefits described above and their stability in the face of the different clinical situations reported by the authors, we believe that ARC is a useful tool in clinical practice, being equivalent or superior to ARR.
To our knowledge, this is the first study conducted in Argentina with this RC and ARC methodology. The strengths of our study are that: (1) all patients were recruited and studied at the same site, thus ensuring the uniformity of the diagnostic protocol; and (2) all patients were evaluated with both renin measurement methods.
Our study also has weaknesses: (1) there were relatively few male hypertensive patients; (2) confirmatory tests were not performed in all evaluated patients (only in patients with pathological ARR and ARC ratios); and (3) a pathological diagnosis was not available in 100% of the patients with PA.
ConclusionsWe have determined new cut-off values of 48.9(ng/dl)/(ng/ml/h) for ARR and 2.3(ng/dl)/(μIU/ml) for ARC in PA screening in our population, with the identification of a PA prevalence of 5.9% after diagnostic confirmation. To our knowledge, this is the first study conducted in our country with automated methodology for measuring renin (chemiluminescence; LIAISON, DiaSorin), which is also used by international reference centers for the management of this disorder. In our experience, ARR and ARC offered a very good sensitivity and concordance as screening methods.
The study needs to be expanded with a greater number of patients in order to confirm the results obtained, and to assess their impact upon the diagnosis and treatment of patients with secondary hypertension.
Conflicts of interestNone.
Please cite this article as: Eugenio Russmann ML, Delfino L, Fierro F, Santoro S, Peréz M, Caruso G, et al. Hiperaldosteronismo primario: puntos de corte del cociente aldosterona/renina. Endocrinol Diabetes Nutr. 2019;66:361–367.
