


Non-alcoholic fatty liver disease (NAFLD) is highly prevalent in morbid obesity (MO). A considerable proportion of patients with MO have non-alcoholic steatohepatitis (NASH). Liver biopsy (LB) is the only procedure that reliably differentiates NASH from other stages of NAFLD, but its invasive nature prevents it from being generalisable. Hence, non-invasive assessment is critical in this group of patients.
ObjectivesTo report NAFLD/NASH prevalence in a cohort of patients with MO and to identify predictors of NASH.
MethodsFifty-two consecutive patients subjected to bariatric surgery in a University hospital in Spain underwent LB. Anthropometric, clinical and biochemical variables were registered. According of the results of the LB, individuals were classified by whether they had NASH or not. Multiple logistic regression analysis was performed to identify independent factors associated with NASH.
ResultsNAFLD was reported in 94.2% of the patients, simple steatosis was present in 51.92% and NASH in 42.31%. Meanwhile, 17.3% of patients exhibited significant fibrosis (≥F2). HIGHT score for NASH risk was established using five independent predictors: systemic Hypertension, Insulin resistance, Gamma-glutamyl transferase, High density lipoprotein cholesterol and alanine Transaminase. This score ranges from 0 to 7 and was used to predict NASH in our cohort (area under the receiver operator characteristic curve 0.846). A score of 4 or greater implied high risk (sensitivity 77.3%, specificity 73.3%, positive predictive value 68%, negative predictive value 81.5%, accuracy 75%).
ConclusionsNAFLD is practically a constant in MO with a considerable proportion of patients presenting NASH. The combination of five independent predictors in a scoring system may help the clinician optimise the selection of patients with MO for LB.
La enfermedad del hígado graso no alcohólico (HGNA) es muy prevalente en la obesidad mórbida (OM). Una proporción considerable de pacientes con OM padece esteatohepatitis no alcohólica (EHNA). La biopsia hepática (BH) es el único procedimiento que permite diferenciar de forma fiable la EHNA de otros estadios del HGNA, pero su carácter invasivo impide generalizar su uso. Por lo tanto, en este grupo de pacientes es fundamental disponer de herramientas que permitan llevar a cabo una evaluación no invasiva.
ObjetivosInformar sobre la prevalencia de HGNA/EHNA en una cohorte de pacientes con OM e identificar los predictores de EHNA.
MétodosSe practicó una BH a 52 pacientes consecutivos sometidos a una cirugía bariátrica en un hospital universitario de España. Se registraron las variables antropométricas, clínicas y bioquímicas. De acuerdo con los resultados de la BH, los individuos fueron clasificados según presentaran o no EHNA. Se realizó un análisis de regresión logística múltiple para identificar los factores independientes asociados a la EHNA.
ResultadosSe informó que el 94,2% de los pacientes presentaban HGNA, el 51,92% esteatosis simple y el 42,31%, EHNA. Por otro lado, el 17,3% de los pacientes presentaban una fibrosis significativa (≥F2). La puntuación HIGHT para el riesgo de EHNA se estableció utilizando cinco factores predictivos independientes: Hipertensión sistémica, Resistencia a la insulina, Gamma-glutamil transferasa, Colesterol de lipoproteínas de alta densidad y Alanina transaminasa. Esta puntuación oscila de 0 a 7 y se utilizó para predecir la EHNA en nuestra cohorte (área bajo la curva característica del operador receptor 0,846). Una puntuación de 4, o superior, implicaba un riesgo elevado (sensibilidad 77,3%, especificidad 73,3%, valor predictivo positivo 68%, valor predictivo negativo 81,5%, precisión 75%).
ConclusionesEl HGNA es prácticamente una constante en la OM, con una proporción considerable de pacientes que presentan EHNA. La combinación de cinco factores predictivos independientes en un sistema de puntuación puede ayudar al médico a optimizar la selección de pacientes con OM que deben someterse a una BH.
Non-alcoholic fatty liver disease (NAFLD) is the most common cause of liver disease, affecting 25–30% of the general population.1,2 NAFLD has a spectrum of disease ranging from simple steatosis (SS) and non-alcoholic steatohepatitis (NASH) to fibrosis and cirrhosis. Despite the high prevalence and severity of hepatic illness, NAFLD remains underdiagnosed. This is in part because of limitations in diagnosis as a consequence of few symptoms, clinical underestimation,2 lack of accurate non-invasive methods3,4 and limited indication of liver biopsy (LB).5
NAFLD is considered the hepatic manifestation of metabolic syndrome (MS), and consequently, it is associated with obesity, type 2 diabetes (T2D) and systemic hypertension (HTN).6 Indeed, the most important risk factors for NASH development and progression to advanced fibrosis are insulin resistance (IR) and T2D, typically present in patients with obesity.7
Compared with non-invasive tests for hepatic steatosis and fibrosis, the development of NASH biomarkers has lagged behind, in part owing to the complex biology and dynamic activity of NASH.8 This makes a proper stratification of patients at risk of more severe stages of disease difficult. Biochemical liver markers have traditionally been used for assessing liver injury, including NASH. Recently, new biomarkers have been identified, with cytokeratin-18 fragment being the most studied to assess the presence of inflammation. However, its overall accuracy is moderate at best.4 Similarly, radiological modalities such as abdominal ultrasonography, transient elastography, computed tomography and magnetic resonance imaging are useful for assessing liver disease. These techniques can detect hepatic steatosis or fibrosis, although they are unable to distinguish NASH from SS.9,10
LB is the only procedure that reliably diagnoses and grades NASH.2 Bariatric surgery (BS) offers a key opportunity to perform an LB and to diagnose an important and currently underdiagnosed illness.11 However, it is an invasive procedure and complications such as haemorrhage, and even mortality, have been reported, mostly in the outpatient setting.12 Contrarily, in patients with obesity undergoing BS with an unknown cirrhosis-related risk of bleeding, the rate of liver biopsy-related complications is likely to be between 0% and 0.2%.13
Morbid obesity (MO) presents additional issues for assessing liver disease. First, it comprises a group with many metabolic risk factors, in which an already high body mass index (BMI) does not distinguish individuals with greater risk.7 Further, novel biomarkers perform modestly and are less validated in MO.8 Moreover, imaging modalities are less accurate due to the adiposity itself.3,4 Finally, percutaneous LB has been considered relatively contraindicated in MO because of technical concerns,12 such us the difficulty to identify the flank site.
Due to their peculiar characteristics, patients with MO are frequently excluded or underrepresented in many studies in spite of being high-risk individuals. Hence, there is a special need to improve non-invasive assessment. Because of the modest accuracy of individual markers of NASH, combinations of markers in a model/score have been examined to increase diagnostic utility. A new scoring system could better identify those at higher risk who might benefit most from an LB or, conversely, could identify those at low risk of NASH, thereby avoiding the risk and expense of liver sampling. Therefore, this study aimed to report the NAFLD/NASH prevalence in our cohort of individuals with MO and to identify if there are clinical, anthropometric or biochemical factors that could serve as predictors for establishing the risk of having NASH.
Patients and methodsWe performed a cross-sectional analysis in a cohort of patients with MO undergoing elective laparoscopic BS with LB in a hospital in Spain over a two-year period. A total of 102 patients underwent BS in that period, 40 of which refused consent due to concerns about the study. Sixty-two participants provided informed written consent to participate in the study, which was conducted in accordance with the Declaration of Helsinki. The study was approved by the hospital ethics committee and registered (HULP: PI-2824).
Patients with severe obesity (BMI>35) with at least one comorbidity factor related to obesity (e.g. HTN or T2D) or with MO (BMI>40), who had attempted weight reduction by other means for at least five years, were considered for entry into an extensive preoperative evaluation, as recommended by international and the Spanish consensus.14 This includes clinical assessment by a multidisciplinary team, anthropometric measurements and laboratory tests. On the day the informed consent was signed, an assessment of alcohol consumption was obtained. Average daily consumption of alcohol was registered in grams per day. All patients meeting the criteria for bariatric surgery and absence of current or history of excessive drinking were included in the study.
Exclusion criteria were applied to individuals considered to be in vulnerable groups (mentally ill, institutionalised, or aged under 18 years old), recent or previous abuse of alcohol (average daily consumption of alcohol of 20g/day for women and 30g/day for men, and no history of past excessive drinking for a period longer than two years at any time in the past 20 years), and with previous episodes of acute or chronic viral hepatitis, and other chronic liver diseases.
Clinical and laboratory assessmentThe main characteristics regarding demographics, anthropometric and laboratory features were registered. Anthropometric data consisted of weight, BMI and waist circumference. Body composition was assessed by bioelectric impedance using inBody270 (InBody Co., Seoul, Korea). Comorbidities associated with obesity were recorded. The diagnosis of T2D and pre-diabetes was based on the criteria of the American Diabetes Association. MS was diagnosed according to the National Cholesterol Education Program Adult Treatment Panel III (2005) guidelines.
Results of serum liver function tests and those related to cardiometabolic status, particularly those implicated in IR (usually linked to adiposity), were included. We indirectly assessed IR by calculating two scores, the Homeostasis Model Assessment (HOMA-IR) and the Quantitative Insulin Sensitivity Check Index (QUICKI). The HOMA-IR provides a surrogate estimate of IR in persons without diabetes. It is a well-known index, in which a value higher than 2.5 is acknowledged as significant for IR.15 QUICKI is a validated method for IR evaluation in patients with obesity, where the IR index is equal to 1/QUICKI, and the refractory IR profile is defined by an IR index equal or superior to 3.13.16
Abdominal ultrasonography was performed in all participants to evaluate steatosis. Transient elastography (Fibroscan®, Echosens, France) was performed for measuring liver stiffness using M and XL probes. Measures were considered reliable when the ratio between median stiffness and interquartile range was <30% and success rate was >60%. Due to logistical issues, the technique was performed in 18 patients only. Patients were considered as at risk when median stiffness was ≥8kPa and categorised as having significant fibrosis or not (≥F2).
LB and histopathological evaluationLB was performed during laparoscopic BS through a wedge excision immediately after opening the abdominal cavity, during the first part of the surgical procedure. Approximately 2cm of viable tissue, measuring 2cm per side, was obtained. Biopsies measuring 10mm in length or having 10 portal areas were generally considered suitable for diagnosis.11,12 Biopsy specimens were fixed and stained with haematoxylin and eosin and Masson's trichrome in a standard manner. Biopsies were interpreted by a single experienced liver pathologist (M.C.M.), who was blinded to the patients’ clinical data.
To determine the activity of liver disease, we used the NAS score,17 which is a semi-quantitative histological scoring system defined as the unweighted sum of scores for steatosis (0–3), lobular inflammation (0–3) and ballooning (0–2). This score ranges from 0 to 8. To diagnose NASH, we utilised a scoring classification suggested by Bedossa et al.18 In this algorithm, all cases with at least grade 1 steatosis were diagnosed as NAFLD independently of other criteria, whereas when each of the three features (steatosis, lobular inflammation and ballooning) was classified as at least grade 1, then the lesion was categorised as NASH (steatosis 1, 2, or 3+hepatocyte ballooning 1 or 2+lobular inflammation 1 or 2).
Liver fibrosis was assessed semi-quantitatively using the Kleiner scale as follows: F0, normal; F1, focal pericellular fibrosis in zone 3 (F1 was divided into 3 subclasses: 1a, mild pericellular fibrosis in zone 3; 1b, moderate pericellular fibrosis in zone 3; and 1c, portal fibrosis); F2, perivenular and pericellular fibrosis confined to zones 2 and 3, with or without portal or periportal fibrosis; F3, bridging or extensive fibrosis with architectural distortion and no clear-cut cirrhosis; and F4, cirrhosis.17
Definition of study variablesThe outcome of interest was a final pathologic diagnosis of NASH. Thus, we categorised patients into two groups: patients without NASH (normal liver histology or SS) and patients with NASH which were the dependent variable. The independent variables assessed included demographics, clinical characteristics (comorbidities related with obesity), laboratory data and results of preoperative ultrasonography.
Statistical analysisStata/IC v.15.1 (StataCorp LLC, College Station, TX, USA) was used for statistical analysis. Continuous variables are expressed as means±standard deviation in case of normal distributions, or medians (interquartile range) otherwise. We registered them as continuous variables to make comparison between groups, or as dichotomous (normal/abnormal) variables, when appropriate. Normality was examined using the Shapiro–Wilk test, pp-plots and boxplot. The Student t-test was used for parametric data and the Wilcoxon test for non-parametric data. Categorical variables were expressed as numbers (with percentages) and Chi square or Fisher's exact tests were used to compare them. The Pearson's correlation coefficient (values of R) was calculated to assess the association between calculated and histological score. A p value of <0.05 was considered statistically significant.
Continuous variables associated with NASH at p<0.1 on univariate analysis were assessed with the area under the receiver operator characteristic (AUROC) curves, for establishing an appropriate cutoff to introduce them in the multivariate model as dichotomous variables, along with significant categorical variables. Multiple logistic regression analysis was performed to identify independent factors associated with NASH and try to derive the predictors required for a clinically useful scoring system in MO. We followed the listwise strategy, in which the missing values are omitted for the analysis. The β regression coefficient, p value, as well as odds ratios (OR) and its 95% confidence intervals (CI) for each of the selected risk predictors were estimated. Forward stepwise selection was performed for choosing the variables for the adjusted model in the multivariate analysis. The goodness of fit of the model was evaluated using the Hosmer–Lemeshow (HL) method. This method generated separate models for all possible combinations of 10 parameters that have been shown to be related to NASH (1023 models) and then determined an optimal set of predictors with regard to goodness of fit and model parsimony (i.e. Akaike information [AIC] criterion and AUC). Data was available from 51 individuals (1 missing value, 1.92%).
The estimated regression coefficients from the final model were then rounded to the nearest whole number to obtain the points assigned to each predictor included in the final model. The selected sets of predictors were also evaluated in terms of sensibility (Se), specificity (Sp) and AUROC for predicting NASH. Due to the small sample size, we did not carry out a validation technique for assessing the model's performance.
ResultsSixty-two patients signed the informed consent and were recruited in the cohort. Ten patients were excluded due to history of excessive drinking (n=2), history of consumption of hepatotoxic drugs (n=1), and technical difficulty for obtaining the LB during the operation (n=7), leaving a total of 52 patients who had an LB (Fig. 1).

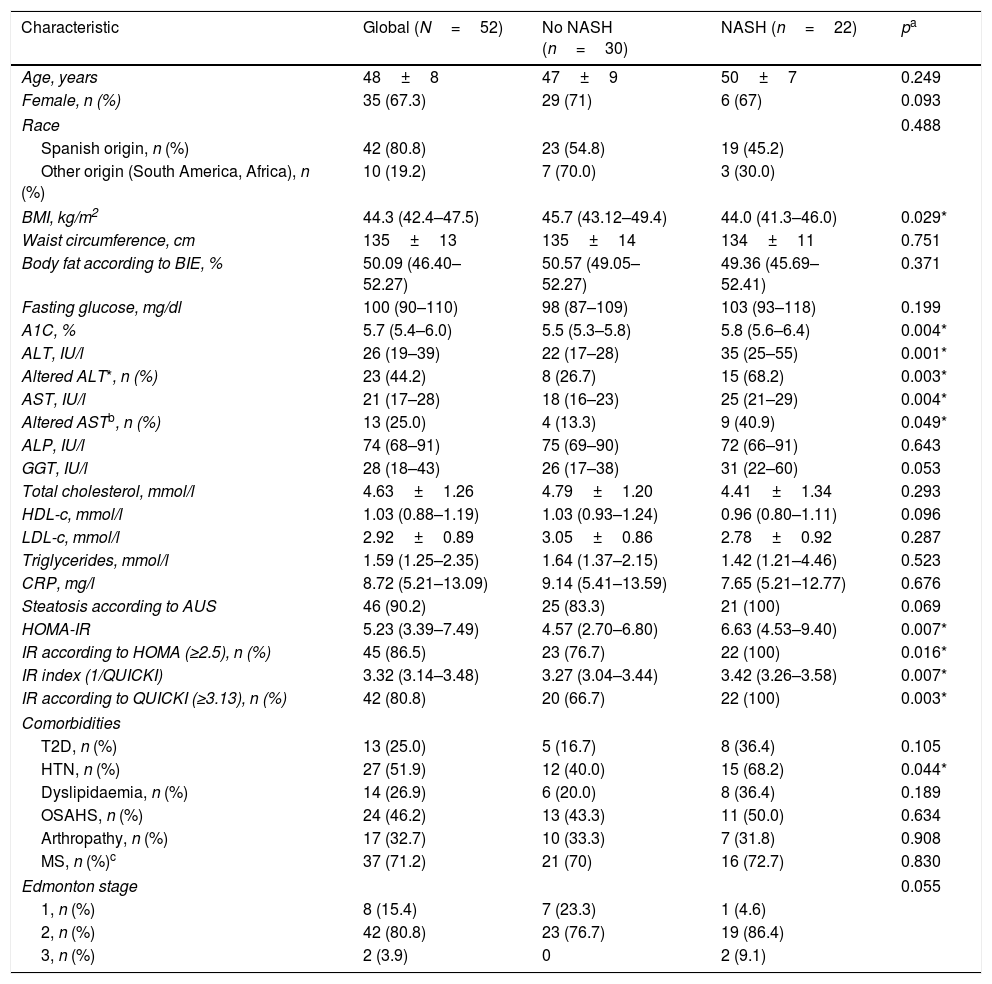
The characteristics of the cohort are depicted in Table 1. BMI, glycated haemoglobin (A1C), alanine transaminase (ALT), aspartate transaminase (AST), HOMA-IR and QUICKI-IR index values were significantly different (p<0.05) between patients with NASH compared with the rest of the cohort (Fig. 2). According to transient elastography, all patients (9 out of 9) exhibited significant fibrosis (≥F2) in the NASH group compared with the rest of the cohort (100% vs 50%, respectively).
Clinical, anthropometric and laboratory characteristics.
| Characteristic | Global (N=52) | No NASH (n=30) | NASH (n=22) | pa |
|---|---|---|---|---|
| Age, years | 48±8 | 47±9 | 50±7 | 0.249 |
| Female, n (%) | 35 (67.3) | 29 (71) | 6 (67) | 0.093 |
| Race | 0.488 | |||
| Spanish origin, n (%) | 42 (80.8) | 23 (54.8) | 19 (45.2) | |
| Other origin (South America, Africa), n (%) | 10 (19.2) | 7 (70.0) | 3 (30.0) | |
| BMI, kg/m2 | 44.3 (42.4–47.5) | 45.7 (43.12–49.4) | 44.0 (41.3–46.0) | 0.029* |
| Waist circumference, cm | 135±13 | 135±14 | 134±11 | 0.751 |
| Body fat according to BIE, % | 50.09 (46.40–52.27) | 50.57 (49.05–52.27) | 49.36 (45.69–52.41) | 0.371 |
| Fasting glucose, mg/dl | 100 (90–110) | 98 (87–109) | 103 (93–118) | 0.199 |
| A1C, % | 5.7 (5.4–6.0) | 5.5 (5.3–5.8) | 5.8 (5.6–6.4) | 0.004* |
| ALT, IU/l | 26 (19–39) | 22 (17–28) | 35 (25–55) | 0.001* |
| Altered ALT*, n (%) | 23 (44.2) | 8 (26.7) | 15 (68.2) | 0.003* |
| AST, IU/l | 21 (17–28) | 18 (16–23) | 25 (21–29) | 0.004* |
| Altered ASTb, n (%) | 13 (25.0) | 4 (13.3) | 9 (40.9) | 0.049* |
| ALP, IU/l | 74 (68–91) | 75 (69–90) | 72 (66–91) | 0.643 |
| GGT, IU/l | 28 (18–43) | 26 (17–38) | 31 (22–60) | 0.053 |
| Total cholesterol, mmol/l | 4.63±1.26 | 4.79±1.20 | 4.41±1.34 | 0.293 |
| HDL-c, mmol/l | 1.03 (0.88–1.19) | 1.03 (0.93–1.24) | 0.96 (0.80–1.11) | 0.096 |
| LDL-c, mmol/l | 2.92±0.89 | 3.05±0.86 | 2.78±0.92 | 0.287 |
| Triglycerides, mmol/l | 1.59 (1.25–2.35) | 1.64 (1.37–2.15) | 1.42 (1.21–4.46) | 0.523 |
| CRP, mg/l | 8.72 (5.21–13.09) | 9.14 (5.41–13.59) | 7.65 (5.21–12.77) | 0.676 |
| Steatosis according to AUS | 46 (90.2) | 25 (83.3) | 21 (100) | 0.069 |
| HOMA-IR | 5.23 (3.39–7.49) | 4.57 (2.70–6.80) | 6.63 (4.53–9.40) | 0.007* |
| IR according to HOMA (≥2.5), n (%) | 45 (86.5) | 23 (76.7) | 22 (100) | 0.016* |
| IR index (1/QUICKI) | 3.32 (3.14–3.48) | 3.27 (3.04–3.44) | 3.42 (3.26–3.58) | 0.007* |
| IR according to QUICKI (≥3.13), n (%) | 42 (80.8) | 20 (66.7) | 22 (100) | 0.003* |
| Comorbidities | ||||
| T2D, n (%) | 13 (25.0) | 5 (16.7) | 8 (36.4) | 0.105 |
| HTN, n (%) | 27 (51.9) | 12 (40.0) | 15 (68.2) | 0.044* |
| Dyslipidaemia, n (%) | 14 (26.9) | 6 (20.0) | 8 (36.4) | 0.189 |
| OSAHS, n (%) | 24 (46.2) | 13 (43.3) | 11 (50.0) | 0.634 |
| Arthropathy, n (%) | 17 (32.7) | 10 (33.3) | 7 (31.8) | 0.908 |
| MS, n (%)c | 37 (71.2) | 21 (70) | 16 (72.7) | 0.830 |
| Edmonton stage | 0.055 | |||
| 1, n (%) | 8 (15.4) | 7 (23.3) | 1 (4.6) | |
| 2, n (%) | 42 (80.8) | 23 (76.7) | 19 (86.4) | |
| 3, n (%) | 2 (3.9) | 0 | 2 (9.1) | |
Data are expressed as numbers (percentages), median (interquartile range) and mean (standard deviation).
ALT: alanine transaminase; ALP: alkaline phosphatase; AST: aspartate transaminase; ATP3: Adult Treatment Panel III; AUS: abdominal ultrasound; BIE: bioelectric impedance; BMI: body mass index; CRP: C-reactive protein; GGT: gamma-glutamyl transferase; A1C: glycated haemoglobin; HDL-c: high-density lipoprotein cholesterol; HOMA-IR: Homeostatic Model Assessment for Insulin Resistance; IR: insulin resistance; HTN: systemic hypertension; LDL-c: low-density lipoprotein cholesterol; MS: metabolic syndrome; NASH: non-alcoholic steatohepatitis; NCEP: National Cholesterol Education Program; OSAHS: obstructive sleep apnoea hypopnoea syndrome; QUICKI: Quantitative Insulin Sensitivity Check Index; T2D: type 2 diabetes mellitus.

Distribution of significant biochemical variables according to nonalcoholic steatohepatitis. ALT: alanine transaminase; AST: aspartate transaminase; GGT: gamma glutamyl transferase; HbA1c: glycated haemoglobin; HDL-c: high density lipoprotein cholesterol; NASH: nonalcoholic steatohepatitis; QUICKI: Quantitative Insulin Sensitivity Check Index.
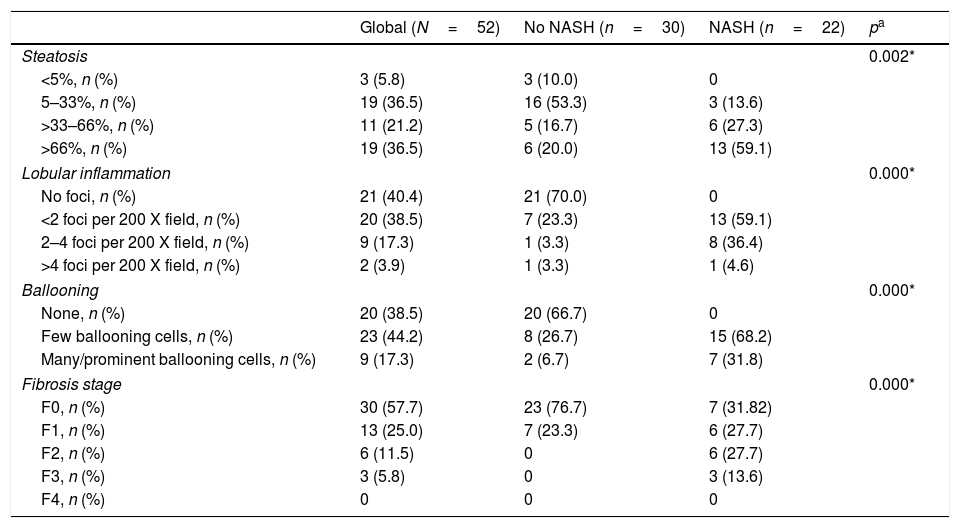
The mean liver core length per sample was 19.2±5.5mm, with 15.1±3.8 portal tracts. Similar to reports by Bedossa et al.,18 3 patients (5.77%) had normal liver histology, 27 (51.92%) SS (NAFLD without NASH) and 22 patients (42.31%) had NASH. Nine individuals (17.3%) had significant or advanced fibrosis (≥F2), all of them in the NASH group. The NASH group exhibited a significantly higher proportion of liver damage according to NAS score, as well as more advanced fibrosis stages (Table 2). No complications related to liver sampling were reported until discharge from hospital.
Histologic characteristics.
| Global (N=52) | No NASH (n=30) | NASH (n=22) | pa | |
|---|---|---|---|---|
| Steatosis | 0.002* | |||
| <5%, n (%) | 3 (5.8) | 3 (10.0) | 0 | |
| 5–33%, n (%) | 19 (36.5) | 16 (53.3) | 3 (13.6) | |
| >33–66%, n (%) | 11 (21.2) | 5 (16.7) | 6 (27.3) | |
| >66%, n (%) | 19 (36.5) | 6 (20.0) | 13 (59.1) | |
| Lobular inflammation | 0.000* | |||
| No foci, n (%) | 21 (40.4) | 21 (70.0) | 0 | |
| <2 foci per 200 X field, n (%) | 20 (38.5) | 7 (23.3) | 13 (59.1) | |
| 2–4 foci per 200 X field, n (%) | 9 (17.3) | 1 (3.3) | 8 (36.4) | |
| >4 foci per 200 X field, n (%) | 2 (3.9) | 1 (3.3) | 1 (4.6) | |
| Ballooning | 0.000* | |||
| None, n (%) | 20 (38.5) | 20 (66.7) | 0 | |
| Few ballooning cells, n (%) | 23 (44.2) | 8 (26.7) | 15 (68.2) | |
| Many/prominent ballooning cells, n (%) | 9 (17.3) | 2 (6.7) | 7 (31.8) | |
| Fibrosis stage | 0.000* | |||
| F0, n (%) | 30 (57.7) | 23 (76.7) | 7 (31.82) | |
| F1, n (%) | 13 (25.0) | 7 (23.3) | 6 (27.7) | |
| F2, n (%) | 6 (11.5) | 0 | 6 (27.7) | |
| F3, n (%) | 3 (5.8) | 0 | 3 (13.6) | |
| F4, n (%) | 0 | 0 | 0 | |
NASH: non-alcoholic steatohepatitis.
The candidate independent variables included as predictive markers for NASH were sex, HTN, BMI, A1C, ALT, AST, gamma-glutamyl transferase (GGT), high-density lipoprotein cholesterol (HDL-c), QUICKI-IR index and Edmonton stage. Taking into consideration that both HOMA and QUICKI-IR indexes evaluate IR, we excluded the former to avoid collinearity.
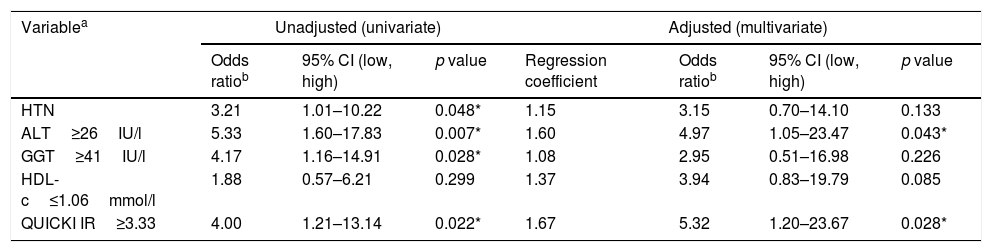
Five factors were found to have independent predictive effects in the final regression model (AIC 59.7, AUC 0.84, pfitHL 0.910). These were HTN, ALT, GGT, HDL-c and QUICKI-IR index. Values for OR, lesser and greater CI, the calculated cutoffs and p values obtained in the first step of the analysis and in the final regression model are shown in Table 3. Combining these factors, we assessed the performance of the model to predict NASH by calculating the AUROC curve, which was 0.846 (95% CI: 0.740–0.951), with a Se of 72.7% (95% CI: 51.8–86.8), Sp of 82.8% (95% CI: 65.5–92.4), positive predictive value (PPV) of 76.2% and negative predictive value (NPV) of 80.0%. These parameters reflect a good global performance of the model (Fig. 3).
Independent factors associated with NASH.
| Variablea | Unadjusted (univariate) | Adjusted (multivariate) | |||||
|---|---|---|---|---|---|---|---|
| Odds ratiob | 95% CI (low, high) | p value | Regression coefficient | Odds ratiob | 95% CI (low, high) | p value | |
| HTN | 3.21 | 1.01–10.22 | 0.048* | 1.15 | 3.15 | 0.70–14.10 | 0.133 |
| ALT≥26IU/l | 5.33 | 1.60–17.83 | 0.007* | 1.60 | 4.97 | 1.05–23.47 | 0.043* |
| GGT≥41IU/l | 4.17 | 1.16–14.91 | 0.028* | 1.08 | 2.95 | 0.51–16.98 | 0.226 |
| HDL-c≤1.06mmol/l | 1.88 | 0.57–6.21 | 0.299 | 1.37 | 3.94 | 0.83–19.79 | 0.085 |
| QUICKI IR≥3.33 | 4.00 | 1.21–13.14 | 0.022* | 1.67 | 5.32 | 1.20–23.67 | 0.028* |
ALT: alanine transaminase; CI: confidence interval; GGT: gamma-glutamyl transferase; HDL-c: high-density lipoprotein cholesterol; HT: systemic hypertension; NASH: non-alcoholic steatohepatitis; QUICKI: Quantitative Insulin Sensitivity Check Index; ROC: receiver operator characteristic.

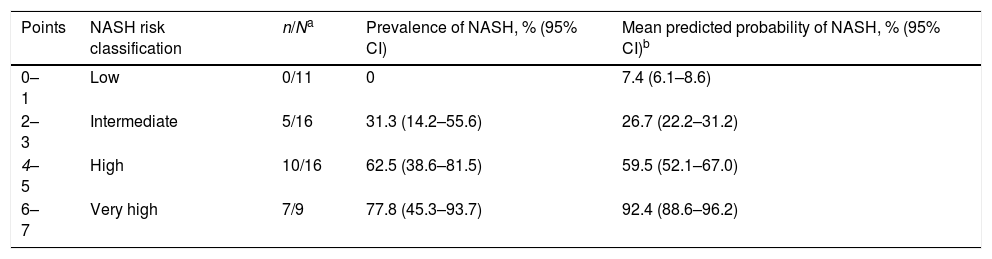
Considering that the results came from a small cohort of patients which could preclude the utilisation of five predictors, we established the HIGHT score (HTN=1 point, QUICKI-IR index ≥3.33=2 points, GGT ≥41IU/l=1 point, HDL-c ≤1.06mmol/l=1 point and ALT ≥26IU/l=2 points). The HIGHT score was obtained in each patient and NASH prevalence was estimated for every possible result, then the probability of the event was calculated by logistic regression for each patient and the score obtained (Table 4). The optimal cutoff point based on the ROC curve for maximum efficiency was 4, with Se of 77.3%, Sp of 73.3%, PPV of 68.0%, NPV of 81.5% and accuracy of 75.0% for predicting NASH, although reflecting better performance for excluding more advanced stages of the disease. Compared to histologic diagnosis of NASH, HIGHT score had a global agreement of 65.4%, a positive specific agreement of 69.0% and a negative specific agreement of 60.9%, with an accuracy of 66.7%. Moreover, HIGHT score was significantly correlated with NAS score (r=0.673, p<0.05).
Prevalence of NASH according to the score points and probability estimation.
| Points | NASH risk classification | n/Na | Prevalence of NASH, % (95% CI) | Mean predicted probability of NASH, % (95% CI)b |
|---|---|---|---|---|
| 0–1 | Low | 0/11 | 0 | 7.4 (6.1–8.6) |
| 2–3 | Intermediate | 5/16 | 31.3 (14.2–55.6) | 26.7 (22.2–31.2) |
| 4–5 | High | 10/16 | 62.5 (38.6–81.5) | 59.5 (52.1–67.0) |
| 6–7 | Very high | 7/9 | 77.8 (45.3–93.7) | 92.4 (88.6–96.2) |
The optimal cutoff point based on ROC curve and for maximum efficiency is depicted in italics.
CI: confidence interval; NASH: non-alcoholic steatohepatitis; ROC: receiver operator characteristic.
For recognising high risk subjects, we tested the HIGHT score at a fixed sensitivity of 90% (rule out) to identify individuals at risk of NASH (n=36). Two patients with NASH were not detected, one of them with F2 fibrosis. Hence, the model detected 90.9% (20 out of 22) of patients with NASH and 88.9% (8 out of 9) of individuals with F2 fibrosis.
DiscussionIn this Spanish cohort of patients with MO undergoing BS, NAFLD was present in 94.2%, while other reports with BS patients described a prevalence between 68% and 95%.7,19–25 NAFLD occurs more frequently in patients with MO than in the general population (up to 95% vs 25%, respectively)1 with more than one third of them exhibiting NASH.7,11 Similar to that reported in previous studies, we found 42.3% of subjects exhibited features of NASH (20–60%).7,19–25 NASH diagnosis relevance lies in the fact that patients experience disease progression, with approximately 41% of them developing fibrosis1 and cirrhosis.5 The more advanced stages of liver diseases have been associated with significant morbidity and mortality.2 In our cohort, significant fibrosis (≥F2) was present in 17.3% of the patients, all of them in the NASH group.
Using common and readily available clinical data, five independent predictors of NASH were identified: HTN, ALT, GGT, HDL-c and QUICKI-IR. These parameters are easily obtained in the standard evaluation of patients with MO and might be combined into a score for determining the risk of having NASH for an individual patient. While we are aware that 52 patients are not enough to develop a strong model to predict NASH the results could have some usefulness in our clinical practice. In those patients categorised as high risk according to our score, an LB should be considered to confirm the diagnosis and stage the possible concomitant fibrosis, findings that will be of clinical and prognostic relevance. Obesity, particularly central obesity, increases the risk for advanced disease,26 and in this high-risk group it is essential to determine which combination of factors could be easily used as markers of disease. Furthermore, additional stratification could benefit from future medical therapy or enrolment in clinical trials. It is essential to promptly diagnose earlier stages of disease before irreversible progression appears. On the other hand, it could serve to identify subjects with a low risk of NASH in whom an LB can be delayed or avoided, because the patient be could safely followed clinically. Identifying non-invasive approaches for distinguishing SS from NASH in patients with NAFLD is critical, given the increasing incidence and prevalence of this disease in our society. Using the data of the present study, the HIGHT score would have identified the majority of subjects with NASH and significant fibrosis, and LB could have been avoided in 16 patients (30.8%).
T2D and IR have a central role in the pathogenesis and progression of NAFLD.5 We found that indirect measures of IR such as QUICKI-IR could serve as a parameter to predict NASH as a part of a risk model, consistent with the results of Dixon et al.21
Several authors19–23 included glucose metabolism parameters in models to predict NASH. Ulitsky et al.22 found that patients with T2D and NASH had significantly worse glycaemic control than patients with T2D but without NASH, as demonstrated by increased A1C levels. Gholam et al.23 consider that it may support the notion that more severe hyperglycaemia and IR may be involved in the progression of hepatic steatosis to NASH. In our cohort, a higher proportion of patients in the NASH group had T2D, and they exhibited worse glucose metabolism parameters, specially A1C.
HTN is another component of MS, it has a bi-directional relationship with NAFLD: NAFLD is an important risk factor for HTN, whereas HTN is an independent predictor of NAFLD.27 Similar to Dixon et al., we identified HTN as an independent predictor of NASH and integrated it into the combined model.
Transaminases are markers of hepatocellular injury, with ALT being the most specific.28 It has been suggested that their levels are not reliable in identifying NASH and that establishing a cutoff is questionable.29 Kleiner et al. reported in the LABS study that a significant minority of BS patients with “normal” ALT had evidence of serious liver disease,11 similar to what other authors reported.26,29 Nevertheless, there is a general agreement that patients with NAFLD and increased aminotransferase levels are at higher risk of having NASH.26 Traditionally, the upper limit of normal had been established at 40IU/l, but it appears that this must be lowered to 33IU/l for males and 25IU/l for females,28 or even lower to better identify individuals with liver injury. In our cohort, by means of ROC analysis, we established ALT ≥26IU/l and AST ≥19IU/l as abnormal levels. By doing so, in the NASH group, we determined that ALT and AST were altered in 72.7% and 86.4% of patients, respectively, which would have been very different if we had used the cutoff suggested by Kwo et al. (68.2% and 40.9%, respectively).
Of the liver enzymes, it is well established that GGT is more sensitive to alcohol intake than ALT. We found that higher levels of GGT are an independent predictor of NASH, concordant with what was reported by Pulzi et al.,30 who employed a level of GGT ≥30IU/l as an adequate marker of NASH. There is the presumption that aminotransferase abnormalities probably occur at an earlier stage, different from GGT that would require a greater hepatic damage to be altered.30
Dyslipidaemia is a frequent comorbidity in obesity. In our cohort, it was present in a quarter of patients, with HDL-c being the only particle that demonstrated a tendency to significant difference and was finally selected between the candidate variables as a marker of NASH.
Radiology is not accurate to diagnose NASH, and should be used carefully.8 The sensitivity of ultrasonography might be lower in mild fat infiltration. Also, the excessive fat in patients with MO may pose an additional challenge in the diagnosis. In our cohort, steatosis assessed by ultrasonography was reported in 90% of patients and was not significantly different in the NASH group. Taking into consideration that a significant proportion of patients with NASH progress to fibrosis,1 other imaging modalities such as transient elastography are important in the assessment of liver pathology, but once again, obesity, and particularly MO, may be an important limitation, even if XL-probe is used.4 In our series, we performed only a few elastographies. All patients in the NASH group were categorised as having at least significant fibrosis (F2) according to elastography.
The strengths of our study include its prospective design and the exhaustive clinical data. In addition, it suggests that simple non-invasive predictors could serve for identifying high-risk disease and might be used for selecting individuals to perform an LB, as a screening method for disease prevention and for prioritisation of surgical treatment. Knowing the histologic stage of liver disease could serve to implement measures in the management of those individuals with advanced liver disease. These measures include the modification of risk factors for disease progression and cardiovascular complications, and screening for hepatocellular carcinoma and portal hypertension.31
The study has limitations. Participants were selected from a group undergoing BS. This implies that patients were “younger” and had “lower risk” in terms of liver disease. It could be inferred that there must be older patients at high risk of having NAFLD who were not included because they were not considered as proper BS candidates. Consequently, our results may not generalisable to other population groups other than patients with MO, and must be interpreted cautiously in the outpatient setting, where an LB is obtained percutaneously. In our study, liver sampling was performed in the proximity of the liver capsule during laparoscopic surgery. This may offer potentially different results from those obtained by the percutaneous method used in the outpatient setting.12 The major limitations were methodological and are attributed to the small sample of the cohort. We were not able to validate our results, so they must be interpreted with caution.
The majority of patients were under treatment that could affect liver histology. Some patients with T2D were treated with glucagon-like peptide-1 receptor agonists and sodium-glucose co-transporter-2 inhibitors, which could improve liver histology in NASH.32 In addition, many patients were under treatment with angiotensin-converting enzyme inhibitors or angiotensin-II receptor blockers which may improve liver histology.32 We cannot determine if this could result in a bias, but it is the typical clinical profile of BS patients and affects both groups equally. This may be of interest for future investigations. Further validation of our model in an independent group is indispensable to replicate the results, as is an analysis of its performance in a non-BS cohort of patients with obesity.
ConclusionsNAFLD is practically a constant in MO with a considerable proportion of patients presenting NASH. We have shown that HTN and T2D, or surrogate markers of IR, could serve as predictors of NASH. In addition, liver biochemistries, especially transaminases are robust indicators of liver injury, but the cutoff value must be lowered for better identification of disease. In spite of the methodological issues of the study, our data suggest that the combination of five independent predictors in a scoring system may help the clinician to optimise the categorisation of patients in terms of NASH risk and to assess the suitability of performing an LB for a definitive diagnosis.
Ethical statementThis manuscript has not been published previously (partly or in full) or submitted to more than one journal for simultaneous consideration. Informed consent was obtained from each patient included in the study. The study was approved by the Hospital Ethics Committee and registered (HULP: PI-2824), it conforms to the ethical guidelines of the Declaration of Helsinki.
FundingNone declared.
Conflict of interestThe authors declare that they have no conflict of interest.
