


There are few data available in the literature on the prevalence of diabetes mellitus (DM) in patients with home enteral nutrition (HEN) via tube feeding. The objective was to analyze the prevalence of DM in patients receiving HEN, as well as evaluating the complications, the prescribed antidiabetic treatments and the nutrition regimen selected.
DesignThis was a retrospective, single-center, observational study reviewing clinical histories. The population consisted of patients over 18 years of age who started HEN by tube between January 2016 and January 2018. Sociodemographic variables were recorded, as well as variables related to HEN. Additional variables were recorded in patients with DM.
ResultsIn the 198 study patients, followed up for a median of 104 days, the prevalence of DM was 31.8%, and patients with DM were older (71.3±11.5 vs. 64.2±15.8; p=0.002) than those without DM. There were no differences between patients with and without DM as regards the prescription of HEN, its route and form of administration, and its complications. One hundred and thirty-two patients (66.7%) died during follow-up. The presence of DM did not increase the risk of death during follow-up (after adjusting for age, gender, and diagnosis). More than 85% of patients with DM received a specific formula for diabetes, and 84.1% of these patients received drug treatment.
ConclusionThe prevalence of DM was high in patients receiving HEN, most of whom were prescribed specific enteral nutrition formulas. The presence of DM was not associated with greater morbidity and mortality or with differences in HEN regimens or indications.
Existen pocos datos en la literatura sobre la prevalencia de la diabetes mellitus (DM) en los pacientes con nutrición enteral domiciliaria (NED) por sonda. El objetivo es analizar la prevalencia de los pacientes con DM en NED, las complicaciones, el tratamiento antidiabético y las pautas nutricionales escogidas.
DiseñoEstudio observacional retrospectivo unicéntrico con revisión de historias clínicas. Población: pacientes mayores de 18 años que iniciaron NED y ambulatoria mediante sonda desde enero de 2016 a enero de 2018. Se recogieron variables sociodemográficas y relacionadas con la NED. En personas con DM se recogieron otras variables adicionales.
ResultadosCiento noventa y ocho pacientes con una mediana de seguimiento de 104 días. La prevalencia de la DM fue del 31,8%, con mayor edad (71,3±11,5 vs. 64,2±15,8; p=0,002) que los no DM. No encontramos diferencias entre personas con DM y sin ella respecto a la indicación de la NED, vía y forma de administración ni complicaciones mecánicas o infecciosas. Fallecieron 132 pacientes (66,7%) durante el seguimiento. La presencia de diabetes no incrementó el riesgo de fallecer durante el seguimiento (ajustado por la edad, el género y el diagnóstico). Más del 85% de los pacientes con DM recibieron una fórmula específica para diabetes. El 84,1% de los pacientes con DM recibieron tratamiento farmacológico.
ConclusiónEn pacientes con NED por sonda, la prevalencia de DM fue elevada, y los pacientes recibieron mayoritariamente fórmulas nutricionales específicas. La presencia de diabetes no se asoció con una mayor morbimortalidad o diferencias en las pautas o indicaciones de la NED.
The term diabetes mellitus (DM) embraces a group of metabolic diseases characterized by chronic hyperglycemia and alterations in the metabolism of carbohydrates. According to the International Diabetes Federation (IDF),1 there are 59.8 million known cases of diabetes in Europe, while the number of undiagnosed cases is reckoned to be 23 million. According to the Di@bet.es study conducted in Spain,2 it is estimated that 13.8% of the adult Spanish population suffer from diabetes, and that up to 30% present some kind of alteration in the metabolism of carbohydrates. In hospitalized patients, the prevalence of diabetes is also very high (more than 30% in patients aged over 65 years).3 DM represents a serious health problem, on account of its prevalence, morbidity-mortality, and expense.1,4
Malnutrition is frequently found in association with diabetes.5 EN (enteral nutrition) is a nutritional support that enables nutrients to be supplied directly to the digestive tube. The indications for EN are similar in patients with DM and those without it, except in the case of severe diabetic gastroparesis, where a post-pyloric approach is preferred.6 The hyperglycemia in these patients (caused by DM or metabolic stress) increases morbidity-mortality7,8 and health costs, especially when hyperglycemia is combined with malnutrition.9 HEN treatment in patients with DM seeks to achieve or maintain an adequate nutritional state through suitable metabolic glycemic and lipid control, as well as reducing morbidity–mortality and the associated health costs.6,10
Specific formulas for diabetes or stress hyperglycemia with a high monounsaturated fat content have been proposed as a good alternative for HEN patients, as they permit a short or medium-term improvement the metabolic control,11–15 while also possibly reducing the associated expense.9
Despite the clinical importance and repercussions of this topic, very few studies have evaluated the prevalence of diabetes in patients receiving EN in routine clinical practice, especially in ambulatory and home settings.8,16–18 Similarly, few studies, apart from controlled studies and clinical trials, have examined programmed nutritional and antidiabetic treatment,6,18,19 or the complications encountered, or the degree of metabolic control achieved.9
The objectives of the study were: (1) to analyze the prevalence of DM in patients receiving HEN as part of the routine clinical practice of a tertiary hospital; (2) to compare the sociodemographic characteristics of patients with and without diabetes and the data related to EN (reasons for indication and suspension, the program and formulas prescribed, and complications); (3) to describe the antidiabetic treatment prescribed and the degree of metabolic control attained in DM patients.
Material and methodsDesignObservational study conducted via the review of digital clinical histories.
SettingAll the patients aged over 18 years who began home (without in-person visits to the hospital) or ambulatory (with in-person visits to the hospital) EN via tube feeding in the Clinical Nutrition and Diet between January 1, 2016 and January 1, 2018. Patients that started EN via tube feeding in the hospital admission and continued it after the discharge were also included. The follow-up continued until March 2019. The study was approved by the regional ethics and research committee.
VariablesSociodemographic variables (age, gender, marital status, need for a carer20) were recorded, as well as variables linked to EN (reasons for the indication and suspension, the prescribed enteral nutrition schedule and formulas, and complications, according to NADYA).21 Any deaths, and their dates, were verified in the population database for Andalucía (DIRAYA).
We considered patients with diabetes both the ones that had that diagnosis recorded in their clinical history or that had been treated with any antidiabetic drugs and with unknown diabetes according to international diagnostic criteria. In accordance with the protocol established in our center, both glycemia and HbA1c were evaluated in every patient beginning HEN.22
Various anthropometric variables were recorded at the start of HEN and at the end of the follow-up: weight (SECA 665® scale, Germany, with a sensitivity of 0.1kg), height (Holtain Ltd® stadiometer) and calculation of BMI, the prescribed antidiabetic treatment and analytical variables related to the degree of metabolic control: HbA1c,23 fasted venous glycemia, reactive protein C, total cholesterol, HDLc, LDLc, triglycerides, creatinine, and albumin (with the hospital lab's autoanalyzer).
Statistical analysisThe data were analyzed by means of the program SPSS 22.0 (SPSS Inc., Chicago, IL, 2006).24 The distribution of quantitative variables was examined by means of the Kolmogorof–Smirnof test, and these were expressed as the mean±standard deviation (or median and interquartile range). The comparison between qualitative variables was carried out by means of the Chi-square test, with a Fisher correction where necessary. The differences between quantitative variables were analyzed by means of the Student t test, and non-parametric tests (Mann–Whitney or Wilcoxon paired samples) were used when the analyzed variables did not follow a normal distribution.
A Cox regression was undertaken to calculate the hazard ratio for the mortality of the patients who began HEN in relation to the presence or absence of diabetes, adjusted for other variables (age, gender, and diagnosis – neoplasia vs. no neoplasia).
For all the calculations, statistical significance was set at p<0.05 for two-tails.
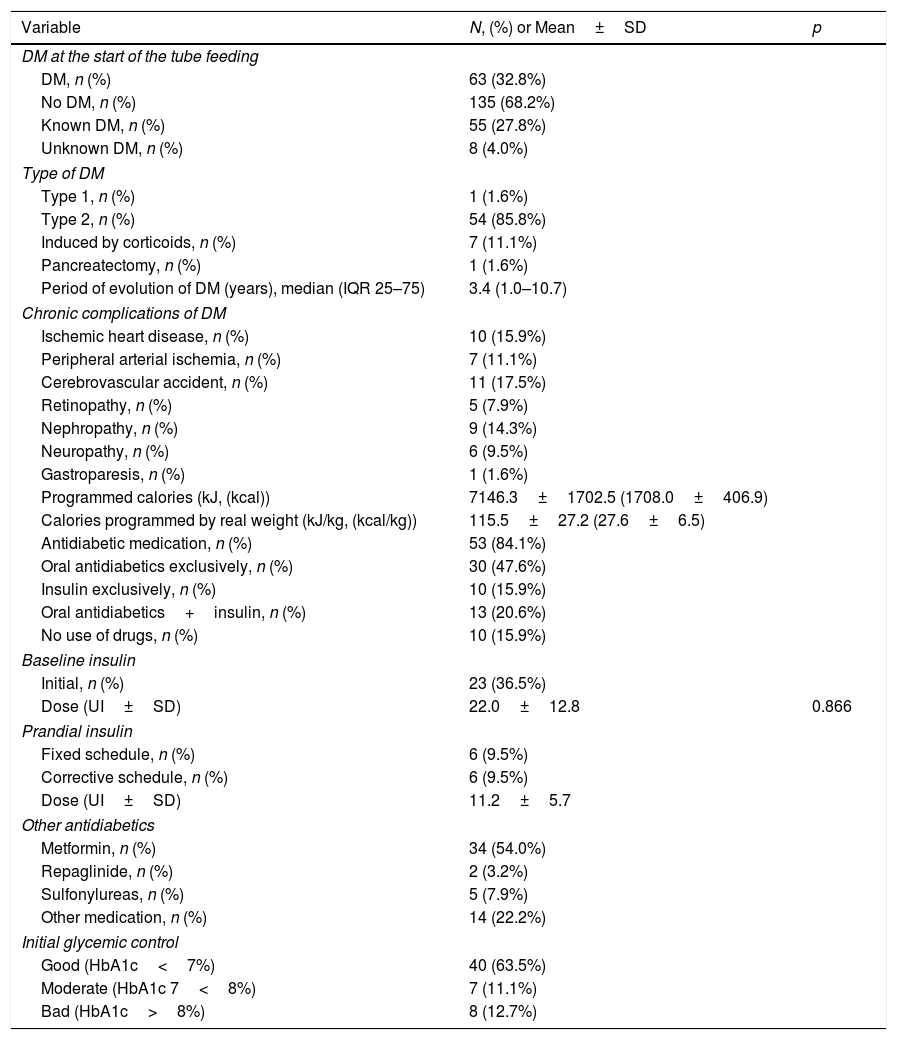
ResultsDuring the period under study, 198 patients started receiving HEN, and of these none were excluded from the analysis. The median of the follow-up was 104 days. The prevalence of DM was 31.8% (63 subjects) (Table 1). The DM had been known in 87.3% of the cases and had been unknown in 12.7%. Most of the DM was type 2 (85.7%) (Table 2).
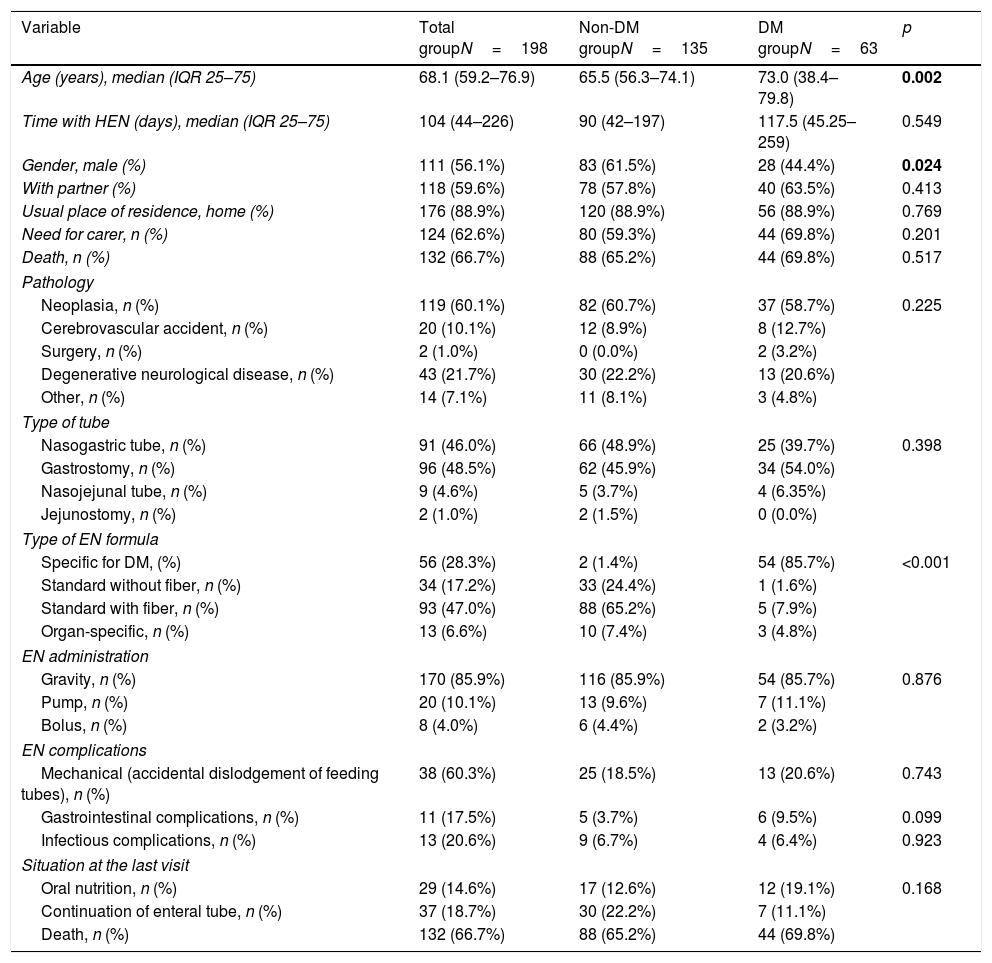
Baseline characteristics of the sample.
| Variable | Total groupN=198 | Non-DM groupN=135 | DM groupN=63 | p |
|---|---|---|---|---|
| Age (years), median (IQR 25–75) | 68.1 (59.2–76.9) | 65.5 (56.3–74.1) | 73.0 (38.4–79.8) | 0.002 |
| Time with HEN (days), median (IQR 25–75) | 104 (44–226) | 90 (42–197) | 117.5 (45.25–259) | 0.549 |
| Gender, male (%) | 111 (56.1%) | 83 (61.5%) | 28 (44.4%) | 0.024 |
| With partner (%) | 118 (59.6%) | 78 (57.8%) | 40 (63.5%) | 0.413 |
| Usual place of residence, home (%) | 176 (88.9%) | 120 (88.9%) | 56 (88.9%) | 0.769 |
| Need for carer, n (%) | 124 (62.6%) | 80 (59.3%) | 44 (69.8%) | 0.201 |
| Death, n (%) | 132 (66.7%) | 88 (65.2%) | 44 (69.8%) | 0.517 |
| Pathology | ||||
| Neoplasia, n (%) | 119 (60.1%) | 82 (60.7%) | 37 (58.7%) | 0.225 |
| Cerebrovascular accident, n (%) | 20 (10.1%) | 12 (8.9%) | 8 (12.7%) | |
| Surgery, n (%) | 2 (1.0%) | 0 (0.0%) | 2 (3.2%) | |
| Degenerative neurological disease, n (%) | 43 (21.7%) | 30 (22.2%) | 13 (20.6%) | |
| Other, n (%) | 14 (7.1%) | 11 (8.1%) | 3 (4.8%) | |
| Type of tube | ||||
| Nasogastric tube, n (%) | 91 (46.0%) | 66 (48.9%) | 25 (39.7%) | 0.398 |
| Gastrostomy, n (%) | 96 (48.5%) | 62 (45.9%) | 34 (54.0%) | |
| Nasojejunal tube, n (%) | 9 (4.6%) | 5 (3.7%) | 4 (6.35%) | |
| Jejunostomy, n (%) | 2 (1.0%) | 2 (1.5%) | 0 (0.0%) | |
| Type of EN formula | ||||
| Specific for DM, (%) | 56 (28.3%) | 2 (1.4%) | 54 (85.7%) | <0.001 |
| Standard without fiber, n (%) | 34 (17.2%) | 33 (24.4%) | 1 (1.6%) | |
| Standard with fiber, n (%) | 93 (47.0%) | 88 (65.2%) | 5 (7.9%) | |
| Organ-specific, n (%) | 13 (6.6%) | 10 (7.4%) | 3 (4.8%) | |
| EN administration | ||||
| Gravity, n (%) | 170 (85.9%) | 116 (85.9%) | 54 (85.7%) | 0.876 |
| Pump, n (%) | 20 (10.1%) | 13 (9.6%) | 7 (11.1%) | |
| Bolus, n (%) | 8 (4.0%) | 6 (4.4%) | 2 (3.2%) | |
| EN complications | ||||
| Mechanical (accidental dislodgement of feeding tubes), n (%) | 38 (60.3%) | 25 (18.5%) | 13 (20.6%) | 0.743 |
| Gastrointestinal complications, n (%) | 11 (17.5%) | 5 (3.7%) | 6 (9.5%) | 0.099 |
| Infectious complications, n (%) | 13 (20.6%) | 9 (6.7%) | 4 (6.4%) | 0.923 |
| Situation at the last visit | ||||
| Oral nutrition, n (%) | 29 (14.6%) | 17 (12.6%) | 12 (19.1%) | 0.168 |
| Continuation of enteral tube, n (%) | 37 (18.7%) | 30 (22.2%) | 7 (11.1%) | |
| Death, n (%) | 132 (66.7%) | 88 (65.2%) | 44 (69.8%) | |
Bold values correspond to a P-value below 0.05 (statistically significant value).
Data specific to the DM group.
| Variable | N, (%) or Mean±SD | p |
|---|---|---|
| DM at the start of the tube feeding | ||
| DM, n (%) | 63 (32.8%) | |
| No DM, n (%) | 135 (68.2%) | |
| Known DM, n (%) | 55 (27.8%) | |
| Unknown DM, n (%) | 8 (4.0%) | |
| Type of DM | ||
| Type 1, n (%) | 1 (1.6%) | |
| Type 2, n (%) | 54 (85.8%) | |
| Induced by corticoids, n (%) | 7 (11.1%) | |
| Pancreatectomy, n (%) | 1 (1.6%) | |
| Period of evolution of DM (years), median (IQR 25–75) | 3.4 (1.0–10.7) | |
| Chronic complications of DM | ||
| Ischemic heart disease, n (%) | 10 (15.9%) | |
| Peripheral arterial ischemia, n (%) | 7 (11.1%) | |
| Cerebrovascular accident, n (%) | 11 (17.5%) | |
| Retinopathy, n (%) | 5 (7.9%) | |
| Nephropathy, n (%) | 9 (14.3%) | |
| Neuropathy, n (%) | 6 (9.5%) | |
| Gastroparesis, n (%) | 1 (1.6%) | |
| Programmed calories (kJ, (kcal)) | 7146.3±1702.5 (1708.0±406.9) | |
| Calories programmed by real weight (kJ/kg, (kcal/kg)) | 115.5±27.2 (27.6±6.5) | |
| Antidiabetic medication, n (%) | 53 (84.1%) | |
| Oral antidiabetics exclusively, n (%) | 30 (47.6%) | |
| Insulin exclusively, n (%) | 10 (15.9%) | |
| Oral antidiabetics+insulin, n (%) | 13 (20.6%) | |
| No use of drugs, n (%) | 10 (15.9%) | |
| Baseline insulin | ||
| Initial, n (%) | 23 (36.5%) | |
| Dose (UI±SD) | 22.0±12.8 | 0.866 |
| Prandial insulin | ||
| Fixed schedule, n (%) | 6 (9.5%) | |
| Corrective schedule, n (%) | 6 (9.5%) | |
| Dose (UI±SD) | 11.2±5.7 | |
| Other antidiabetics | ||
| Metformin, n (%) | 34 (54.0%) | |
| Repaglinide, n (%) | 2 (3.2%) | |
| Sulfonylureas, n (%) | 5 (7.9%) | |
| Other medication, n (%) | 14 (22.2%) | |
| Initial glycemic control | ||
| Good (HbA1c<7%) | 40 (63.5%) | |
| Moderate (HbA1c 7<8%) | 7 (11.1%) | |
| Bad (HbA1c>8%) | 8 (12.7%) | |
The sociodemographic variables are presented in Table 1, along with the presence or otherwise of DM and variables related to the pathology and indication of EN and to the type of EN and its administration. Significant differences were only found between the patients with and without diabetes with respect to gender and age (there were a higher proportion of males and a higher age in the DM group) (Table 1).
Indication of HEN, EN formulas used, administration schedules, and complicationsThere were no differences between patients with and without DM with respect to the indication, route, form of administration, or complications (Table 1).
The most common baseline diagnosis in both groups was neoplasia (60.1% of the total; 58.7% in DM and 60.7% in non-DM) and the most common indication for HEN was mechanical alterations in swallowing (63.6% of the total; 61.9% in DM and 64.4% in non-DM). The most widely used tubes were nasogastric tubes (46.0% of the total; 39.7% in DM and 48.9% in non-DM) and gastrostomy (48.5% of the total; 54.0% in DM and 45.9% in non-DM).
Effect of diabetes on mortalityOut of the total sample, 132 patients (66.7%) died; 44 had DM (69.8% of the DM group) and 88 did not have DM (65.2% of the non-DM group).
The presence of diabetes did not increase the risk of death during the follow-up (after adjustment for age, gender, and diagnosis) (HR 0.90; 0.60–1.33; p=0.581) (Fig. 1). In contrast, the presence of neoplasia was associated with a higher risk of death (HR 1.57; 1.05–2.35; p=0.043).

More than 85% of the DM patients received a specific formula for diabetes, whereas those who did not have DM mainly received standard formulas (p<0.0001) (Table 1).
The accumulated incidence of complications, whether mechanical (dislodgement of feeding tubes) or infectious, was similar in both groups (Table 1).
Drugs used and degree of metabolic control and follow-up in DM patientsAt the start of the HEN, 84.1% of the patients with diabetes received pharmacological treatment for hyperglycemia (Table 2). The drugs most used were Metformin (54.0%) and basal insulin (36.5%) (Table 2). The mean of scheduled calories was 7146.3±1702.5kJ (1708.0±406.9kcal) (115.5±27.2kJ/kg (27.6±6.5kcal/kg of weight/day)).
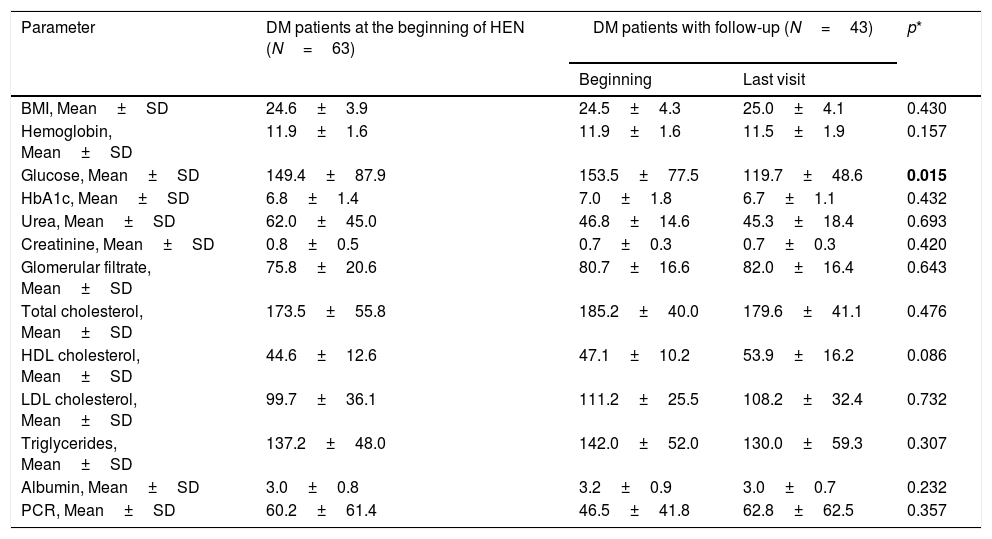
Data on metabolic control were recorded in 43 patients with DM, with a median of follow-ups of 117.5 days until the final visit. The BMI (body mass index) remained stable over the course of the follow-up (Table 2). Significant differences were observed between the initial venous glycemia and the final recorded visit, but this was not the case in HbA1c or the other metabolic parameters (Table 3).
Metabolic control (DM patients).
| Parameter | DM patients at the beginning of HEN (N=63) | DM patients with follow-up (N=43) | p* | |
|---|---|---|---|---|
| Beginning | Last visit | |||
| BMI, Mean±SD | 24.6±3.9 | 24.5±4.3 | 25.0±4.1 | 0.430 |
| Hemoglobin, Mean±SD | 11.9±1.6 | 11.9±1.6 | 11.5±1.9 | 0.157 |
| Glucose, Mean±SD | 149.4±87.9 | 153.5±77.5 | 119.7±48.6 | 0.015 |
| HbA1c, Mean±SD | 6.8±1.4 | 7.0±1.8 | 6.7±1.1 | 0.432 |
| Urea, Mean±SD | 62.0±45.0 | 46.8±14.6 | 45.3±18.4 | 0.693 |
| Creatinine, Mean±SD | 0.8±0.5 | 0.7±0.3 | 0.7±0.3 | 0.420 |
| Glomerular filtrate, Mean±SD | 75.8±20.6 | 80.7±16.6 | 82.0±16.4 | 0.643 |
| Total cholesterol, Mean±SD | 173.5±55.8 | 185.2±40.0 | 179.6±41.1 | 0.476 |
| HDL cholesterol, Mean±SD | 44.6±12.6 | 47.1±10.2 | 53.9±16.2 | 0.086 |
| LDL cholesterol, Mean±SD | 99.7±36.1 | 111.2±25.5 | 108.2±32.4 | 0.732 |
| Triglycerides, Mean±SD | 137.2±48.0 | 142.0±52.0 | 130.0±59.3 | 0.307 |
| Albumin, Mean±SD | 3.0±0.8 | 3.2±0.9 | 3.0±0.7 | 0.232 |
| PCR, Mean±SD | 60.2±61.4 | 46.5±41.8 | 62.8±62.5 | 0.357 |
Bold values correspond to a P-value below 0.05 (statistically significant value).
There are very few studies in the literature that have evaluated the prevalence of diabetes in patients receiving HEN via tube feeding, the characteristics of the nutritional support used, and the pharmacological treatment prescribed in these patients.
In our study the prevalence of diabetes was very high: over one in three (31.8%) of the patients who started HEN via tube feeding.
This prevalence is lower than that found by Arinzon et al. in elderly patients admitted to long-term care service, where 47% of the patients receiving EN had DM.17 The age of the patients (higher in the study of Arinzon et al.: 77.1 vs. 66.5 years in our series), the method used for the diagnosis of diabetes, the higher prevalence of severe neurodegenerative pathology, and various comorbid factors could explain these differences.
In contrast, Pih et al. found, in a sample of 401 patients receiving enteral nutrition by percutaneous endoscopic gastrostomy (PEG), a prevalence of DM of 22.4%. In this case, the mean age (68 years) was similar to that of our sample and the most frequent diagnosis was neurological disease. In Spain, Villar-Taibo et al. reported a similar prevalence (19.7% of patients had DM), but in this case, 69.2% of the sample used oral supplements.25 Finally, the prevalence that we observed was notably higher than that published by Vallumsetla et al. in patients with a median age of 66 years; they found a mere 3.7% of subjects with diabetes,18 although their recording method (via data collected from the history) possibly underestimated the true prevalence.
Furthermore, the data collected from our sample are similar to those of the population study Di@bet.es2 conducted in Spain, where 29.8% of the women and 42% of the men aged from 61 to 75 years suffered from diabetes.
The indications for HEN were similar in the patients with and without diabetes, and the main diagnoses were neoplasia (60%), followed by neurological disease (20%). These indications were different from those recorded in adult patients from the HEN register in Spain by the NADYA group,26 where the main diagnosis was neurological disease (59.0%). These discrepancies could be explained by the fact that our study took place in a tertiary hospital that treats patients with cancers of great complexity.
Moreover, we did not find any differences between patients with and without DM with respect to the type of tube used (gastrostomy in 54.0 and 45.9% of the patients, respectively) or in the form of administration (this was mainly intermittent, via gravity assist). These findings are similar to those published by the NADYA register,26 although they show a greater use of a gastrostomy tube than other more regional studies.25,27 Other series18 have presented a higher number of jejunostomies, probably on account of a higher prevalence of surgical pathology.
The patients with DM also had a similar rate of gastrointestinal, infectious, and mechanical complications (1 in every 5 experienced accidental slippages of the tube in both groups). Other series25 have presented a higher prevalence of gastrointestinal complications, primarily on account of mild digestive symptoms.
Poorly controlled hyperglycemia increases the risk of infection in diabetes patients, and diabetes can be an independent risk factor for long-term complications of HEN, such as infection of the wound or leaks through the tube in patients receiving PEG (percutaneous endoscopic gastrostomy).8 In our sample, however, the presence of diabetes did not lead to a higher rate of infectious complications. The effective control of glycemia in our patients could have had an effect on these results.
The mortality during the follow-up was very high in our series (over 65% in both groups), possibly because the patients who started HEN presented serious diseases that influenced their short- and medium-term prognosis. Our mortality rates are slightly higher than those of the NADYA register for 2016–2017, where 51.1% died and only 17.0% reverted to the oral route, although this difference could probably be explained by the greater length of our follow-up period.
Notable differences were evident, however, in the use of specific formulas. Most of the formulas used in the patients with diabetes were specific (85.7%), whereas they were mainly standard in the group without diabetes (88.6%). These findings contrast sharply with those of Vallumsetla et al, where no specific formulas were used,18 although they do concur with findings from Andalucía, where, back in 2007, 24% of all the specific formulas used were for diabetes or stress hyperglycemia.19
Although the use of specific enteral formulas for DM is not recommended in some guidelines, as there is considered to be a lack of sufficient evidence in their favor,28 other guidelines endorse them as a good alternative for patients receiving HEN,6,15,29 as they allow a short- to long-term improvement in the metabolic control (baseline, mean, and/or postprandial glycemia11 and, in some cases, HbA1c11 and insulin requirements13,14) in comparison with standard formulas (usually containing fiber). The benefits derived from specific formulas could also help reduce the associated health costs.9
Most of the patients with diabetes in our series received some type of antidiabetic treatment (84.1%), most often exclusively in oral form (47.6%), while 36.5% used insulin, either alone or in combination with oral treatment. Our results are somewhat different compared to those published by Vallumsetla et al., who reported 39.7% of their patients using oral antidiabetics exclusively and 34.5% using insulin. These discrepancies can be explained by the fact that their patients had higher HbA1c readings than those in our series.18
Metformin was the most widely used oral antidiabetic (54.0%). There are no specific guides recommending which antidiabetics, apart from insulin, should be used in patients receiving HEN, although the iSGLT2 and aGLP1 do not seem indicated, due to their shared effect on weight, as well as the risk of urinary infections in the former case and gastrointestinal complications in the latter. Moreover, the iDPP4 are not recommended, as insufficient data are available on their absorption after being crushed for tube feeding.
The evolution of the anthropometric and analytical parameters during the follow-up of the DM patients showed no significant differences as regards the BMI or HbA1c, although there was a significant reduction in venous glycemia (153.5±77.5mg/dL at the start vs. 119.7±48.6mg/dL at the end; p=0.015) (Table 3). In contrast, Vallumsetla et al. observed a significant reduction of HbA1c in their series, probably because they started with higher initial readings.18
Our study evaluates the prevalence of DM in a large sample of patients receiving HEN who were followed up in standard clinical practice. The study also analyzes the type of nutritional treatment prescribed, the complications, and the metabolic control, and as such it provides data on a topic that has scarcely been investigated in the literature. Our study is not exempt from limitations, however: on the one hand, it is a single-center study, and it is therefore possible that its results cannot be extrapolated to other centers with different characteristics; on the other hand, as the study was retrospective and based on digital clinical histories, some data from the metabolic follow-up could not be recorded for all the patients in our sample.
In conclusion, there was a high prevalence of DM in the patients receiving HEN via tube feeding in our sample, and most of these DM patients were treated with specific nutritional formulas. However, the presence of diabetes was not associated with greater morbidity-mortality or any differences in the schedules or indications for HEN.
Author contributionsG. Olveira, J. Abuín and V. Doulatram equally contributed to the conception and design of the research; F. Sánchez-Torralvo and V. Contreras contributed to the design of the research; S. Padín and M. Gonzalo contributed to the acquisition and analysis of the data; J. Abuín and V. Doulatram contributed to the interpretation of the data; and J. Abuín and G. Olveira drafted the manuscript. All authors critically revised the manuscript, agree to be fully accountable for ensuring the integrity and accuracy of the work, and read and approved the final manuscript.
Financial disclosureNone declared.
Conflicts of interestG. Olveira has had occasional interventions of consultancy or speaker fees from Abbott, Nutricia, Vegenat, Fresenius, Nestle, Persan Farma and Adventia.
