


To determine the impact of the type of hospital kitchen on the dietary intake of patients.
MethodsA cross-sectional, two-centre study, of cooking in a traditional kitchen (TK) and in a chilled kitchen (CK). Subjective global assessment (SGA) was used for nutritional diagnosis. Before study start, a dietician performed a nutritional assessment of the menus of each hospital. All dishes were weighed upon arrival to the ward and at the end of the meal.
Results201 and 41 patients from the centres with TK and CK respectively were evaluated. Prevalence of malnutrition risk was 50.2% at the hospital with TK and 48.8% at the hospital with CK (p=0.328). Forty-eight and 56 dishes were nutritionally evaluated at the hospitals with TK and CK respectively. Intake analysis consisted of 1993 and 846 evaluations in the hospitals with TK and CK respectively. Median food consumption was 76.83% at the hospital with TK (IQR 45.76%) and 83.43% (IQR 40.49%) at the hospital with CK (p<0.001). Based on the prevalence of malnutrition, a higher protein and energy intake was seen in malnourished patients from the CK as compared to the TK hospital, but differences were not significant after adjustment for other factors.
ConclusionsCooking in a chilled kitchen, as compared to a traditional kitchen, may increase energy and protein intake in hospitalized patients, which is particularly beneficial for malnourished patients.
Determinar el impacto de la organización de la cocina hospitalaria en la ingesta dietética del paciente hospitalizado.
MetodologíaEstudio transversal, realizado en dos centros hospitalarios, uno con cocina tradicional (CT) y otro con cocina en línea fría (CLF). La valoración subjetiva global fue empleada para el diagnóstico nutricional. Una dietista-nutricionista realizó una calibración nutricional de los platos y los menús de cada hospital antes de empezar el estudio. La técnica de valoración de la ingesta fue la pesada de alimentos antes y después de la ingesta, siempre en presencia del paciente.
ResultadosFueron reclutados 201 pacientes del centro con CT y 41 del CLF. La prevalencia de riesgo de desnutrición fue del 50,2% en el CT y de 48,8% en el CLF (p=0,328). En el CT fueron valorados nutricionalmente 48 platos y 56 del CLF. Respecto al análisis de la ingesta, se realizaron 1.993 registros en el centro CT y 846 en el centro CLF. La mediana de ingesta en el CT fue de 76,83% (RIC 45,76%) y 83,43% (RIC 40,49%) en el CLF (p<0,001). Teniendo en cuenta la prevalencia de malnutrición, se observó una mayor ingesta proteica y energética en pacientes malnutridos en el CLF en comparación con el CT, aunque estas diferencias no fueron significativas tras ajustarlas a diferentes factores de confusión.
ConclusionesCocinar en una cocina en línea fría podría mejorar la ingesta calórica y proteica del paciente hospitalizado, especialmente en pacientes malnutridos.
The importance of food for patients in hospitals has recently been recognized, and its preparation has emerged as a tool to improve healing. Nutritional support minimizes comorbidities and helps to decrease the length of hospital stays.1
Several studies have shown there is high prevalence of malnutrition (30–50%) in hospitals.2–4 This fact, together with patients’ altered sensory perceptions, has an impact on their intake. To work towards increasing the dietary intake of patients at risk for malnutrition, a study conducted by Sorensen et al. in 2012 reviewed the sensory quality of hospital food, assessing the appearance, the aroma, the texture and the flavour. They found hospital patients have the need to choose foods that are better tolerated, and there was a large group of patients who informed that the menus were monotonous; a greater variability in the menu could imply an increased intake.5 Also, the temperature at which the food is eaten by inpatients should play an important role in its consumption.6
To provide nutritionally complete hospital menus dieticians need to know the general nutritional requirements of inpatients to calibrate diets, which should include an appropriate distribution of macronutrients. When this is not possible, the recommendations of the Spanish Society of Community Nutrition (SENC) could be followed. General recommendations suggest that standard menus should provide between 2200 and 2400kcal with 50–55% carbohydrate, 30–35% lipid and 15–20% protein. Therapeutic menus that will be part of the hospital diet handbook should be calibrated with this standard guideline and recommendations based on scientific evidence.7
The hospital kitchen is the place where food products are stored, prepared, and cooked. How food is prepared is an important part of patients’ acceptance of hospital meals. When managing a hospital kitchen (whether run by hospital employees or staff from a privately run company with a full-service concession of kitchen service, production and distribution), the characteristics of the centre and the kitchen should be taken into account. Finally, it should be known that work schedule of staff will affect the timetable of the patient intake.8
With regard to the distribution method, the traditional kitchen (TK) system is based on the production and subsequent retention of products cooked at high temperatures until they are distributed and consumed. This main advantage of this process is the possibility to greatly vary cooking techniques and to reduce costs of the infrastructure; the disadvantages are low levels of food security if proper temperatures are not maintained, the high cost of personnel (running mornings and afternoons shifts of food production from Monday to Sunday) and trouble occurring during peak hours of distribution.
Furthermore, cooking in a chilled kitchen (CK) utilizes a set of kitchen production systems for communities that have the ability to defer time and space, extending the moments between production and consumption. It has significant advantages; high levels of food security, great variety of traditional dishes, preservation of sensory and nutritional qualities of food, proper menu-planning to manage the time gap between preparation of food and its consumption, removal of peak hours of distribution and its contingencies, and reduction of costs. The main disadvantages are the high investment required (for blast chillers and food cart regenerators) and high maintenance costs (for the food carts regenerators).
The aim of the study was to determine the impact that the type of hospital kitchen has on the dietary intake of the patient.
MethodsA cross-sectional, two-centre study was made under routine clinical practice conditions between July 2010 and December 2011. The hospitals included in the study were Complejo Asistencial Universitario of León (CAULE) and Hospital General Universitario Gregorio Marañón of Madrid (HGUGM), which are both included in the Spanish National Health System.
A sample size of 181 patients was estimated, taking into account the prevalence of malnutrition detected in a pilot study, which reached 64.2%, assuming an accuracy of 7% and a significance level of 5%.9 A consecutive non-probabilistic sampling was carried out. The recruitment was made during the first 48h after hospital admission (including both medical and surgical wards), one hospital centre (CAULE) provided food from a TK and the other (HGUGM) from a CK. All procedures performed in the study were in accordance with the ethical standards of the Hospital of León Ethical Committee (EC). Informed written consent form was obtained by all participants.
The dietitian spent two weeks per hospital ward to recruit ten patients per each who accepted to participate in the study signing the informed consent and meet the inclusion criteria (patients aged over 18 years excluded pregnant women, patients unable to collaborate in the study (because of mental disorder or difficulties understanding written language), subjects with an expected length of stay <48h, patients with eating disorders (anorexia or bulimia), inpatients admitted for a weight-loss procedure, and subjects admitted to one of the following services: intensive care unit, obstetrics, short-stay unit, paediatrics, emergency department, palliative care, burn unit, and psychiatry).
Nutritional assessment of patientsNutritional assessments were performed by a registered dietitian (RD). All recruited patients were weighed while standing, barefoot, and in light clothes (hospital bed clothes) using a digital scale (OMRON TBF 500®) with a precision of 0.1kg. The current weight as reported by the patient at the moment of recruitment for the study was used when it was not possible to weigh. Height and weight (when weighing was not possible) were estimated using the validated method of the British Association for Parenteral and Enteral Nutrition (BAPEN).10,11 The body mass index (BMI) was calculated and the Subjective Global Assessment (SGA) was used for nutritional diagnosis. The Harris Benedict formula was used to calculate energy requirements, and a stress factor was added by taking into account the characteristics of the patient: 1.1 – mild stress, 1.3 – moderate stress and 1.5 – severe stress. Protein needs were estimated based on weight and nutritional characteristics of the patient: chronic renal insufficiency 0.8g/kg/day, mild metabolic stress 1g/kg/day, moderate stress 1.2g/kg/day and severe 1.5g/kg/day.8
Oral intake assessmentBefore performing the dietary assessment, the RD carried out a nutritional evaluation of all meals and foods that composed the hospital menu, using a computer-based data evaluation system with Dietsource 3.0® software (Novartis Consumer Health-Cath Soft, 1997–2003). Before intake, all dishes were weighed once they arrived at the ward and also at the end of the meal. The RD did this in front of the patient with a digital scale that had a precision of 1g. Each time, patients were asked about every single dish they ate about the causes that led to food refusal (e.g., low appetite, inadequate sensory characteristics of the food, inadequate temperature, restriction of intake due to therapeutic reasons, and others). The temperature of the food was taken with a food thermometer (PCE-IR100, temperature range −40°C to 280°C and precision of 0.1°C). The assessments were conducted from Monday to Sunday for lunch and dinner.
Statistical analysisFor the statistical analysis quantitative variables were checked whether they followed a normal distribution with the Kolmogorov–Smirnov test. Those with normal distribution were summarized using the mean and standard deviation (SD) and were compared with the Student t-test (for independent or dependent samples, as appropriate). An ANOVA test with the Bonferroni correction was used when more than two groups were compared.
The quantitative variables without normal distribution were summarized with the median and interquartile range (IQR) and compared with the Mann–Whitney U test or the Kruskal–Wallis test when more than two groups were compared. To compare the medians, Wilcoxon test was used.
The qualitative variables were summarized as percentage and were compared using chi-square test. Multivariate analyses using a general linear model (GLM) were conducted to compare differences in energy and protein intake at each centre taking to account the presence of malnutrition and adjusting for age, weight, illness (cancer), type of ward and principal diagnosis. The independent variable was the intake (energetic and protein in each case) and the explanatory variables were the type of kitchen and presence of malnutrition in the first analysis, and then, age, weight, presence or absence of cancer, type of ward and principal diagnosis, were introduced in the model. SPSS 15.0 was used to do the statics analysis.
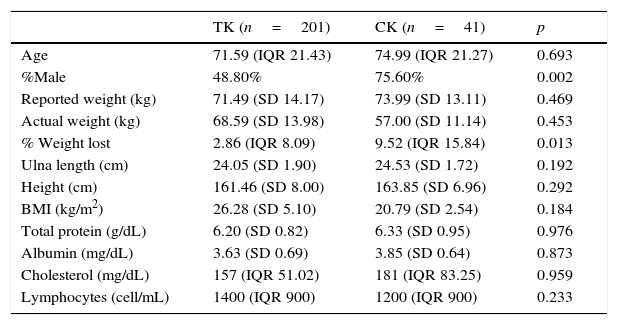
ResultsA total of 201 patients from CAULE and 41 from HGUGM were evaluated (Table 1). The distribution of admissions by departments at CAULE were 17% for general surgery, 15% for internal medicine, 35% for other surgical services (plastic surgery, ear, nose and throat (ENT), orthopaedics, urology, vascular, etc.), and 33% for other medical wards (gastroenterology, haematology, respiratory, neurology, oncology, etc.). At HGUGM the distribution was as follows: 9% for internal medicine, 41% for other surgical services and 50% for other medical wards. There was a statistically significant difference between the two centres by service income (p<0.001).
Comparative of studied population by centre.
| TK (n=201) | CK (n=41) | p | |
|---|---|---|---|
| Age | 71.59 (IQR 21.43) | 74.99 (IQR 21.27) | 0.693 |
| %Male | 48.80% | 75.60% | 0.002 |
| Reported weight (kg) | 71.49 (SD 14.17) | 73.99 (SD 13.11) | 0.469 |
| Actual weight (kg) | 68.59 (SD 13.98) | 57.00 (SD 11.14) | 0.453 |
| % Weight lost | 2.86 (IQR 8.09) | 9.52 (IQR 15.84) | 0.013 |
| Ulna length (cm) | 24.05 (SD 1.90) | 24.53 (SD 1.72) | 0.192 |
| Height (cm) | 161.46 (SD 8.00) | 163.85 (SD 6.96) | 0.292 |
| BMI (kg/m2) | 26.28 (SD 5.10) | 20.79 (SD 2.54) | 0.184 |
| Total protein (g/dL) | 6.20 (SD 0.82) | 6.33 (SD 0.95) | 0.976 |
| Albumin (mg/dL) | 3.63 (SD 0.69) | 3.85 (SD 0.64) | 0.873 |
| Cholesterol (mg/dL) | 157 (IQR 51.02) | 181 (IQR 83.25) | 0.959 |
| Lymphocytes (cell/mL) | 1400 (IQR 900) | 1200 (IQR 900) | 0.233 |
TK: traditional kitchen centre; CK: chilled kitchen centre; SD: standard deviation; IQR: interquartile range; BMI: body mass index.
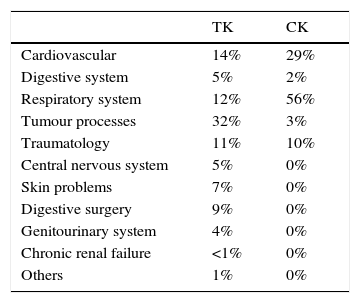
Regarding the reasons for admission, at CAULE, 29% of admissions were mainly for surgery, 19% were related to a tumour, 12% for illness related to the respiratory system, 11% for the circulatory system, and 29% for other reasons (digestive pathologies, central nervous system, infectious diseases, traumatology, etc.). The reasons for admission to HGUGM were 10% for surgery, 34% for illness related to the respiratory system 22% for the circulatory system, and 34% due to other reasons. There were statistically significant differences between hospitals (p<0.001). The differences in the main diagnoses, according to the centres, were also statistically significant (p<0.001) (Table 2).
Main diagnosis by centre.
| TK | CK | |
|---|---|---|
| Cardiovascular | 14% | 29% |
| Digestive system | 5% | 2% |
| Respiratory system | 12% | 56% |
| Tumour processes | 32% | 3% |
| Traumatology | 11% | 10% |
| Central nervous system | 5% | 0% |
| Skin problems | 7% | 0% |
| Digestive surgery | 9% | 0% |
| Genitourinary system | 4% | 0% |
| Chronic renal failure | <1% | 0% |
| Others | 1% | 0% |
p<0.001.
TK: traditional kitchen centre; CK: chilled kitchen centre.
General characteristics and anthropometric, functional and biochemical data are shown in Table 1. The prevalence of malnutrition risk among patients at CAULE was 50.2%, while the prevalence of malnutrition was 11.9%. In contrast, 48.8% of patients were at risk of malnutrition at HGUGM and 4.9% were malnourished (MN) (p=0.328).
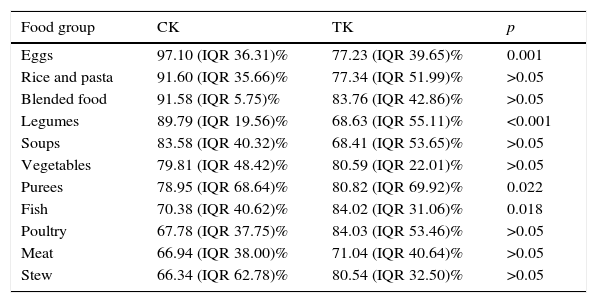
Oral intake assessmentIn the Traditional Kitchen (TK), 48 dishes were nutritionally evaluated vs. 56 dishes in the Chilled Kitchen (CK). Regarding consumption 1993 appraisals were conducted in the TK of which 54.7% reflected diets without salt, while in CK 846 evaluations were performed of which 50.0% reflected a salt-free diet; these results were statistically significant (p=0.021). Median food consumption for the TK was 76.83% (IQR 45.76%), and for the CK it was 83.43% (IQR 40.49%) (p<0.001). The presence of salt in meals made eating more favourable, compared to the ones that did not have salt [80.26% (IQR 43.66%) vs. 74.53% (IQR 46.83%) (p=0.001)]. After analysing the consumption by food group and centre, statistically significant differences were observed regarding higher intake of eggs, legumes and blended food from the CK and a lower intake of fish, compared to the TK (Table 3).
Percentage of consumption by group of weighted food.
| Food group | CK | TK | p |
|---|---|---|---|
| Eggs | 97.10 (IQR 36.31)% | 77.23 (IQR 39.65)% | 0.001 |
| Rice and pasta | 91.60 (IQR 35.66)% | 77.34 (IQR 51.99)% | >0.05 |
| Blended food | 91.58 (IQR 5.75)% | 83.76 (IQR 42.86)% | >0.05 |
| Legumes | 89.79 (IQR 19.56)% | 68.63 (IQR 55.11)% | <0.001 |
| Soups | 83.58 (IQR 40.32)% | 68.41 (IQR 53.65)% | >0.05 |
| Vegetables | 79.81 (IQR 48.42)% | 80.59 (IQR 22.01)% | >0.05 |
| Purees | 78.95 (IQR 68.64)% | 80.82 (IQR 69.92)% | 0.022 |
| Fish | 70.38 (IQR 40.62)% | 84.02 (IQR 31.06)% | 0.018 |
| Poultry | 67.78 (IQR 37.75)% | 84.03 (IQR 53.46)% | >0.05 |
| Meat | 66.94 (IQR 38.00)% | 71.04 (IQR 40.64)% | >0.05 |
| Stew | 66.34 (IQR 62.78)% | 80.54 (IQR 32.50)% | >0.05 |
TK: traditional kitchen centre; CK: chilled kitchen centre.
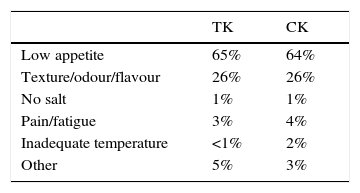
The main reasons for rejecting the hospital diet were low appetite and poor sensory characteristics of food (Table 4).
Food temperatureThe median temperature of plates at the time a patient received it was 44.3 (IQR 0.38)°C in the centre with the TK and 56.1 (IQR 9.30)°C in the centre with the CK (p<0.001). In both kitchens, lower temperature appeared to have an impact on consumption that was also lower (p<0.001).
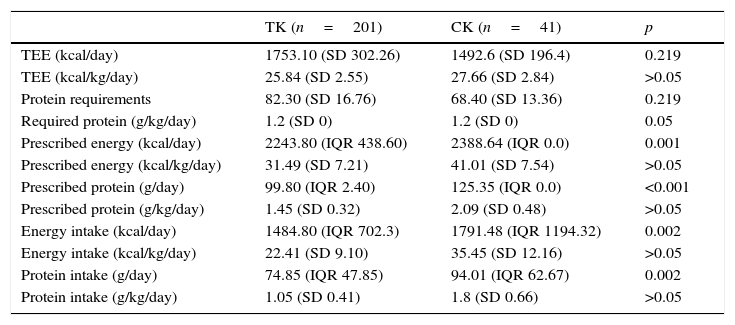
Comparison between type of kitchen and nutritional assessmentThe summarize of the nutritional requirements and nutritional intake by type of kitchen is shown in Table 5. At CAULE, patients were prescribed an additional 323.37 (SD 323.37)kcal and 13.91 (SD 18.02)g per day of energy and protein more than they needed, which represents an excess of 21.32% (SD 22.61%) of energy and 20.98% (SD 26.71%) of protein. Regarding the intake, the patients consumed 104.91 (SD 550.61)kcal per day of energy and 10.95 (SD 26.96)g per day less than they needed, which meant they experienced a deficit of 5.73% (SD 35.48%) of energy and 11.60% (SD 34.12%) of protein. At HGUGM, patients were prescribed 779.18 (SD 227.60)kcal per day and 48.99 (SD 20.81)g per day of energy and proteins more than needed, which represented an excess of 52.67% (SD 16.82%) of energy and 74.35% (SD 39.92%) of protein. Regarding their intake, the patients consumed 437.95 (SD 720.59)kcal per day of energy and 33.22 (SD 33.57)g per day less than needed, which meant they had a deficit of 31.44% (SD 45.30%) of energy and 50.01% (SD 55.28%) of protein. These results were not statistically significant between the centres.
Nutritional requirements and nutritional intake by type of kitchen.
| TK (n=201) | CK (n=41) | p | |
|---|---|---|---|
| TEE (kcal/day) | 1753.10 (SD 302.26) | 1492.6 (SD 196.4) | 0.219 |
| TEE (kcal/kg/day) | 25.84 (SD 2.55) | 27.66 (SD 2.84) | >0.05 |
| Protein requirements | 82.30 (SD 16.76) | 68.40 (SD 13.36) | 0.219 |
| Required protein (g/kg/day) | 1.2 (SD 0) | 1.2 (SD 0) | 0.05 |
| Prescribed energy (kcal/day) | 2243.80 (IQR 438.60) | 2388.64 (IQR 0.0) | 0.001 |
| Prescribed energy (kcal/kg/day) | 31.49 (SD 7.21) | 41.01 (SD 7.54) | >0.05 |
| Prescribed protein (g/day) | 99.80 (IQR 2.40) | 125.35 (IQR 0.0) | <0.001 |
| Prescribed protein (g/kg/day) | 1.45 (SD 0.32) | 2.09 (SD 0.48) | >0.05 |
| Energy intake (kcal/day) | 1484.80 (IQR 702.3) | 1791.48 (IQR 1194.32) | 0.002 |
| Energy intake (kcal/kg/day) | 22.41 (SD 9.10) | 35.45 (SD 12.16) | >0.05 |
| Protein intake (g/day) | 74.85 (IQR 47.85) | 94.01 (IQR 62.67) | 0.002 |
| Protein intake (g/kg/day) | 1.05 (SD 0.41) | 1.8 (SD 0.66) | >0.05 |
TEE: total energy expenditure; TK: traditional kitchen centre; CK: chilled kitchen centre; SD: standard deviation; IQR: interquartile range.
In the linear regression, where the intake of energy and protein was compared by type of distribution system and according to the prevalence of malnutrition (when patients at nutritional risk and those already malnourished were grouped together), a higher intake of protein was observed for the CK in relation to the TK [90.5 (SD 4.4)g vs. 70.4 (SD 2.0)g; p<0.001]. This was confirmed after statistical adjustment [80.0 (SD 6.4)g vs. 67.6 (SD 3.8)g; p=0.032]. A higher energy intake was also observed [CK 1741.6 (SD 584.0) vs. TK 1481.7kcal (SD 576.0)kcal; p=0.014], which could not be confirmed after the statistical adjustment [1608.1 (SD 134.9) vs. 1466.8kcal (SD 80.5)kcal; p=0.243].
Regarding the presence or absence of malnutrition and protein intake, a higher intake was observed in malnourished compared to well-nourished patients (WN) [MN 85.4 (SD 3.6)g vs. WN 75.5 (SD 3.2)g; p=0.040], which was confirmed after statistical adjustment [MN 77.7 (SD 4.9)g vs. WN 69.9 (SD 4.7)g; p=0.037]. In the case of energy, no differences in consumption were observed according to nutritional status [MN 1706.3 (SD 73.6)kcal WN vs. 1543.5 (SD 66.4)kcal; p=0.102], even after statistical adjustment [MN 1606.0 (SD 102.9) vs. WN kcal 1468.8 (SD 99.0)kcal; p=0.078].
After the GLM statistical analysis, there were no statistically significant differences in protein intake (p=0.919) or energy (p=0.909) when combining the variables of nutritional status and type of kitchen, and they were not detected after statistical adjustment (p=0.410, proteins; p=0.340, energy) (Figs. 1 and 2).


The organization of hospital kitchens can be more than one aspect of hospital management since it can affect the intake of inpatients and, ultimately, affect their nutritional status.
The prevalence of malnutrition and risk of malnutrition detected in this study was high in both centres, and there were no differences in the evaluated nutritional characteristics. The PREDyCES® study, a multicentre study carried out in Spain, highlighted that 23% of patients admitted in Spanish hospitals were at risk of malnutrition according to NRS-2002.2 These results were lower than ours, although the differences in the methodology used should be noted. Also, in 2008 Vidal et al. studied the prevalence of malnutrition according to the SGA, obtaining a percentage of 33.3%. These results were slightly lower than the ones obtained in our study, although the differences in population and hospital characteristics might lead to these disparities.12
The large number of different stakeholders made it difficult to evaluate hospital meal quality due to individual expectations.6 For Nutrition Day 2006, a direct relationship between the perceived quality of food and intake was observed. Most patients rejected hospital food for such reasons as lower appetite, nausea, or inadequate food flavour, in accord with the results of our study.13 In the study by Clark et al., the sensory characteristics of food, such as texture, flavour or temperature, were the most valuable properties for patients.14
It has been demonstrated that if the temperature is not adequate, the patient may reject the food and increase the risk of malnutrition throughout the hospital stay.15 It should not be forgotten that malnourished patients tend to eat slowly, which increases the time food is exposed to room temperature, and thus a decrease in temperature might occur.5 This implies that the patient stops eating because they do not get the same pleasure if their food was at the right temperature. Food consumption in HGUGM was higher than in CAULE. One reason for this is that the temperature of food in HGUGM at the time of the reception by the patient was much higher than in CAULE. Patients received food right after the chilled kitchen heated in the food carts regenerators, which preserved an adequate temperature for the meals. On the other hand, the traditional kitchen at CAULE did not allow for imminent distribution of meals, which directly affected the decrease of temperature, even though physical procedures were used (isothermal trails). Those might be the cause of the differences in acceptance found between the two centres in the study. One of the limitations of the study is that it was not contemplate in the design of it the possibility to analyze the impact of the decrease of the temperature per calorie or gram of protein intake.
Guarantying an adequate temperature of food is also important to ensure the safety of food,16 independently of a kitchen's organization system. Taking into account the obtained results, the manager of the evaluated traditional kitchen should consider revaluating the procedures to guarantee an adequate food temperature, which would preserve sensorial and safety characteristics of meals.
The estimation of the nutritional requirements revealed that the energy and protein needs were similar both at CAULE and HGUGM, which can be justified due to the similarities in age, weight and height of the populations (which were used to estimate the basal energy expenditure), although at HGUGM there were fewer women than men, who usually have a higher basal energy expenditure. Also, the principal diagnoses of the patients varied by centre, so that could have influenced total energy expenditure through variations in metabolic stress. On the other hand, the prescribed energy and protein amounts were higher at HGUGM than at CAULE. It is striking that HGUGM that serves only three meals and recipes, a priori, similar to the ones of CAULE, manages to provide more energy and protein to patients. Finally, patient intake was statistically superior in HGUGM and, for patients who were able to calculate their nutritional needs, the prescribed diet and consumption appeared to successfully cover their requirements. With respect to the relationship between nutritional status and oral intake, studies like Schindler's have shown that malnourished patients, or those at risk of malnutrition, had a lower caloric intake compared to well-nourished patients.17 Other studies have demonstrated that only 31% of hospitalized patients covered energy and protein needs by eating hospital food.18 Also, the Nutrition Day survey shows there is a higher risk of mortality when there is less food intake in hospitalized patients.17
To our knowledge, this is the first study comparing inpatient intakes served from two types of kitchen organization and considering the nutritional status of the patient. The most relevant and innovative result of this study was that the major energy and protein intake in malnourished patients served from the CK at HGUGM respect of malnourished ones served from the TK at CAULE. Furthermore, in both types of kitchen, malnourished patients ate more.
One of the strengths of the study was that the evaluation of the intake was performed at the patient's bedside and always by the same dietitian. In this way it was guaranteed that the intake was actually performed by the patient. At the other side, the presence of the dietitian, could have an influence in the quantity of the intake.
We understand that our study has several limitations. There were major geographic, political, and medical differences and variation in personnel and physical size between the two centres. Differences also existed regarding the system of management and organization of the hospital kitchens. Therefore, the results obtained are biased with respect to the two centres. The number of participants was higher at CAULE (201) than at HGUGM (41), which could bias the results, and the time period for the study at HGUGM was limited to two months. The populations showed differences in gender distribution (greater number of males at HGUGM), different reasons for admission to various specialties and a variety of main diagnoses. These results may justify differences and bias the results obtained, although we have tried to set some of these variables to reduce the confounding effect. Finally, this study did not consider the economic aspects of the hospitals.
As a final thought, it is essential to maintain continuous improvement in food service, such as conducting studies presented in this paper or consulting others already published in various scientific journals,19,20 and by gathering patients’ opinions and evaluating their characteristics.21–23 These two items should be the backbone of the changes deemed necessary for the food system to meet the needs of the patient and the current characteristics of the centre. Thus, new production systems can be developed, such as ‘Stemplicity’24 in the UK: this system is based on semi-preparative and individualized plating in a central kitchen with all the dishes that are on a free choice menu. The storage temperature is set at <5°C, and food is served at the time of intake at refrigerator temperature (for those dishes consumed in cold) and by terminating the heat (for hot meals) up to 75°C in a powerful microwave located in every ward of the hospital. For heating, the plate is coated with a plastic film, which prevents dehydration of the product and maintains the temperature until consumption. Since the plates are stored under the centre's own cooling system, Stemplicity allows the patient to choose pre-intake hours and the desired dishes in each meal. In addition, the system provides food safety throughout the process until the food arrives for the patient.
In conclusion, chilled kitchen systems could increase the energy and protein intake in hospitalized patients in comparison to traditional kitchens, which is particularly necessary for malnourished patients.
Financial supportAll the authors would like to thank also the following institutions which founded the study are: Department of Education, Spanish Government. FPU AP 2007-02026. Gerencia Regional de Salud de la Junta de Castilla y León “SACYL GRS 327/B/08”. Gerencia Regional de Salud de la Junta de Castilla y León “SACYL GRS 528/B/10”. Gerencia Regional de Salud de la Junta de Castilla y León “SACYL GRS 811/A/13”.
Conflict of interestAll the authors declare they have no competing financial interests in relation to the work described herein.
We are really thankful to Prof. Marinos Elia (University of Southampton-UK) for his generous collaboration on technical advice of this study.
