


Prevalence of non-alcoholic fatty liver disease (NAFLD) in developed countries is 30% in the general population and 50% in patients with type 2 diabetes mellitus (T2DM). The aim of this study was to compare the severity of NAFLD, as assessed by liver biopsy and using the non-invasive index NAFLD Fibrosis Score (NFS), in subjects with and without T2DM.
Patients and methodsThe study sample consisted of 217 patients with biopsy-proven NAFLD. Anthropometric assessments, laboratory tests, histological criteria established by the Non-alcoholic Steatohepatitis Clinical Research Network (NASH CRN), and the NFS were recorded.
ResultsPatients with T2DM (n=36; 16.5%) had higher HOMA-IR values (6.3±3.6 vs. 3.3±2.4; p<0.0001), GGT levels (125.2±102.3 vs. 82.5±70.6IU/l; p<005), and NFS index (−0.6±0.2 vs. −1.8±0.1; p<0.001) than subjects with no T2DM. Patients with T2DM were found higher rates of NASH (72.2% vs. 48.6%; p<0.05), advanced steatosis (80.6% vs. 63%; p<0.05), and liver fibrosis (75% vs. 43.1%, p<0.05) than patients with no T2DM. Patients with T2DM also had higher NFS values (−0.6±1.2 vs. −1.8±1.8: p=0.01). A logistic regression analysis adjusting for age, gender and BMI showed a significant independent association between NASH and presence of T2DM (OR=4.2: 95% CI: 1.4–12.1; p=0.007). A second model adjusting for the same covariates showed T2DM to be an independent factor associated to advanced fibrosis (OR=4.1; 95% CI: 1.7–9.7).
ConclusionPatients with T2DM have more advanced degrees of NAFLD and advanced fibrosis as assessed by liver biopsy and the NFS index. Particular attention should be paid to the study and monitoring of NASH in patients with T2DM.
La prevalencia de la enfermedad hepática grasa no alcohólica (NAFLD) en los países desarrollados es del 30% de la población general y del 50% de los pacientes con diabetes mellitus tipo 2 (DM2). El objetivo de este estudio fue comparar la gravedad de NAFLD evaluado por biopsia hepática y con un índice no invasivo NAFLD Fibrosis Score (NFS) en sujetos con DM2 frente a pacientes no diabéticos.
Pacientes y métodosEste estudio se llevó a cabo entre 217 pacientes con diagnostico mediante biopsia de NAFLD. Se registraron la valoración antropométrica, pruebas de laboratorio, criterios histológicos establecidos por la Red de Investigación Clínica de Esteatohepatitis No Alcohólica (NASH) y NFS.
ResultadosLos pacientes con DM2 (n=36; 16,5%) tuvieron más HOMA-IR (6,3±3,6 vs. 3,3±2,4; p<0,0001), GGT (125,2±102,3 vs. 82,5±70,6UI/L); p<0,05) e índice NFS (−0,6±0,2 vs. −1,8±0,1; p<0,001) que los sujetos sin DM2. Los pacientes con DM2 presentaron mayor porcentaje de EHNA (72,2 vs. 48,6%; p<0,05), grado avanzado de esteatosis (80,6 vs. 63%; p<0,05) y fibrosis hepática (75 vs. 43,1%; p<0,05) que los pacientes sin DM2. Los pacientes con DM2 presentaron también valores más altos de NFS (−0,6±1,2 vs. −1,8±1,8; p=0,01). El análisis de regresión logística ajustado por edad, sexo e IMC mostró asociación significativa independiente entre la esteatohepatitis y la presencia de DM2 (OR=4,2; IC 95%: 1,4-12,1; p=0,007). Un segundo modelo ajustado por las mismas covariables mostró que la DM2 fue un factor independiente asociado a la fibrosis avanzada (OR=4,1; IC 95%: 1,7-9,7).
ConclusiónLos pacientes con DM2 tienen grados más avanzados de NAFLD y fibrosis avanzada evaluados mediante biopsia hepática y el índice NFS. Debe prestarse especial atención al estudio y seguimiento de la esteatohepatitis en pacientes con DM2.
Non-alcoholic fatty liver disease (NAFLD) is the hepatic manifestation of metabolic syndrome.1 The spectrum of NAFLD severity is variable, ranging from mild symptoms to different degrees of inflammation, non alcoholic steatohepatitis (NASH), or a severe form of decompensated liver cirrhosis which occurs in a minority of patients.2 The prevalence of the NAFLD in developed countries is up to 30% for the general population, 50% in patients with type 2 diabetes mellitus (T2DM), 76% in obese people and almost 100% in patients with morbid obesity3 but prevalence is influenced by the diagnostic criteria used.4
The link between NAFLD and obesity, concurrent hypertension and dyslipidemia is not surprising and it has been well characterized in diabetic populations worldwide. The key pathogenesis of this association is related to insulin resistance.5,6
In addition to genetic predisposition, lifestyle changes and dietary habits increase the prevalence of obesity, diabetes mellitus, metabolic syndrome, cardiovascular disease and NAFLD. Insulin resistance plays a dominant role in the pathogenesis of NAFLD.7 Data from the 698 patients, obtained within 6 months of liver biopsies, showed that patients with definite NASH were more likely to be female and diabetics and these patients had higher levels of AST, ALT, alkaline phosphatase, GGT and HOMA-IR.8
Mortality of NAFLD patients with T2DM is three times higher compared with nondiabetic NAFLD patients.9 T2DM plays an important role in the pathogenesis and evolution of NAFLD, and it is included in the majority of non-invasive composite predictive scores for NASH and advanced fibrosis.10,11 At present, there are very few studies describing histopathological differences among NAFLD patients with and without T2DM.12,13 In most of these studies, patients with NAFLD and T2DM tend to have more advanced stages of NAFLD, particularly advanced fibrosis.13
Liver biopsy remains the gold standard in diagnosing and predicting the severity of NAFLD, with several histological features that can predict clinically relevant outcomes in NAFLD.14 With regard to non-invasive tools used in NAFLD, the NFS has been widely used as a reliable tool to predict advanced fibrosis.15–17 These new diagnostic techniques also appear in the guidelines for the management of this disease.18
The aim of this study was to compare the severity of NAFLD assessed by liver biopsy and with a non-invasive index as NAFLD Fibrosis Score (NFS) in subjects with T2DM vs. no diabetic patients.
Patients and methodsProcedureThis is a cross sectional study with patients enrolled in Gastroenterology Department of Hospital Clinic University in Valladolid from January 2012 to December 2016. Informed consent was obtained from all subjects before participation in the study. The protocol has been approved by the ethics committee of the Hospital (Registration Code: F0-P07-10).
The study was conducted among 217 patients with NAFLD proven biopsy (36 with T2DM (naïve patients) and 181 without T2DM). Inclusion criteria were adult patients (>18 years of age) with histologically proven NAFLD, who had not received any prior therapies that may have been beneficial for NAFLD, such as Vitamin E, pentoxifylline, a previous diet and exercise weight loss programs. Patients with excessive alcohol consumption, >30g per day for males and >20g per day for females, were excluded. Similarly, patients with other potential causes of liver disease, including those with hepatotoxic drug history, viral hepatitis, hemochromatosis, autoimmune hepatitis, Wilson's disease or alpha 1 antitrypsin disease were excluded. The use of statins or angiotensin-converting enzyme-inhibitor (ACE-I)/angiotensin receptor blocker within 6 months prior to the liver biopsy were exclusion criteria, too.
Clinical data and anthropometric assessmentsDemographic data, sex, age and nationality were obtained for each patient. The diagnosis of T2DM was based on American Diabetes Association (ADA) criteria.19 All patients are naïve T2DM without pharmacological treatment. Hypertension was diagnosed by blood pressure ≥130/85 or treatment of previously diagnosed hypertension.20 Weight was measured with a calibrated scale (SECA, Hamburg, Germany) to the nearest 0.1kg with the minimal clothing without shoes. Height was measured using a non-stretchable measurement tape with the precision of 0.1cm (SECA, Hamburg, Germany). The measurements were taken one time by a trained researcher. The body mass index (BMI) was calculated as weight (kg) divided by height squared (m2). Waist circumference (WC) was measured in standing position at the level of the umbilicus and hip circumference (HC) was measured at the maximum point between the hip and the buttock with a flexible non-stretchable measuring tape (Type SECA, SECA, Birmingham, UK)
Laboratory testVenous blood was collected in EDTA containing tubes after a 12-h overnight fast. Liver function tests [serum albumin, bilirubin, alkaline phosphatase (ALP), aspartate aminotransferase (AST), alanine aminotransferase (ALT), Gamma-glutamyl transferase (GGT)] and albumin were measured using a biochemical auto-analyzer (Hitachi 7060, Tokyo, Japan). Platelet count and international normalized ratio (INR) were measured using a biochemical auto-analyzer (Beckman-Coluter, Tokyo, Japan).
Glucose, total cholesterol, triglyceride, low density lipoprotein cholesterol (LDL) and high density lipoprotein cholesterol (HDL) were measured using a biochemical auto-analyzer (Hitachi 7060, Tokyo, Japan). LDL cholesterol was calculated using Friedewald formula. Fasting glucose was determined by the enzymatic colorimetric method (glucose oxidase). Fasting insulin was measured by radio-immunoassay method (RIA) (RIA Diagnostic Corporation, Los Angeles, CA) with a sensitivity of 0.5mUI/L (normal range 0.5–30mUI/L). Homeostasis model assessment of insulin resistance (HOMA-IR) was calculated with the following equation (HOMAIR=(insulin×glucose)/22.5).21
Metabolic syndrome and liver studyTo estimate the prevalence of Metabolic Syndrome (MS), the definitions of the ATP-III was considered.11 The cutoff point for the criteria used was the presence of three or more of the following clinical signs; central obesity (waist circumference >88cm for females and >102cm for males), hypertension (systolic blood pressure ≥130mmHg or diastolic blood pressure ≥85mmHg or on treatment), hypertriglyceridemia (triglycerides ≥150mg/dl or on treatment), HDL-Cl (<40mg/dl in men and <50mg/dl in women) or fasting plasma glucose ≥110mg/dl or on treatment for their diabetes.
To minimize inter-observer variability, liver biopsy specimens were read by the same pathologist using the SAF (Steatosis, Activity, Fibrosis) score which assesses separately the grade of steatosis (S, from S0 to S3), the grade of activity (A from A0 to A4 by adding grades of ballooning and lobular inflammation, both from 0 to 2) and the stage of fibrosis (F from F0 to F4).22 Histological criteria for assessing tissue adequacy were implemented (i.e., patients with liver tissues <1.5cm in length or <5 portal tracts were excluded). All Fibrosis was classified into 4 stages with advanced fibrosis defined as stage 3–4 fibrosis (bridging fibrosis–cirrhosis). NAFLD was defined histologically by the presence of minimum 5% of steatosis on liver biopsy. Steatosis was scored as 1, 2, or 3 for 5–33%, 34–66%, and >66% steatosis, respectively. Fibrosis was scored as 0, 1, 2, 3 and 4 for no fibrosis, perisinusoidal or periportal, perisinusoidal and portal/periportal, bridging, and cirrhosis, respectively. Lobular inflammation was scored as 0, 1, 2, or 3 based on presence of no inflammation, <2 foci per 200×field, 2–4 foci per 200×field, and >4 foci per 200×field, respectively. Ballooning was scored as 0, 1, and 2 for no balloon cell, few balloon cells, and many cells/prominent ballooning cells, respectively. Lastly, Mallory's hyaline was scored as 0 for “none to rare” or 1 for “many”. A fibrosis score of ≥2 was considered advanced fibrosis. A case presenting with at least grade 1 of each of the three features (steatosis, ballooning, and lobular inflammation) was classified as NASH.22
Non alcoholic fatty liver disease fibrosis score (NFS) was calculated according to the published formula; NFS: −1.675+0.037×age (years)+0.094×body mass index (BMI; kg/m2)+1.13×impaired fasting glycaemia or T2DM (yes=1, no=0)+0.99×AST/ALT ratio−0.013×platelet (×109L–1)−0.66×albumin (g/dl).16 The cut-off points of the NFS used to categorizing fibrosis were: <−1.455, −1.455 to 0.676, and >0.676 for low, indeterminate and high probability for advanced fibrosis, respectively.23
Statistical analysisSample size was calculated to detect a difference of 20% NASH between patients with T2DM and without T2DM. A minimum of 30 subjects with T2DM and 150 without T2DM were necessary to enroll. Descriptive statistics were computed for all variables and reported as means and standard deviations (SDs) for continuous variables or frequencies and percentages for categorical variables. Baseline characteristics and differences in demographic, clinical, histological and laboratory indices between patients with and without T2DM were as curtained, using Student's T tests and Pearson's chi-square testing for continuous and categorical variables, respectively. Mann–Whitney U test was also performed when applicable. The utility of NFS was correlated with histological staging of fibrosis in both T2DM and no T2DM patients. Logistic regression analyses adjusted by age, gender and BMI were used to calculated odds ratio (OR) and 95% confidence interval (CI) to estimate the association of the T2DM with the risk of NASH and liver fibrosis. All analyses were performed using SPSS version 21 statistical software (Chicago, IL, USA). A p value <0.05 was considered statistically significant.
ResultsA total of 217 NAFLD patients were enrolled in the study. A total of 47.5% of them were female with an average age of 43.8±11.5 years. 128 patients (58.9%) had concomitant hypertension, 36 patients (16.5%) had T2DM and both conditions were present in 30 patients (13.8%). Mean BMI was 36.1kg/m2. NASH was present in 114 patients (52.5%) of the total group and a total of 101 patients (48.4%) had liver fibrosis.
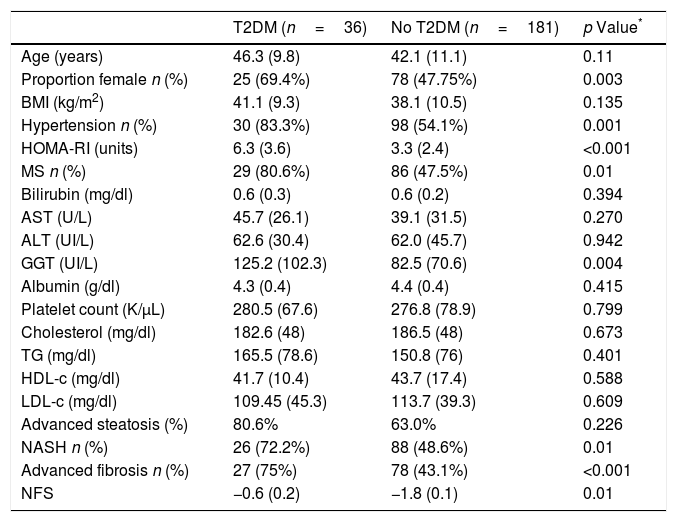
Patients with T2DM (n=36; 16.5%) had similar age (46.3 (9.8) vs 42.1 (11.1) years; p=0.11), HOMA-IR (6.3 (3.6) vs. 3.3 (2.4); p<0.0001), GGT levels (125.2 (102.3) vs. 82.5 (70.6) UI/L; p=0.004) and NFS index (−0.6 (0.2) vs. −1.8 (0.1); p<0.01) than subjects without T2DM (Table 1). Patients with T2DM had more frequently hypertension (n=30; 83.3% vs. n=98; 54.1%: p=0.001) and metabolic syndrome (n=29; 80.6% vs. n=86; 47.5%; p<0.0001).
Comparison of liver biopsy between patients with and without T2DM.
| T2DM (n=36) | No T2DM (n=181) | p Value* | |
|---|---|---|---|
| Age (years) | 46.3 (9.8) | 42.1 (11.1) | 0.11 |
| Proportion female n (%) | 25 (69.4%) | 78 (47.75%) | 0.003 |
| BMI (kg/m2) | 41.1 (9.3) | 38.1 (10.5) | 0.135 |
| Hypertension n (%) | 30 (83.3%) | 98 (54.1%) | 0.001 |
| HOMA-RI (units) | 6.3 (3.6) | 3.3 (2.4) | <0.001 |
| MS n (%) | 29 (80.6%) | 86 (47.5%) | 0.01 |
| Bilirubin (mg/dl) | 0.6 (0.3) | 0.6 (0.2) | 0.394 |
| AST (U/L) | 45.7 (26.1) | 39.1 (31.5) | 0.270 |
| ALT (UI/L) | 62.6 (30.4) | 62.0 (45.7) | 0.942 |
| GGT (UI/L) | 125.2 (102.3) | 82.5 (70.6) | 0.004 |
| Albumin (g/dl) | 4.3 (0.4) | 4.4 (0.4) | 0.415 |
| Platelet count (K/μL) | 280.5 (67.6) | 276.8 (78.9) | 0.799 |
| Cholesterol (mg/dl) | 182.6 (48) | 186.5 (48) | 0.673 |
| TG (mg/dl) | 165.5 (78.6) | 150.8 (76) | 0.401 |
| HDL-c (mg/dl) | 41.7 (10.4) | 43.7 (17.4) | 0.588 |
| LDL-c (mg/dl) | 109.45 (45.3) | 113.7 (39.3) | 0.609 |
| Advanced steatosis (%) | 80.6% | 63.0% | 0.226 |
| NASH n (%) | 26 (72.2%) | 88 (48.6%) | 0.01 |
| Advanced fibrosis n (%) | 27 (75%) | 78 (43.1%) | <0.001 |
| NFS | −0.6 (0.2) | −1.8 (0.1) | 0.01 |
Variables data are presented based on mean (SD).
BMI body mass index, HOMA-RI: Homeostatic model assessment WC waist circumference, TC total cholesterol, TG triglyceride, HDL-C high density cholesterol, LDL-C low density cholesterol, ALT alanine amino transferase, AST aspartate amino transferase, GGT gamma glutamine transferase, T2DM: type 2 diabetes mellitus, Ms metabolic syndrome. NASH: non alcoholic steatohepatitis. NFS: non alcoholic fibrosis score.
Table 1 shows differences in liver biopsy between patients with and without T2DM. Patients with T2DM presented higher percentage of NASH (72.2% vs. 48.6%; p=0.01), advanced degrees of steatosis (80.6% vs. 63%; p=0.01) and liver fibrosis (75% vs. 43.1%, p<0.001) than patients without T2DM. Interestingly, patients exhibiting concomitant fibrosis and NASH (n=78; 35.9%) had a higher percentage of T2DM than patients with isolated fibrosis or NASH (26.9% vs. 10.8% p<0.05).
A logistic regression analysis adjusted by age, gender and BMI showed independent significant association between NASH and presence of T2DM (OR=4.2: 95% CI: 1.4–12.1; p=0.007). A second model adjusted by the same covariates showed that T2DM was an independent factor associated to advanced fibrosis (OR=4.1; 95%CI: 1.7–9.7).
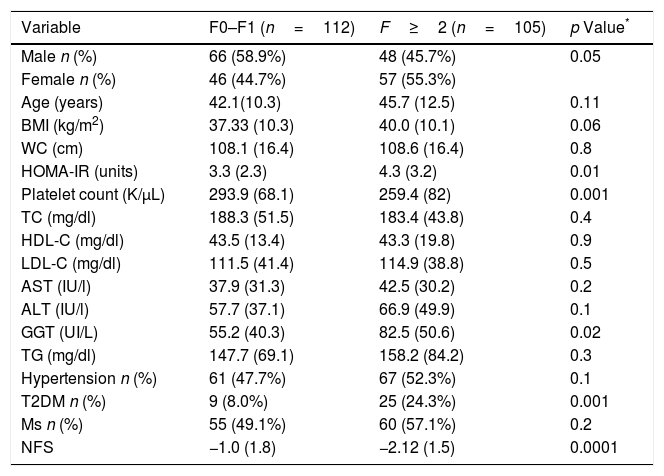
Table 2 shows differences between patients with and without fibrosis; distribution of patients was: F0 (n=111; 51.2%), F1 (n=76; 35%), F2 (n=12, 5.5%), F3 (n=12; 5.5%) and F4 (n=6; 2.8%). Patients with advanced fibrosis (F≥2) showed higher age (45.7 (12.5) vs. 42.1 (10.3) years; p=0.01), HOMA-IR (4.3 (3.3) units vs. 3.3 (2.3) units; p=0.01), GGT levels (55.2 (40.3) vs. 82.5 (50.6) UI/L; p=0.02), T2DM percentage (24.3% vs. 8%; p=0.001) than patients without advanced fibrosis. Patients with advanced fibrosis presented higher values of NFS (−1.0 (1.8) vs. −2.2 (1.5); p<0.0001), too. A total of 92 patients (88.2%) with advanced fibrosis were correctly diagnosed by NFS index.
Parameters of patients with non-alcoholic fatty liver disease, divided according to fibrosis ≤1 vs. advanced fibrosis (F≥2).
| Variable | F0–F1 (n=112) | F≥2 (n=105) | p Value* |
|---|---|---|---|
| Male n (%) | 66 (58.9%) | 48 (45.7%) | 0.05 |
| Female n (%) | 46 (44.7%) | 57 (55.3%) | |
| Age (years) | 42.1(10.3) | 45.7 (12.5) | 0.11 |
| BMI (kg/m2) | 37.33 (10.3) | 40.0 (10.1) | 0.06 |
| WC (cm) | 108.1 (16.4) | 108.6 (16.4) | 0.8 |
| HOMA-IR (units) | 3.3 (2.3) | 4.3 (3.2) | 0.01 |
| Platelet count (K/μL) | 293.9 (68.1) | 259.4 (82) | 0.001 |
| TC (mg/dl) | 188.3 (51.5) | 183.4 (43.8) | 0.4 |
| HDL-C (mg/dl) | 43.5 (13.4) | 43.3 (19.8) | 0.9 |
| LDL-C (mg/dl) | 111.5 (41.4) | 114.9 (38.8) | 0.5 |
| AST (IU/l) | 37.9 (31.3) | 42.5 (30.2) | 0.2 |
| ALT (IU/l) | 57.7 (37.1) | 66.9 (49.9) | 0.1 |
| GGT (UI/L) | 55.2 (40.3) | 82.5 (50.6) | 0.02 |
| TG (mg/dl) | 147.7 (69.1) | 158.2 (84.2) | 0.3 |
| Hypertension n (%) | 61 (47.7%) | 67 (52.3%) | 0.1 |
| T2DM n (%) | 9 (8.0%) | 25 (24.3%) | 0.001 |
| Ms n (%) | 55 (49.1%) | 60 (57.1%) | 0.2 |
| NFS | −1.0 (1.8) | −2.12 (1.5) | 0.0001 |
Values are statistically significant at p<0.05.
BMI body mass index, WC waist circumference, TC total cholesterol, TG triglyceride, HDL-C high density cholesterol, LDL-C low density cholesterol, ALT alanine amino transferase, AST aspartate amino transferase, T2DM: type 2 diabetes mellitus, Ms metabolic syndrome.
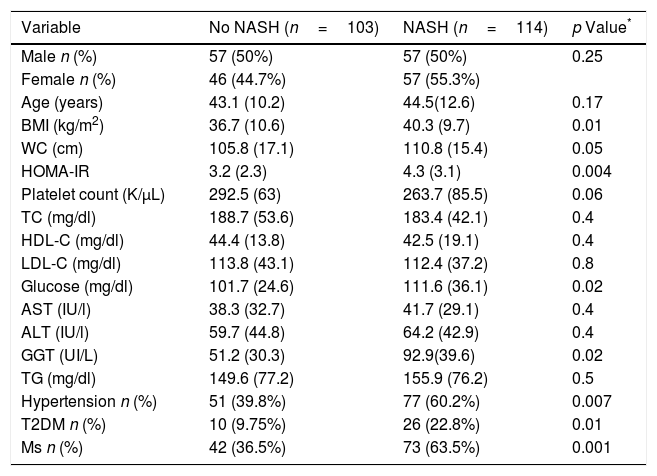
A total of 114 patients (52.5%) had a NASH (Table 3). BMI (40.3 (9.7) kg/m2 vs. 36.7 (10.6) kg/m2; p=0.01), WC (110.8 (15.4) cm vs. 105.8 (17.1) cm; p=0.04), HOMA-IR (4.3 (3.1) units vs. 3.2 (2.3) unit; p=0.004), GGT levels (125.2 (102.3) vs. 82.5 (70.6) UI/L: p=0.02), percentage of hypertension (n=77; 60.2% vs. n=51; 39.8%; p=0.007), percentage of T2DM (n=26; 22.8% vs. n=10; 9.7%: p=0.01) and percentage of MS (n=73; 63.5% vs. n=42; 36.5%; p=0.001) were higher in subjects with NASH. A total of 114 patients with NAS score >5, n=78 (68.4%; p<0.0001) had fibrosis, too.
Parameters of patients with non-alcoholic fatty liver disease, divided according to NASH vs. no NASH (steatosis ≥1+ballooning ≥1+lobular inflammation ≥1).
| Variable | No NASH (n=103) | NASH (n=114) | p Value* |
|---|---|---|---|
| Male n (%) | 57 (50%) | 57 (50%) | 0.25 |
| Female n (%) | 46 (44.7%) | 57 (55.3%) | |
| Age (years) | 43.1 (10.2) | 44.5(12.6) | 0.17 |
| BMI (kg/m2) | 36.7 (10.6) | 40.3 (9.7) | 0.01 |
| WC (cm) | 105.8 (17.1) | 110.8 (15.4) | 0.05 |
| HOMA-IR | 3.2 (2.3) | 4.3 (3.1) | 0.004 |
| Platelet count (K/μL) | 292.5 (63) | 263.7 (85.5) | 0.06 |
| TC (mg/dl) | 188.7 (53.6) | 183.4 (42.1) | 0.4 |
| HDL-C (mg/dl) | 44.4 (13.8) | 42.5 (19.1) | 0.4 |
| LDL-C (mg/dl) | 113.8 (43.1) | 112.4 (37.2) | 0.8 |
| Glucose (mg/dl) | 101.7 (24.6) | 111.6 (36.1) | 0.02 |
| AST (IU/l) | 38.3 (32.7) | 41.7 (29.1) | 0.4 |
| ALT (IU/l) | 59.7 (44.8) | 64.2 (42.9) | 0.4 |
| GGT (UI/L) | 51.2 (30.3) | 92.9(39.6) | 0.02 |
| TG (mg/dl) | 149.6 (77.2) | 155.9 (76.2) | 0.5 |
| Hypertension n (%) | 51 (39.8%) | 77 (60.2%) | 0.007 |
| T2DM n (%) | 10 (9.75%) | 26 (22.8%) | 0.01 |
| Ms n (%) | 42 (36.5%) | 73 (63.5%) | 0.001 |
Values are statistically significant at p<0.05.
Variables data are presented based on mean (SD).
BMI, body mass index; WC, waist circumference; TC, total cholesterol; TG, triglyceride; HDL-C, high density cholesterol; LDL-C, low density cholesterol; ALT, alanine amino transferase; AST, aspartate amino transferase; T2DM, type 2 diabetes mellitus; Ms, metabolic syndrome.
The present study shows that the clinical spectrum of NAFLD is different among patients with and without T2DM. More aggressive NAFLD was present in T2DM patients compared with non-T2DM patients, as suggested by higher prevalence of NASH and fibrosis.
NAFLD is considered the hepatic manifestation of MS.1 T2DM is not only associated with NAFLD, but it has also been shown to be an independent risk factor for the development of NASH.24,25 In T2DM, NAFLD shows a more aggressive clinical course with necro-inflammation and fibrosis and progression to end-stage chronic liver disease.26 Beyond these hepatic consequences, NAFLD is being increasingly associated with cardiovascular disease risk (CVD), coronary artery disease, as well as peripheral vascular disease.27,28
Individuals with NAFLD have an increased risk of T2DM and CVD morbidity and mortality. In some patients, NAFLD is the precursor of NASH, a more serious pathologic stage of NAFLD that develops when hepatic inflammation and injury occur.29 In our study, patients with T2DM have a higher degree of steatosis, increased frequency of NASH and fibrosis, which are similar findings to those observed by Puchakayala et al.13 This relationship is an important problem because worldwide prevalence of obesity and T2DM is escalating due to sedentary lifestyles and alteration in dietary habits.14
In our study, the NFS had a good accuracy to identify patients with and without advanced fibrosis. However, subgroup analysis suggested that the utility of the NFS (had divergent clinical reliability for NAFLD patients with and without T2DM), showing an indeterminate and a low probability for advanced fibrosis, respectively. This is particularly interesting taking to account the exclusion of advanced fibrosis in patients without T2DM, although these results must be analyzed in the context of a relatively lower prevalence of advanced fibrosis among the non-T2DM. Accordingly to these findings, MacPherson et al. in a recent study of 448 patients diagnosed with NASH by liver biopsy (and 108 of them with at least two serial biopsies), reported a significant relationship between the progressive variation of NFS and changes in the degree of liver fibrosis. NFS showed high effectiveness in identifying patients with advanced fibrosis on liver biopsy performed during follow-up.11,14
Our study describes for the first time in the literature that a noninvasive index as NFS detect liver fibrosis in patients with T2DM and fibrosis without the need for liver biopsy, which would make it easier to identify this subgroup of patients who are the most at risk of progression of NAFLD. The usefulness of the NFS and other fibrosis scores may have disparate clinical reliability for NAFLD patients with and without DM, which highlights the heterogeneity of NAFLD phenotype and the NFS can be adjusted in different subsets NAFLD patients.
Although NAFLD patients with T2DM had higher prevalence of NASH30 and advanced fibrosis, the potential risk of severe NAFLD cannot be overlooked in patients without T2DM since both NASH and advanced fibrosis occur in a significant proportion of these patients. Patients with NAFLD and T2DM should be properly monitored for optimal control of diabetes, hyperlipidemia, treatment and screening for cardiovascular complications and should also pay attention to the possible progression of NASH and/or advanced/fibrosis. Doycheva et al.31 propose that liver biopsy should be considered in these patients. Some of the outlined above risk factors are components of the NFS, which can predict a presence or absence of advanced fibrosis in NAFLD.
Our design has some limitations. First, since our cross-sectional study cannot assess causality, further prospective studies will be necessary. Finally, the absence of HbA1c levels in diabetic patients, it is also a limitation.
In conclusion, patients with T2DM have advanced degrees of NAFLD more in terms of NASH and advanced fibrosis as evaluated by liver biopsy and the NFS index. Particular attention should be paid to the study and monitoring of NASH in patients with T2DM. Non-invasive indices can be an important tool to evaluate these patients.
FundingThere is no external financing for this article.
Conflict of interestsThe authors declare no conflict of interests.
“Los autores agradecen la colaboración del Dept Medico de Menarini en la realización de este trabajo de investigación”
