


Treatment with oral antineoplastic agents known as tyrosine kinase inhibitors (TKIs) is new and, thus, little is known about their impact on nutritional status (NS), dietary intake, quality of life, and survival. The aim of this study was to provide information on these components in order to guide future nutritional recommendations.
Patients and methodA prospective, observational study in adults who start treatment with TKIs, in whom NS was assessed using the Patient-Generated Subjective Global Assessment (PG-SGA), anthropometric measures, biochemical parameters, and dietary intake (24-h dietary recall). The EORTC QLQ-30 was used to assess quality of life. Nonparametric tests were used in statistical analysis, and survival was analyzed using Kaplan–Meier and log-rank curves.
ResultsOf the overall sample, 21.7% had moderate malnutrition according to PG-SGA, and 74.2% moderate weight loss at 6 months, but no patient had BMI<18.5kg/m2. Patients with moderate malnutrition had lower survival at four years of diagnosis (log-rank=0.015).
Energy intake was lower than recommended by the ESPEN 2017 congress, and no patient covered the protein requirements (1.5g protein/kg weight) during follow-up.
A worse score on the global health scale of the EORTC QLQ-C30 was related to worse NS.
ConclusionsTreatment with TKIs does not appear to have a significant impact on NS and quality of life after 6 months of follow-up. Malnutrition should be prevented through individualized nutritional advice because it is related to shorter survival.
El tratamiento con antineoplásicos orales tipo inhibidores de tirosina quinasa (ITK) es novedoso, y por ello se conoce poco sobre cómo afectan al estado nutricional (EN), la ingesta dietética, la calidad de vida, y su influencia sobre la supervivencia. Este estudio pretende aportar información estos componentes, para dirigir las recomendaciones nutricionales futuras.
Pacientes y métodoEstudio prospectivo y observacional en adultos que inician ITK, donde se valoró el EN mediante el cuestionario de valoración subjetiva global generada por el paciente (VSG-GP), medidas antropométricas, parámetros bioquímicos e ingesta dietética (Recuerdo de 24h). La calidad de vida se estudió con EORTC QLQ-C30. El análisis estadístico empleó pruebas no paramétricas y la supervivencia se analizó mediante curvas de Kaplan-Meier y log-rank.
ResultadosEl 21,7% de la muestra presentó desnutrición moderada según VSG-GP; el 74,2% mostró pérdida de peso moderada a los 6 meses, aunque ningún paciente tuvo un IMC<18,5 kg/m2. Los pacientes moderadamente desnutridos presentaron menor supervivencia a los 4 años del diagnóstico (log-rank=0,015).
El 44,4% realizó una ingesta energética inferior a las recomendaciones ESPEN 2017 y ningúnpaciente cubrió requerimientos proteicos (1,5 g proteína/kg peso) durante el seguimiento.
Una peor puntuación en la escala global de salud del EORTC QLQ-C30 se relacionó con peor EN.
ConclusionesEl tratamiento con ITK no parece afectar de manera importante el EN y la calidad de vida a los 6 meses de seguimiento. Se debe prevenir la desnutrición, mediante un consejo nutricional individualizado, pues se relaciona con menor supervivencia.
Cancer is one of the diseases with the greatest health impact, not only because of its prevalence, but also because of its high morbidity and mortality. According to the World Health Organization (WHO), cancer is the second leading cause of death worldwide,1 and has a very strong impact upon the quality of life of patients and their environment.
Oral anticancer treatments have been available since 1953, with the aim of facilitating the administration of chemotherapy and of offering greater convenience and quality of life. The use of such treatments has evolved substantially since the late 1990s thanks to advances in molecular biology.2 At present, biological therapies involving specific blocking mechanisms aimed at specific targets of the tumour cell include new oral cytostatic agents that represent approximately 25% of all such therapeutic approaches3 and, in our setting, approximately 38% of global chemotherapy.4 Within this class of drugs, tyrosine kinase inhibitors (TKIs) are the most representative family, accounting for more than 90% of the total.
During cancer treatment, the aim is to maintain the patient in a good nutritional status and to prevent the frequent malnutrition associated with asthenia, anorexia, weight loss, etc., which is favoured by the different antitumor strategies (chemotherapy, radiotherapy, immunotherapy, bone marrow transplantation, etc.), and has been related to lower survival.5 It should also be taken into account that in order to develop effective nutritional recommendations allowing for the maintenance or improvement of the nutritional status of patients, their dietary preferences and habits need to be studied.
While a very attractive management option, treatment with oral antineoplastic drugs poses new challenges that may condition their use. In addition, because of their relatively recent introduction on the market, few publications can be found regarding the influence of nutritional status upon overall survival in the context of such treatments. The purpose of the present study therefore was to assess nutritional status, energy intake, macro- and micronutrient consumption, and quality of life in a group of cancer patients starting treatment with TKIs. The overall survival of patients at four years and the influence of nutritional status upon survival was also studied.
Material and methodsA prospective observational study was made of a group of cancer patients from Hospital General Universitario Gregorio Marañón (Madrid, Spain) starting oral anticancer treatment with TKIs. The patients were recruited at the time of the first dispensing of their treatment at the Outpatient Unit of the Department of Pharmacy during the period from July 2012 to June 2013. Patients with an ECOG score of>2 were excluded, as were those receiving concomitant radiotherapy or participating in a clinical trial. The study protocol was approved by the Research Ethics Committee of the hospital, and was conducted in accordance with the basic principles of the Declaration of Helsinki. The patients were informed that participation in the study was voluntary, and all participants signed the informed consent.
The trial was conducted in collaboration with the Departments of Pharmacy and Oncology, and the Nutrition Unit. The study was structured into four visits: baseline (before starting treatment), and one month, three months and 6 months after the start of treatment. Monitoring was carried out by two experienced dieticians in order to reduce interobserver bias and bias related to the selected techniques and tools. Demographic variables (gender, age), prior cancer treatments (chemotherapy and/or radiotherapy), days from diagnosis to study entry, kind of tumour and type of TKI were documented at the start of the study. The following variables were collected at all visits:
Nutritional statusThe assessment of nutritional status was based on anthropometric measures (weight, height, and mean muscle circumference of the arm of the non-dominant side [MAC]), the Patient-Generated Subjective Global Assessment (PG-SGA),6 which categorizes patients into three groups according to their nutritional status (A=well nourished, B=moderately malnourished, and C=severely malnourished), and muscle strength of the dominant arm (MS) measured using a Collin dynamometer. Hematological and biochemical parameters (hemoglobin, visceral proteins, albumin, prealbumin, total cholesterol and its HDL and LDL fractions) were also recorded. The body mass index (BMI) was categorized according to the WHO as low weight (<18.5kg/m2), normal weight (18.5–24.9kg/m2), overweight (25–29.9kg/m2) and obesity (≥30kg/m2). Moderate weight loss was defined as the loss of <7.5% in three months or <10% in 6 months, while severe weight loss was defined as a loss of >10.5% with respect to the weight before starting treatment with TKIs. Circumferences were expressed in percentiles (p.) according to the reference population,7,8 and were classified as overweight (p.>85), normal (p.15–85), mild malnutrition (p.10–15), moderate malnutrition (p.5–10), and severe malnutrition (p.<5). Theoretical calculation of total daily energy expenditure was based on the Harris–Benedict formula, with a cancer treatment stress factor of 1.2 and a walking activity factor of 1.3.9
Dietary intakeTwenty-four hour recall (R24h) was used to assess dietary intake. The documented dietary intake was calibrated using the DietSource 3.0 application®.
Quality of life (QoL)Patient quality of life was assessed using the EORTC QLQ-C30 quality of life questionnaire.10 This instrument comprises different dimensions or scales: 5 functional scales (physical, role, cognitive, emotional and social), 8 symptom scales (fatigue, nausea-vomiting, pain, dyspnea, insomnia, anorexia, constipation and diarrhea) and one scale for assessing global health status. The scores of the scales were transformed to yield a score of 0–100, according to the instructions in the EORTC QLQ-30 manual. The outcomes are more positive the higher the score for the social and global health scales, while the outcomes are more negative the higher the score in the case of the symptoms.
Statistical analysisNormal data distribution was verified using the Kolmogorov–Smirnov test for independent samples and the Shapiro–Wilk test. Descriptive statistics such as absolute and relative frequencies (percentages) were calculated for qualitative variables, and the median and interquartile range (IQR) were calculated for quantitative variables. For statistical inferences we used the chi-squared test and the Friedman and Wilcoxon tests to study the evolution of quantitative variables, while the Spearman correlation test was used for qualitative variables. In addition, the Kruskal–Wallis test and Mann–Whitney U-test were used to determine the influence of the underlying disease, nutritional status and TKIs upon patient characteristics and intake. Survival was studied from study entry to four years after study completion using the Kaplan–Meier method, and its relation to nutritional status was assessed according to the PG-SGA with the log-rank test. The IBM SPSS® version 21 statistical package was used throughout. Statistical significance was considered for p<0.05.
ResultsPatient characteristicsA total of 31 patients were evaluated during the inclusion period, though only 22 met the inclusion criteria. The median time elapsed from diagnosis to the start of TKI therapy was 100days (range 26–628). A total of 17 patients (77%) completed the study. The withdrawals occurred between the third and sixth month of follow-up and were due to: three deaths, one voluntary withdrawal, and one change of treatment in the context of tumour progression.
The sample consisted of 12 men and 10 women with a mean age of 66years (range 50–76), with the following diagnoses: kidney cancer (47.8%), liver cancer (21.7%), lung cancer and gastrointestinal stromal tumour (GIST) (both 13%) and leukemia (4.5%). Seven of these patients had received some prior cancer treatment (intravenous chemotherapy in 2 cases and radiotherapy in 5). The most frequently prescribed TKI was pazopanib (30.4%), followed by sorafenib (21.7%), imatinib and sunitinib (both 17.5%). Gefitinib was the least prescribed drug of this kind (13%).
Nutritional statusNutritional status according to the PG-SGA before the start of treatment was group A in 73.9% of the patients and group B in 21.7%. There were no patients with severe malnutrition (group C). Likewise, the number of days from diagnosis showed no association with this classification of nutritional status. Moreover, patient nutritional status according to the PG-SGA showed no significant changes over the 6 months of follow-up.
The baseline anthropometric measurements were: BMI 27(27.2–30.7)kg/m2 and MAC 23.6(21.6–26)cm. A total of 45.5% of the sample had BMI within the normal range, 22.7% were overweight, and 31.8% were obese. Baseline MS was 23.5(17.2–31)N, with 36.4% of the sample below percentile10 (moderate malnutrition) and exhibiting a positive correlation to MAC (p=0.007; R2=0.32). Moderate weight loss was recorded at three months in 65.6% of the cases and severe weight loss in 4.3%. At 6 months, 74.2% of the study sample had a moderate weight loss of 2.2%(−2.9 to −4.9), but no patient had a BMI<18.5kg/m2.
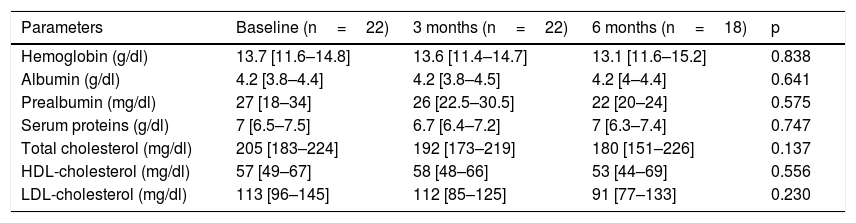
Table 1 describes the follow-up of the hematological and biochemical parameters. Prior to TKI initiation, 27.3% of the sample presented hemoglobin <12g/dl, 15.9% had prealbumin 5–15mg/dl, and 8.6% presented total visceral proteins <6.2g/dl. Total cholesterol was elevated (>200mg/dl) in 52.2% of the patients, with low HDL-cholesterol (<40mg/dl) in 13% and high LDL-cholesterol (>130mg/dl) in 21.4%. Poorer PG-SGA scores were recorded in patients with greater percentage weight loss and decreased albumin levels (Fig. 1). The albumin levels according to the PG-SGA were 4.3(4.0–4.5)g/dl for nutritional status corresponding to group A and 3.7(3.6–4.3)g/dl for group B (p=0.75). There were no values below 3.5g/dl in any patient. Likewise, there were no significant changes in the hematological and biochemical parameters according to the type of TKI prescribed.
Evolution of the biochemical and hematological parameters.
| Parameters | Baseline (n=22) | 3 months (n=22) | 6 months (n=18) | p |
|---|---|---|---|---|
| Hemoglobin (g/dl) | 13.7 [11.6–14.8] | 13.6 [11.4–14.7] | 13.1 [11.6–15.2] | 0.838 |
| Albumin (g/dl) | 4.2 [3.8–4.4] | 4.2 [3.8–4.5] | 4.2 [4–4.4] | 0.641 |
| Prealbumin (mg/dl) | 27 [18–34] | 26 [22.5–30.5] | 22 [20–24] | 0.575 |
| Serum proteins (g/dl) | 7 [6.5–7.5] | 6.7 [6.4–7.2] | 7 [6.3–7.4] | 0.747 |
| Total cholesterol (mg/dl) | 205 [183–224] | 192 [173–219] | 180 [151–226] | 0.137 |
| HDL-cholesterol (mg/dl) | 57 [49–67] | 58 [48–66] | 53 [44–69] | 0.556 |
| LDL-cholesterol (mg/dl) | 113 [96–145] | 112 [85–125] | 91 [77–133] | 0.230 |

According to the PG-SGA, dietary intake in the final month before the start of ITK treatment was rated as “without change” by 45.5% of the sample and “more than usual” and “less than usual” by 27.3% each.
According to the R24h questionnaire at baseline, the number of meals before the start of treatment was 4.5 (4–5), with 47.8% of the study sample consuming 5 or more meals a day, 52.2% 3–4 meals a day, and the rest two meals a day or fewer. A greater number of daily meals positively correlated to increased calorie intake (p=0.04), requiring at least 5 meals a day to exceed 2000kcal.
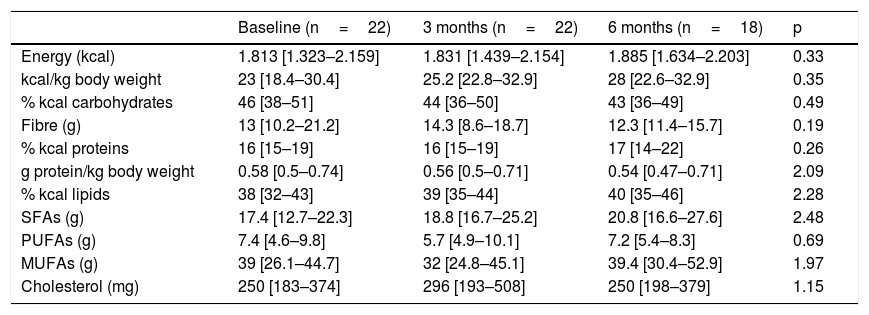
Table 2 shows the study variables referring to dietary intake; no significant variations were observed over time. Most of the patients (86.4%) did not reach the recommendation of 0.8g protein/kg body weight per day. In addition, there were significant gender differences in protein consumption, which from the start proved greater in males (0.7[0.56–0.83]g/kg body weight) than in women (0.51[0.35–0.62]g/kg body weight) (p<0.03). At 6 months of follow-up, the specific calorie requirements for cancer patients were not met (25–30kcal/kg body weight/day) by 44.4% of the study sample, and no patient was able to meet the established protein requirements (1.5g protein/kg body weight/day). The total energy intake provided by saturated fatty acids (SFAs) was 10%(6.7–10.5), versus 17%(15.5–21.6) for monounsaturated fatty acids (MFAs) and 3%(3–4.4) for polyunsaturated fatty acids (PUFAs). Cholesterol intake exceeded 300mg/day in 31.8% of the cases, and dietary fibre intake was <30g/day in 91.3% of the patients; these intakes were not related to altered lipid profiles. No differences were seen according to the baseline disease or TKI prescribed, and no relationship was found between any of the dietary intake, biochemical or hematological parameters and nutritional status according to the PG-SGA. No patient received oral nutritional supplementation during follow-up.
Evolution of dietary intake.
| Baseline (n=22) | 3 months (n=22) | 6 months (n=18) | p | |
|---|---|---|---|---|
| Energy (kcal) | 1.813 [1.323–2.159] | 1.831 [1.439–2.154] | 1.885 [1.634–2.203] | 0.33 |
| kcal/kg body weight | 23 [18.4–30.4] | 25.2 [22.8–32.9] | 28 [22.6–32.9] | 0.35 |
| % kcal carbohydrates | 46 [38–51] | 44 [36–50] | 43 [36–49] | 0.49 |
| Fibre (g) | 13 [10.2–21.2] | 14.3 [8.6–18.7] | 12.3 [11.4–15.7] | 0.19 |
| % kcal proteins | 16 [15–19] | 16 [15–19] | 17 [14–22] | 0.26 |
| g protein/kg body weight | 0.58 [0.5–0.74] | 0.56 [0.5–0.71] | 0.54 [0.47–0.71] | 2.09 |
| % kcal lipids | 38 [32–43] | 39 [35–44] | 40 [35–46] | 2.28 |
| SFAs (g) | 17.4 [12.7–22.3] | 18.8 [16.7–25.2] | 20.8 [16.6–27.6] | 2.48 |
| PUFAs (g) | 7.4 [4.6–9.8] | 5.7 [4.9–10.1] | 7.2 [5.4–8.3] | 0.69 |
| MUFAs (g) | 39 [26.1–44.7] | 32 [24.8–45.1] | 39.4 [30.4–52.9] | 1.97 |
| Cholesterol (mg) | 250 [183–374] | 296 [193–508] | 250 [198–379] | 1.15 |
MUFAs: monounsaturated fatty acids; PUFAs: polyunsaturated fatty acids; SFAs: saturated fatty acids.
The results of the EORTC QLQ-C30 are shown in Figs. 2 and 3. Before the start of treatment, the most affected functional dimensions were the physical and cognitive scales, while fatigue, constipation and diarrhea were the prevalent symptoms. At 6 months of follow-up, no significant differences were observed in these results, though the symptoms of diarrhea and fatigue had increased.


The functional dimensions related to nutritional status both before the start of TKI treatment and during drug follow-up were the physical (p=0.01), role (p=0.008), emotional (p=0.046) and global health scales (p=0.008). The only symptom related to nutritional status was appetite, which presented lower scores in patients with nutritional status corresponding to group A.
Study of survival and its relation to nutritional statusOverall survival at four years from protocol entry was 85% at 5 months, 69% at one year, and 15% at 2.5 years. On considering nutritional status at the time of inclusion in the study, a significant difference was observed (log-rank=0.015) between patients with good nutritional status (group A according to the PG-SGA), who lived for a median of 725[158–1291] days from diagnosis, and patients with nutritional status corresponding to group B according to the PG-SGA, who survived for a median of 164[141–440] days. Fig. 4 shows the differences in survival according to nutritional status based on the PG-SGA.
Discussion
Healthcare professionals must take into account the broad range of factors that affect the outcome of patients starting TKI therapy. This type of home treatment is considered to be less aggressive than intravenous chemotherapy, and its consequences therefore may not be noticed in standard clinical practice. The results of this study offer an idea of what this type of oral antineoplastic therapy may cause in relation to patient nutritional status, energy intake and quality of life. In addition, the study shows that nutritional status may condition the survival of these patients.
Our findings underline the importance of comprehensive nutritional assessment. The PG-SGA remains the gold standard in patients of this kind, but always with nutritional screening being maintained to ensure adequate referral.11 The presence of malnutrition in our sample was less pronounced than in other studies.4,5,12 The use of anthropometric tools alone may underestimate the prevalence of malnutrition, for although no patient had low weight or percentiles below 15 during follow-up, moderate weight losses occurred in over 70% of the sample. Muscle strength (MS) appears to be an interesting marker of the presence of malnutrition, because it conditions poorer results in the physical quality of life scale, which was one of the most affected dimensions from the start. A weight loss greater than 10% over the previous 6 months has been shown to be an independent mortality factor,13 and MS is independently associated with survival and quality of life in cancer patients.14 Consequently, these are the anthropometric variables that should be included in standard clinical practice. With regard to the biochemical and hematological parameters, it should be noted that over 80% of the sample had serum albumin, prealbumin and visceral protein levels within normal ranges, though moderately malnourished patients had albumin levels lower than well-nourished patients. Tyrosine kinase inhibitors were not found to significantly affect the evaluated parameters, and their safety is therefore warranted in this context.
In relation to the dietary changes in these patients, it should be noted that there were different perceptions of the change in the usual amount of food intake before the start of TKI treatment. This may be due to multiple causes, such as alterations in automatic palatability response and food reward,15 or the location of the tumour.16 In our study, maintaining a sensation of appetite was seen to be related to the preservation of an adequate nutritional status. However, the median calorie and protein intake before the start of therapy was below the recommendations of the European Society for Clinical Nutrition and Metabolism (ESPEN).17 In addition, since there was no individualized nutritional intervention during follow-up, deficient intake did not undergo significant changes. This could have influenced the differences in the survival rate found between well nourished and moderately malnourished patients, because energy and protein consumption below 50% of the requirements increases mortality at 6 months.18 In fact, recent studies have shown that an increase in nutritional risk prior to treatment may be associated with a decreased survival rate.19,20 Thus, in the context of dietary and nutritional management, the number of meals should be taken into consideration, for although the predominant number was 3–4 meals a day and is similar to the data recorded in other studies,21 our results indicated that the number of meals should be increased to more than 5 in order to facilitate compliance with energy requirements. In addition, it is advisable to insist on the consumption of sufficient food with high biological value protein such as egg white, white and blue fish, or poultry with no skin or visible fat, which may be added to first vegetable dishes as a complement, and should be present daily as second dishes in these patients in order to cover their protein requirements.
With regard to the methodological considerations, it should be taken into account that the R24h is based on subjective data, and may overestimate or underestimate intake. Nevertheless, in cancer patients it appears to be an adequate tool for calorie and protein analysis.22 The distribution of energy intake in the macronutrients of our study sample differs slightly from that described elsewhere (carbohydrates: 50–56%; fats: 25–30% of the total energy),18 since carbohydrates did not reach 45% of the energy supply, and dietary fibre consumption was less than 30g per day in over 90% of the patients. In addition, calorie compensation appeared to occur at the expense of greater fat consumption (39%), which means that a third of the study sample consumed cholesterol in amounts above 300mg daily. These excesses or deficiencies in dietary components were related to pathological changes in the lipid profile. To control dietary cholesterol intake, it is advisable to restrict the consumption of fatty cheeses, butter and cream, and of sauces which contain them, as well as of mayonnaise and commercially produced pastries, and to eliminate fatty meat (bacon, lard, cold meats, etc.). Likewise, whole egg intake should not exceed four weekly servings. On the other hand, a daily intake of three servings of fruit, two of vegetables and 5 of cereals, as well as legumes 3–4 times a week, will help secure adequate fibre intake.
Patient quality of life was examined throughout our study because impaired nutritional status is reportedly one of the factors that most influence quality of life.23 The most common symptoms at the start of the study were fatigue, pain, and changes in appetite.24 Such changes are common during cancer treatments. During follow-up, the patients did not experience major changes, but diarrhea increased in more than one third of them, probably as a result of damage caused to the intestinal mucosa and colon, which also results in excess fluid secretion into the intestinal lumen. The presence of nausea or vomiting did not increase as in other studies, where these symptoms were noted in up to over 40% of the population.25 It would be useful to inform the patients at the start of TKI therapy of the probability of diarrhea as a side effect, and to facilitate dietary and hydration management so that they know what to do if diarrhea occurs. The stability of the quality of life scales during follow-up reveals good treatment tolerance and good survival prognosis,26 though it has also been observed that the absence of nutritional intervention can condition treatment tolerance and quality of life.27
Regarding the possible limitations of our study, it should be taken into account that agreeing to participate in the study indicates an interest or concern about health that could condition the results due to the Hawthorne effect.28 Furthermore, the study of intake is conditioned by the variations in the techniques used in diet calibration programs.29 However, the use of different methods to assess nutritional status means that our study has given us the opportunity to propose practical approaches to decision-making. Moreover, although the patient sample was small, the results indicate that TKIs do not appear to negatively influence nutritional status, and that dietary intake in the cancer population is quantitatively and qualitatively affected before treatment is started.
Our study offers potential dietary recommendations for preventing patients from having deficient diets, based on the existing scientific evidence. It seems opportune to develop an informative document for patients starting TKI treatment, emphasizing the importance of eating at least 5 meals a day, the need to consume protein foods but with a low cholesterol content, and the importance of an adequate intake of vegetables, fruit, legumes and cereals, even prior to the start of any kind of treatment. Our results reflect how impaired nutritional status may lead to differences in survival. Thus, there is a need to reinforce the presence of dietetic and nutritional professionals before, during and after cancer treatment as part of the multidisciplinary team, making them accessible to all, even to those undergoing apparently scantly aggressive therapies at the nutritional level, since doing so can improve patient quality of life.30
Conflicts of interestThe authors state that they have no conflicts of interest.
Please cite this article as: Higuera-Pulgar I, Ribed A, Carrascal-Fabian ML, Romero-Jiménez RM, Velasco-Gimeno C, Bretón-Lesmes I, et al. Evolución nutricional y de la supervivencia en un grupo de pacientes oncológicos en tratamiento con inhibidores de tirosina quinasa. Endocrinol Diabetes Nutr. 2019;66:472–479.
