


Disease-related malnutrition (DRM) is highly prevalent in Spanish hospitals (occurring in one out of every four patients). The ‘Más Nutridos’ Alliance has developed an action plan to detect and treat DRM. In Extremadura (Spain), the public health system has included nutritional screening as the only mechanism to fight malnutrition. The results of this strategy are evaluated here.
Patients and methodsAn agreement study was conducted in standard clinical practice. Variables collected included the following rates: nutritional screening at entry, coded nutritional diagnoses, nutritional status assessment, nutritional requirements, successful nutritional therapy, weight and height at entry and discharge, referral to a nutritional support unit (NSU). Standards to comparison based on the results of the Netherland Program to Fight Malnutrition.
ResultsNutritional screening rate at entry was 20.5% (95% CI: 18.00–21.00). Coding and nutritional status assessment rate at entry was 13%. Weight and height were both measured in 16.5% of patients at entry and 20% at discharge. Nutritional requirements were estimated in 30% and were poorly monitored (13.3%). Only 15% of patients were referred to an NSU. Significantly lower values were found for all indicators as compared to standards, with kappa values lower than 0.2 in all cases. Data analysis showed poorer results when patients referred to the NSU were excluded.
ConclusionsA strategy to fight malnutrition based on nutritional screening alone is highly inefficient in hospitals such as HVP.
La desnutrición relacionada con la enfermedad (DRE) es una enfermedad con alta prevalencia en el medio hospitalario español (uno de cada 4 pacientes). La alianza «Más Nutridos» ha desarrollado un plan de acción para combatir esta entidad. El Sistema Extremeño de Salud ha incluido el cribado nutricional como único paso para luchar contra la DRE. Se realiza una evaluación de los resultados obtenidos por esta estrategia.
Pacientes y métodosEstudio de concordancia en condiciones de práctica clínica habitual estudiando los siguientes indicadores: tasa de cribado nutricional, tasa de diagnósticos nutricionales codificados, tasa de pacientes con valoración del estado nutricional (VEN), tasa de pacientes con cálculo de requerimientos en función de la situación clínica y el estado nutricional, tasa de pacientes con cumplimiento de requerimientos calóricos y proteicos estimados, tasa de pacientes con peso al ingreso, tasa de pacientes con talla al ingreso, tasa de pacientes con peso al alta, tasa de pacientes derivados a la Unidad de Nutrición Clínica y Dietética (UNCYD). Se comparan con los datos obtenidos por el programa de lucha contra la desnutrición en Holanda, que se utilizaron como estándares.
ResultadosLa tasa de cribado nutricional ascendió al 20,5% (IC95: 18,00-21,00%). La tasa de codificación y de valoración del estado nutricional al ingreso fue del 13%. El peso se determinó en el 16,5% de los pacientes al ingreso y en el 20% al alta (mismo resultado para talla). En el 30% se realizó un cálculo de requerimientos, que no fue prácticamente monitorizado (4 de 30 pacientes). Solo el 15% de los pacientes fueron derivados a la UNCYD. Todos los indicadores obtuvieron valores significativamente inferiores a los estándares (p<0,05), con valores de κ que en todo caso fueron inferiores a 0,2. El análisis ofreció resultados peores tras suprimir los pacientes atendidos por la UNCYD.
ConclusionesUna estrategia integral de detección y tratamiento de desnutrición propuesta por el Sistema Extremeño de Salud basada solamente en un cribado nutricional es ineficiente a todos los efectos en un hospital de las características del HVP.
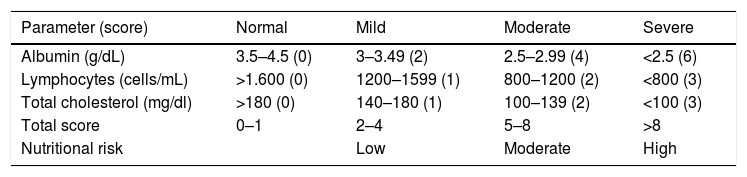
Disease-related malnutrition (DRM) is highly prevalent in Spain, affecting one out of every four hospitalized patients according to the PREDyCES study.1 The detection and management of DRM is cost-effective in every respect, though it is often underdiagnosed and underestimated by healthcare staff, and usually does not receive adequate treatment.2 In Spain, a number of scientific bodies and professionals have promoted the ‘Better Nurtured’ alliance,3 which aims at promoting awareness of and the inclusion of malnutrition among the national and regional health strategies; at creating communication initiatives and hospital divulgation programs based on scientific evidence, including screening at all healthcare and state and regional government levels; and at supporting clinicians in their collaboration in malnutrition processes in the hospital setting. In order to reach these goals, they have developed an action plan that is detailed on their website.4 Beginning in 2017, as part of the 2013–2020 Extremadura Health Plan,5 a universal electronic screening program (the CONUT method) was implemented at Hospital Virgen del Puerto (Plasencia, Spain).6 This method crosses a number of laboratory test parameters with the demographic databases of patients hospitalized due to any cause in the hospital. It offers a sensitivity of 92.3%, a positive predictive value of 94.1% and a specificity of 91.2%, with a kappa coefficient (κ) of 0.831 compared with the nutritional assessment gold standard.7 The assessment algorithm assigns a score according to albumin, lymphocyte and total cholesterol values with the purpose of stratifying nutritional risk as low, moderate or high. The algorithm is shown in Table 1. However, after screening, no subsequent action strategy is implemented by the institution, the physician in charge of the patient being left to decide the required approach in individuals defined as being at nutritional risk according to the abovementioned method.
The CONUT method.
| Parameter (score) | Normal | Mild | Moderate | Severe |
|---|---|---|---|---|
| Albumin (g/dL) | 3.5–4.5 (0) | 3–3.49 (2) | 2.5–2.99 (4) | <2.5 (6) |
| Lymphocytes (cells/mL) | >1.600 (0) | 1200–1599 (1) | 800–1200 (2) | <800 (3) |
| Total cholesterol (mg/dl) | >180 (0) | 140–180 (1) | 100–139 (2) | <100 (3) |
| Total score | 0–1 | 2–4 | 5–8 | >8 |
| Nutritional risk | Low | Moderate | High |
Source: Ulibarri et al.6
The aim of the study was to determine whether the isolated implementation of an electronic method for screening nutritional status is able to improve nutritional care as measured by different quality indicators.
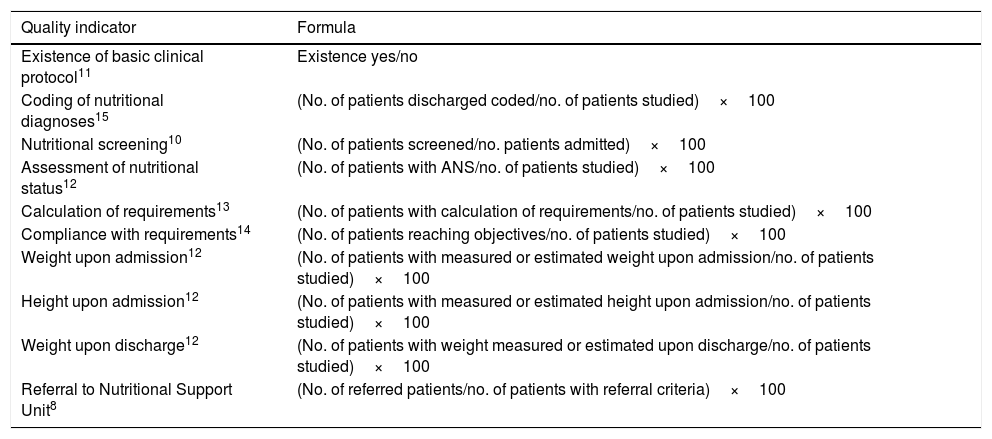
Material and methodsType of studyA concordance study was planned under conditions of standard clinical practice, to investigate the following quality indicators regarding the screening process and the type of nutritional support established in patients with DRM: the nutritional screening rate, the coded nutritional diagnostic rate, the proportion of patients given an assessment of their nutritional status (ANS), the proportion of patients receiving a calculation of their requirements based on their clinical condition and nutritional status, the proportion of patients meeting their estimated calorie and protein requirements, the proportion of patients who had their weight measured upon admission, the proportion of patients who had their height measured upon admission, and the proportion of patients referred to the Nutritional Support Unit (NSU). The formulas for each of the parameters are detailed in Table 2, and the criteria for referral to the NSU are specified in Table 3.
Formulas for calculating the different quality indicators studied.
| Quality indicator | Formula |
|---|---|
| Existence of basic clinical protocol11 | Existence yes/no |
| Coding of nutritional diagnoses15 | (No. of patients discharged coded/no. of patients studied)×100 |
| Nutritional screening10 | (No. of patients screened/no. patients admitted)×100 |
| Assessment of nutritional status12 | (No. of patients with ANS/no. of patients studied)×100 |
| Calculation of requirements13 | (No. of patients with calculation of requirements/no. of patients studied)×100 |
| Compliance with requirements14 | (No. of patients reaching objectives/no. of patients studied)×100 |
| Weight upon admission12 | (No. of patients with measured or estimated weight upon admission/no. of patients studied)×100 |
| Height upon admission12 | (No. of patients with measured or estimated height upon admission/no. of patients studied)×100 |
| Weight upon discharge12 | (No. of patients with weight measured or estimated upon discharge/no. of patients studied)×100 |
| Referral to Nutritional Support Unit8 | (No. of referred patients/no. of patients with referral criteria)×100 |
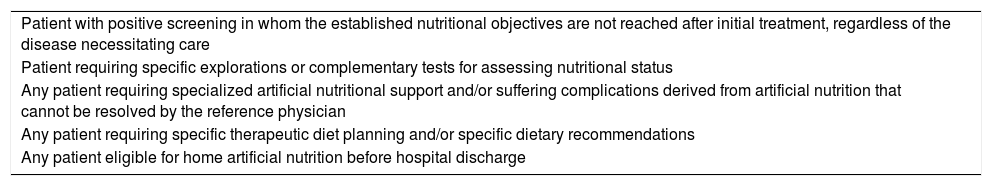
Criteria for referral to the Nutritional Support Unit.
| Patient with positive screening in whom the established nutritional objectives are not reached after initial treatment, regardless of the disease necessitating care |
| Patient requiring specific explorations or complementary tests for assessing nutritional status |
| Any patient requiring specialized artificial nutritional support and/or suffering complications derived from artificial nutrition that cannot be resolved by the reference physician |
| Any patient requiring specific therapeutic diet planning and/or specific dietary recommendations |
| Any patient eligible for home artificial nutrition before hospital discharge |
Source: Nutrición Clínica y Dietética. Junta de Andalucía. Consejería de Salud8.
In order to calculate the screening rate with 95% confidence and a precision of 5%, a sample size of 384 patients was estimated, taking into account that the nutritional screening rate in our center is not known. An estimated percentage of 50% was therefore applied to maximize the sample size.
In addition, using nutritional diagnostic coding as the only accessible indicator prior to the introduction of screening, the percentage of patients diagnosed with DRM in 2015 was requested from the Coding Unit of the center and was found to be 2.3%. Using the prevalence of DRM estimated by the PREDyCES study (23.7%)1, a sample of 30 patients (95% confidence level, 80% statistical power) was considered necessary to determine whether there were significant differences in coding DRM. This sample size was extrapolated to the calculation of the other indicators, in view of the difficulty of obtaining such data, since they are not routinely recorded.
ProcedureDuring the period February–August 2017, we reviewed a total of 500 patients consecutively screened in the first 48h after admission, from which a random sample of 384 patients was taken using the SPSS version 20 statistical package for this purpose. The software analyzed all patients and classified them as indeterminate when nutritional risk could not be established due to a lack of laboratory parameters and assigned nutritional risk according to the CONUT method when these parameters were available.
We also reviewed 30 clinical histories of patients assessed as being at high malnutrition risk upon admission according to the CONUT method (over 9 points), in which a nutritional risk was expressly reported in the history. In order to obtain a randomized sample, we only reviewed the clinical histories of those patients who met the abovementioned criteria and were screened one day per week of each week until the estimated sample size was reached. Patients with this score upon admission were estimated to have the criteria for receiving specialized nutritional support, given the high positive predictive value of the scores in diagnosing malnutrition. The following data were collected: age, gender, mean length of stay, disease upon admission, the department of admission, the existence of a nutritional support protocol in the department of admission, and the assessment of nutritional status based on a structured method 48h after nutritional risk was reported. Likewise, information was compiled regarding the calculation of the patient's requirements, compliance with these requirements, weight measurement or estimation upon admission and discharge, height upon admission, the coding of nutritional diagnoses in the discharge report, and the criteria for referral to the Nutrition Unit based on the document “Clinical Nutrition Process” of the Andalusian Health Service.8 In turn, if referral occurred, we documented whether it took place in the first 48h after admission.
The standards for comparison were as follows: regarding the proportion of patients screened in the first 48h following admission9: 80% (as has been achieved in the Netherlands under their national strategy against malnutrition, this being the most developed and implemented strategy, one which provides an updating of its data on prevalence and the costs associated with DRM in that country, as well as of the objectives reached in clinical terms after the application of the nutritional strategy10); regarding the existence of a basic clinical protocol: yes11; regarding the proportion of patients receiving an ANS in the first 48h after a positive screening: 80%12; regarding weight and height in the first 48h after admission, or their estimation: 80%12; regarding the calculation of the estimated requirements in the first 48h after admission: 80%13; regarding compliance with the estimated requirements14: 41% (relating to compliance with the protein requirements reached on the fourth day of admission in the Dutch program against malnutrition10); and regarding the coding of nutritional diagnoses in the discharge report: 80% (weight or estimated weight in the discharge report12: 80%). In order to evaluate the criteria for referral to the Nutrition Unit of the center, we used those defined in the “Clinical Nutrition Process” of the Andalusian Health Service (see Table 3)8, and a standard of 80% was used to assess the process of patient referral to the Nutrition Unit according to the defined criteria.
Statistical analysisThe statistical analysis was performed using the SPSS version 20 statistical package for MS Windows (SPSS Inc., Chicago, IL, USA). The Kolmogorov–Smirnov test was used to establish whether quantitative variables exhibited a normal distribution or not.
Quantitative variables were reported as the mean and standard deviation (SD) in the case of a normal distribution and as the median and interquartile range (IQR) if otherwise. Qualitative variables were reported as percentages.
The McNemar–Kappa test was used to determine differences in reaching the quality criteria in the previously described standards. Statistical significance was considered for P<0.05.
ResultsThe screening rate results were analyzed first. Analysis of the randomized sample of 384 patients showed 77 individuals to present a conclusive result in the screening test and all other results were reported as error or indeterminate. The nutritional screening rate upon admission was 20.50% (95%CI: 18.0–22.0). This rate was compared to the chosen standard, which proved to be significantly lower (P<0.001), with a κ statistic of 0.12.
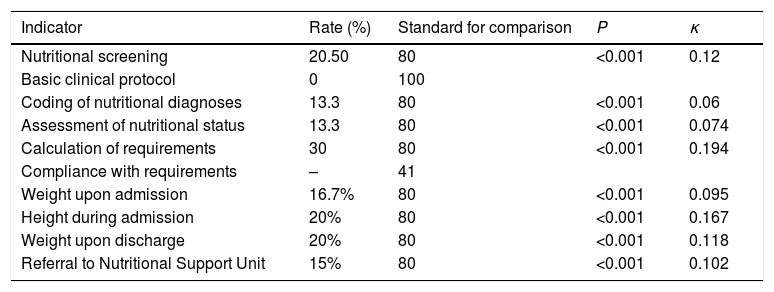
On the other hand, 30 clinical histories with a high-risk CONUT score upon admission were reviewed during the abovementioned period. These histories corresponded to 20 males (66.7%) and 10 females (33.3%). The mean cohort age was 71.6±28.24 years, and the median length of stay was 11.5 days (range 5.5–21 days). The patients studied came from 10 different departments or sections, though virtually 50% of them were admitted to Internal Medicine or Geriatrics and 20% to surgical departments. The reasons for admission were diverse—the primary reasons being infectious disease (20%)—with no relevant differences between cardiovascular, oncological, surgical, gastrointestinal, endocrine-metabolic or respiratory disorders (10–13.3% each). With regard to the DRM or related diagnoses coding rate reflected in the discharge report, only 4 out of 30 patients (13.3%) had such a diagnosis. Compared to the established standard (80%), this difference was statistically significant (P<0.001), with a κ statistic of 0.06. The ANS 48h following a positive screening was only documented in four of the 30 patients (13.3%). The difference with respect to the standard (80%) again proved to be statistically significant (P<0.001) with a κ value of 0.074. The requirements calculation rate was 30% (9/30), and lower than the proposed standard (P<0.001; κ=0.194). Data regarding the requirements reached at one timepoint or more during admission were available for only 6 patients (20%), so that no reliable information concerning this indicator could be obtained. Precise determination or estimation of body weight occurred in 5 patients upon admission, with a rate of 16.7%. By comparison, the standard rate for this indicator was 80% (P<0.001; κ=0.095). Weight at discharge was recorded in 6 patients (20%). The rates regarding estimated or calculated patient height and referral to the NSU were 26.7% and 15%, respectively. The results of the different indicators, standards, statistical significance and the value of the κ statistic are summarized in Table 4. The same indicators were subsequently re-evaluated, except for the nutritional screening indicator, with the patients that were referred to the NSU being excluded (4 patients in total). Table 5 shows the values of the indicators in this substudy.
Results of the studied quality indicators.
| Indicator | Rate (%) | Standard for comparison | P | κ |
|---|---|---|---|---|
| Nutritional screening | 20.50 | 80 | <0.001 | 0.12 |
| Basic clinical protocol | 0 | 100 | ||
| Coding of nutritional diagnoses | 13.3 | 80 | <0.001 | 0.06 |
| Assessment of nutritional status | 13.3 | 80 | <0.001 | 0.074 |
| Calculation of requirements | 30 | 80 | <0.001 | 0.194 |
| Compliance with requirements | – | 41 | ||
| Weight upon admission | 16.7% | 80 | <0.001 | 0.095 |
| Height during admission | 20% | 80 | <0.001 | 0.167 |
| Weight upon discharge | 20% | 80 | <0.001 | 0.118 |
| Referral to Nutritional Support Unit | 15% | 80 | <0.001 | 0.102 |
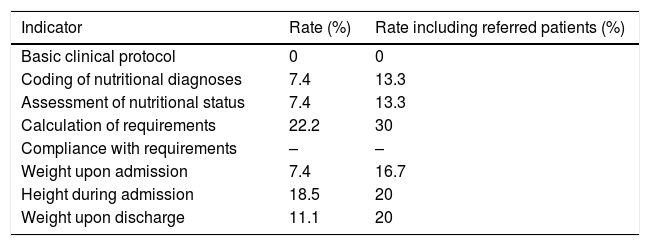
Results of the quality indicators after excluding patients seen in the Nutritional Support Unit.
| Indicator | Rate (%) | Rate including referred patients (%) |
|---|---|---|
| Basic clinical protocol | 0 | 0 |
| Coding of nutritional diagnoses | 7.4 | 13.3 |
| Assessment of nutritional status | 7.4 | 13.3 |
| Calculation of requirements | 22.2 | 30 |
| Compliance with requirements | – | – |
| Weight upon admission | 7.4 | 16.7 |
| Height during admission | 18.5 | 20 |
| Weight upon discharge | 11.1 | 20 |
The results based on the experience of the Dutch program against malnutrition (a decrease of 1.5–4 days in hospital stay in patients with malnutrition criteria upon admission using the SNAQ tool) were obtained after reaching the protein requirements on the fourth day of hospital admission, defined as 1.2–1.7g protein per kilogram body weight per day. For this effect an adequate ANS has to be performed, the estimated requirements being calculated and then being monitored in order that the nutritional support plan can be modified when these objectives cannot be reached. For this reason, the quality indicators related to the ANS, anthropometric assessment and calculation and compliance with the requirements were chosen with a view to evaluating the process from a clinical point of view. Compliance guarantees that the estimated requirements can be met, resulting in a shortened mean stay, among other benefits. The decision was made to set the standard value at 80% (the proportion of patients screened and assessed under the Dutch strategy), except for the reaching of requirements, which was defined as 41% in accordance with the Dutch case. The results obtained in our study fall far short of these values and become even lower after the exclusion of those patients assisted by the NSU of the center. The analysis of the values obtained for the κ-statistic shows a very poor concordance between the recommended clinical-nutritional approach and that actually adopted by the teams caring for the patient. This occurred despite their having been informed regarding the considerable nutritional risk and the high pre-test probability of malnutrition among the patients. This confirms the evidence in the literature reflecting the scant relevance given to DRM by some healthcare professionals, as compared to obesity.3
On the other hand, the coding rate likewise did not show acceptable values. The importance of this indicator lies not only in its influence when epidemiological studies are being conducted, but also in its ability to modify the Case-Mix index, which is one of the tools used by the management to determine the distribution of economic resources. Examples of this are shown in different studies of our group.16–18
In the final analysis, the screening rate shows unacceptable values for a process that is intended to be universal. We therefore consider that the screening method introduced is not consistent with standard clinical practice in the center and should be revised by those responsible for its implementation.
Thus, the institutional strategy regarding the implementation of an electronic nutritional screening system is insufficient, since it failed to obtain significant results for any of the studied indicators. This has also been reported in the literature19: nutritional strategies do not improve with only isolated nutritional screening. Analysis of the Dutch case shows that its results - which have been found to be highly cost-effective and to require minimum investment - have been obtained by the adoption of a careful approach based on different factors, of which screening represents only one of the necessary requirements. In effect, the Dutch experience also relies on the involvement of the policy makers; the creation of multidisciplinary teams with a dietician, a nurse and a physician for each area; training programs; and the collection of data on the prevalence and efficacy of nutritional support.10
ConclusionsAutomated nutritional screening alone, as part of a nutritional care policy in the healthcare setting, is not effective in improving quality indicators of the nutritional support process in centers which have the characteristics of Hospital Virgen del Puerto (Plasencia, Spain).
Conflicts of interestThe authors declare that they have no conflicts of interest.
Please cite this article as: Morán López JM, Hernández González M, Peñalver Talavera D, Peralta Watt M, Temprano Ferreras JL, Redondo Llorente C, et al. Evaluación del proceso de soporte nutricional en un hospital comarcal. Endocrinol Diabetes Nutr. 2018;65:348–353.
