


The objective of this work was to define a value for the 99th percentile of high-sensitive troponin T and to evaluate the prognostic value of this biomarker in a population of patients with type 2 diabetes without a history of cardiovascular disease.
MethodsIn this prospective, observational and analytic study, 482 patients with type 2 diabetes were enrolled. The patients were asymptomatic, with no history of cardiovascular events, renal insufficiency, or inflammatory or systemic disease. As events we considered a combined end point of major adverse cardiovascular events (MACE).
Results94.9% of the patients had detectable troponin values, 20.7% of the patients had troponin values above the healthy population reference upper threshold (14pg/mL). The 99th percentile value for this patient population was 48pg/mL. Age, sex, the glomerular filtration rate and hypertension were associated with troponin values>14pg/mL. The incidence of MACE was 3.96 per 100 patients/year (p/y) between those with hs-TnT>14pg/mL and 1.07 per 100 p/y between those with hs-TnT≤14pg/mL (HR=3.78 CI95 1.49–9.58; p=0.005).
ConclusionsThe 99th percentile value of troponin T in a population of patients with type 2 diabetes is 3-fold higher than the value proposed by the manufacturer for a healthy population. We also observed a significant difference in the distribution of troponin T values between men and women. This biomarker may be a valuable prognostic factor, since troponin T values above the reference upper threshold were associated with an increase in the risk of cardiovascular events in these patients.
Definir un valor para el percentil 99 de la troponina T ultrasensible (TnTus) y evaluar el valor pronóstico de este biomarcador en una población de pacientes con diabetes tipo 2 sin antecedentes cardiovasculares.
MétodosSe incluyeron en este estudio prospectivo, observacional y analítico 482 pacientes con diabetes tipo 2. No tenían síntomas ni antecedentes de episodios cardiovasculares, insuficiencia renal ni enfermedad inflamatoria o sistémica. Consideramos como episodios un criterio de valoración combinado de episodios cardiovasculares adversos importantes (ECAI).
ResultadosEl 94,9% de los pacientes tenían valores de troponina detectable, el 20,7% tenían valores de troponina por encima del umbral superior de referencia de la población sana (14pg/mL). El percentil 99 de esta población de pacientes era de 48pg/mL. La edad, el sexo, la filtración glomerular y la hipertensión se asociaban con valores de troponina >14pg/mL. La incidencia de ECAI era de 3,96 por 100 pacientes/año (p/a) entre los que tenían >14pg/mL de TnTus y 1,07 por 100p/a en los que tenían ≤14pg/mL de TnTus (HR=3,78; IC 95%: 1,49-9,58; p=0,005).
ConclusionesEl valor del percentil 99 de la troponina T en una población de pacientes con diabetes tipo 2 es 3 veces mayor que el propuesto por el fabricante para una población sana. Se observó también una diferencia significativa en la distribución de los valores de troponina T entre varones y mujeres. Este biomarcador puede ser un factor diagnóstico valioso, ya que los valores de troponina T por encima del umbral superior de referencia se asociaban con aumento del riesgo de episodios cardiovasculares en estos pacientes.
Cardiac troponins (cTn I and T) are used as both diagnostic and prognostic biomarkers of cardiac injury, because of the damage produced to cardiomyocytes leads to cTn release and thus a rise in blood concentration.1 The use of cardiac troponins as biomarkers for acute coronary syndrome (ACS) began in the early 1990s. The original diagnostic assay was further developed to gain higher sensitivity with each iteration.2 Since the first radioimmunoassay for cTn I in 1987, new methodologies were developed in order to improve diagnostic sensitivity allowing for the detection of very low levels of circulating cTn. The current assays are termed high-sensitive troponin (hs-cTn).3 According to the recommendations of the International Federation of Clinical Chemistry and Laboratory Medicine task force on clinical applications of cardiac biomarkers, to qualify as high-sensitive, an assay must detect cTn in over 50% of healthy subjects.4 However, this recommendation led to a reduction of assay specificity, because cTn were detectable in patients without heart damage due to acute myocardial infarction (AMI).5
Because the diagnosis of ACS relies heavily on the troponin values, it is crucial to establish precise reference limits to evaluate hs-cTn results.1,6 It has been proposed as reference range for the analysis of hs-cTn the 99th percentile of the healthy population.6 However, there are still aspects of this proposal that require further debate: First, the “healthy population” used in the studies to determine the reference values is poorly defined. Second, a segregation based on sex and age is needed.7–9 Third, differences in circulating cTn levels may exist among different groups of patients. Specifically, it has been shown that the increased glucose levels in patients with type 2 diabetes lead to coronary microvascular dysfunction and myocardial injury, due to cellular oxidative stress.10–12 This progressive myocardial damage at a sub-clinical stage of cardiovascular disease leads higher values of circulating cTn than the healthy population, even in the absence of ACS.12
The objective of this study was to define the value of the 99th percentile for high-sensitive troponin T (hs-TnT) and to determine its prognostic value as biomarker in a population of patients with type 2 diabetes without cardiovascular history.
Materials and methodsResearch methodology and study populationThis is an observational, analytical study with a prospective cohort of 482 asymptomatic patients with diagnosis of type 2 diabetes without history of cardiovascular disease, renal insufficiency, inflammatory or systemic disease. Serum samples for measuring hs-TnT levels were obtained during routine patient controls, within the period between the years 2013 and 2017. This study was approved by the Ethics Committee for Research Protocols of the Hospital Italiano de Buenos Aires.
Recruitment criteria were the following
Inclusion criteria: patients over 18 years of age with a diagnosis of type 2 diabetes (according the American Diabetes Association).13
Exclusion criteria: glomerular filtration rate<60mL/min/1.73m2, according the CKD-EPI formula; history of angina pectoris, acute coronary syndrome, myocardial revascularization, peripheral vascular disease, severe valvular disease, clinical heart failure, known left ventricle systolic dysfunction with an ejection fraction below 35%, current or known history of atrial fibrillation, clinically manifest inflammatory disease, acute illness, anemia or known neoplasms.
Laboratory methodologySerum samples were obtained through conventional extraction and immediate centrifugation. An aliquot was stored at −70°C until further processing. hs-TnT measurements were performed using the electrochemiluminescence assay Elecsys Troponin T hs STAT (Roche) and a COBAS e601 analyzer. The analytic sensibility of this method is 3pg/mL (lower measurable concentration). As a reference value, the manufacturer proposes the use of the 99th percentile of the healthy population (14pg/mL) which was verified in our laboratory for this system. The coefficient of variation (CV%) of this methodology is 1.8% for the level 1 (mean of control 1=29pg/mL) and 1.3% for the level 2 (mean of control 2=2078pg/mL). Glucose and creatinine measurements were performed using AU-5800 instruments (Beckman Coulter) via the UV-hexokinase method and the kinetic reaction (Jaffé) respectively. HbA1 measurement was performed via HPLC using a Variant II Turbo system.
Follow-up and event recordingWe considered as final combined event an event comprised by death, ACS or stroke. The events were determined by manual systematic evaluation of the clinical electronic history of each of the patients. Patients were followed until the occurrence of a first event or until the last medical control recorded in the clinical history or until September 2017.
Statistical analysisThe statistical analysis was performed using the Stata V13.1 software (StataCorp. TX). Continuous variables are described as mean±standard deviation when presenting a normal distribution or as median and interquartile range if the distribution was non-parametric. Analyses performed comprised Student's T tests or Wilcoxon rank sum test for normal or non-parametric distributions, respectively. Qualitative variables are shown as number and frequency and were analyzed by chi2 or Fisher depending on the sample size. A multivariate analysis in order to predict troponin values above the reference limit was performed using logistic regression including all variables that resulted in statistically significant changes in univariate analyses (p≤0.05). The OR coefficients, 95% confidence intervals and statistical significance (p) were determined.
For the survival analysis, two groups were separated based on the basal troponin levels being below or above the reference threshold established by the manufacturer. A Cox proportional risk model was used and a Kaplan–Meier survival study was performed to establish the relationship between the basal troponin levels and major cardiovascular event incidence.
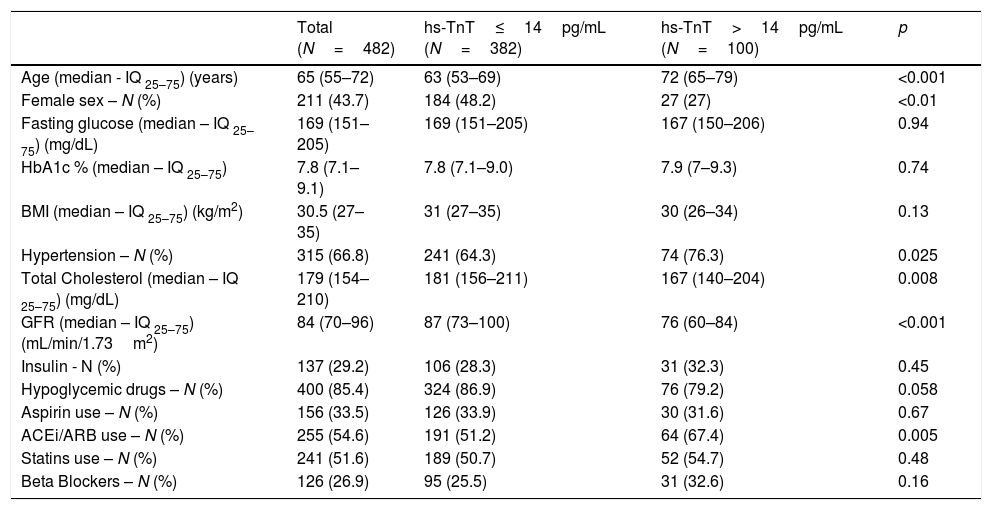
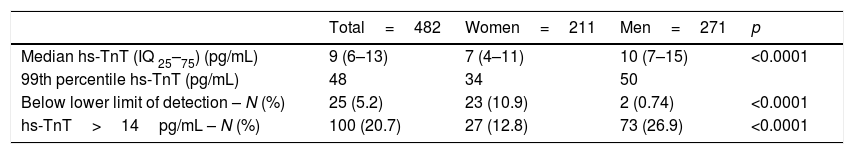
Results482 patients with type 2 diabetes were enrolled, with no history of cardiovascular disease and with conserved renal function. The basal characteristics of the population are described in Table 1. The median age of the population was 65 (iq25–75: 55–72) years, with 44% female and 56% male. Median serum troponin level was 9 (iq25–75: 6–13) pg/mL. 94.9% of patients showed measurable serum troponin levels, and 20.7% of patients showed a serum hs-TnT level above the reference upper threshold established by the manufacturer. The 99th percentile was 48pg/mL. Women showed serum troponin levels significantly lower than men (Table 2).
Population characteristics according to the presence of hs-TnT ≤ or >14pg/mL.
| Total (N=482) | hs-TnT≤14pg/mL (N=382) | hs-TnT>14pg/mL (N=100) | p | |
|---|---|---|---|---|
| Age (median - IQ 25–75) (years) | 65 (55–72) | 63 (53–69) | 72 (65–79) | <0.001 |
| Female sex – N (%) | 211 (43.7) | 184 (48.2) | 27 (27) | <0.01 |
| Fasting glucose (median – IQ 25–75) (mg/dL) | 169 (151–205) | 169 (151–205) | 167 (150–206) | 0.94 |
| HbA1c % (median – IQ 25–75) | 7.8 (7.1–9.1) | 7.8 (7.1–9.0) | 7.9 (7–9.3) | 0.74 |
| BMI (median – IQ 25–75) (kg/m2) | 30.5 (27–35) | 31 (27–35) | 30 (26–34) | 0.13 |
| Hypertension – N (%) | 315 (66.8) | 241 (64.3) | 74 (76.3) | 0.025 |
| Total Cholesterol (median – IQ 25–75) (mg/dL) | 179 (154–210) | 181 (156–211) | 167 (140–204) | 0.008 |
| GFR (median – IQ 25–75) (mL/min/1.73m2) | 84 (70–96) | 87 (73–100) | 76 (60–84) | <0.001 |
| Insulin - N (%) | 137 (29.2) | 106 (28.3) | 31 (32.3) | 0.45 |
| Hypoglycemic drugs – N (%) | 400 (85.4) | 324 (86.9) | 76 (79.2) | 0.058 |
| Aspirin use – N (%) | 156 (33.5) | 126 (33.9) | 30 (31.6) | 0.67 |
| ACEi/ARB use – N (%) | 255 (54.6) | 191 (51.2) | 64 (67.4) | 0.005 |
| Statins use – N (%) | 241 (51.6) | 189 (50.7) | 52 (54.7) | 0.48 |
| Beta Blockers – N (%) | 126 (26.9) | 95 (25.5) | 31 (32.6) | 0.16 |
GFR: glomerular filtration rate; HbA1c: glycated hemoglobin A1c; BMI: body mass index; ACEi: angiotensin-converting enzyme inhibitors; ARB: angiotensine II receptor blockers.
Distribution of hs-TnT values by sex.
| Total=482 | Women=211 | Men=271 | p | |
|---|---|---|---|---|
| Median hs-TnT (IQ 25–75) (pg/mL) | 9 (6–13) | 7 (4–11) | 10 (7–15) | <0.0001 |
| 99th percentile hs-TnT (pg/mL) | 48 | 34 | 50 | |
| Below lower limit of detection – N (%) | 25 (5.2) | 23 (10.9) | 2 (0.74) | <0.0001 |
| hs-TnT>14pg/mL – N (%) | 100 (20.7) | 27 (12.8) | 73 (26.9) | <0.0001 |
Age, sex, glomerular filtration rate, and a diagnosis of hypertension (HT) were associated with positive troponin levels (>14pg/mL). A progressive increase in troponin levels was observed with age and with reduced glomerular filtration rate. Neither fasting glucose or glycosylated hemoglobin, or body mass index, were correlated with serum troponin levels. The patients with positive troponin levels showed lower levels of total cholesterol than those with negative troponin levels (172±44 vs 185±39mg/dL; p=0.0071).
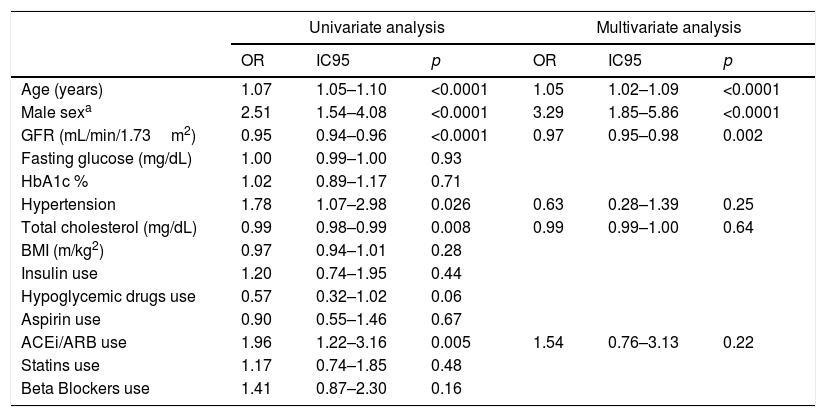
Even though no differences were observed with the use of statins, it is not known the strength and quantity levels of each treatment. We did not find significant differences in the rate of use of insulin, oral hypoglycemic medications, aspirin or beta blockers. We observed a significant increase in the rate of use of angiotensin-converting enzyme inhibitors (ACEi) or angiotensine II receptor blockers (ARB) in patients with positive troponin values. This finding is consistent with an increased prevalence of hypertension among patients with positive troponin. We performed a multivariate logistic regression analysis with elevated troponin (>14pg/mL) as dependent variable for all other variables that were significantly associated (p<0.05) with troponin levels in all univariate tests. Only increased age, male gender, and lower glomerular filtration rate were significantly associated with elevated troponin levels (Table 3).
Characteristics associated with the elevation of hs-TnT.
| Univariate analysis | Multivariate analysis | |||||
|---|---|---|---|---|---|---|
| OR | IC95 | p | OR | IC95 | p | |
| Age (years) | 1.07 | 1.05–1.10 | <0.0001 | 1.05 | 1.02–1.09 | <0.0001 |
| Male sexa | 2.51 | 1.54–4.08 | <0.0001 | 3.29 | 1.85–5.86 | <0.0001 |
| GFR (mL/min/1.73m2) | 0.95 | 0.94–0.96 | <0.0001 | 0.97 | 0.95–0.98 | 0.002 |
| Fasting glucose (mg/dL) | 1.00 | 0.99–1.00 | 0.93 | |||
| HbA1c % | 1.02 | 0.89–1.17 | 0.71 | |||
| Hypertension | 1.78 | 1.07–2.98 | 0.026 | 0.63 | 0.28–1.39 | 0.25 |
| Total cholesterol (mg/dL) | 0.99 | 0.98–0.99 | 0.008 | 0.99 | 0.99–1.00 | 0.64 |
| BMI (m/kg2) | 0.97 | 0.94–1.01 | 0.28 | |||
| Insulin use | 1.20 | 0.74–1.95 | 0.44 | |||
| Hypoglycemic drugs use | 0.57 | 0.32–1.02 | 0.06 | |||
| Aspirin use | 0.90 | 0.55–1.46 | 0.67 | |||
| ACEi/ARB use | 1.96 | 1.22–3.16 | 0.005 | 1.54 | 0.76–3.13 | 0.22 |
| Statins use | 1.17 | 0.74–1.85 | 0.48 | |||
| Beta Blockers use | 1.41 | 0.87–2.30 | 0.16 | |||
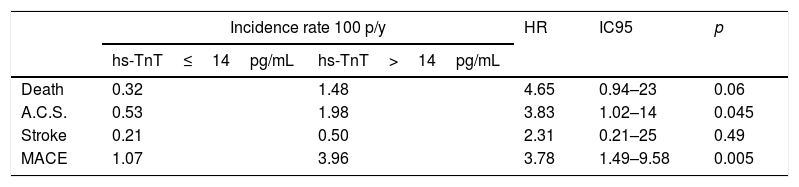
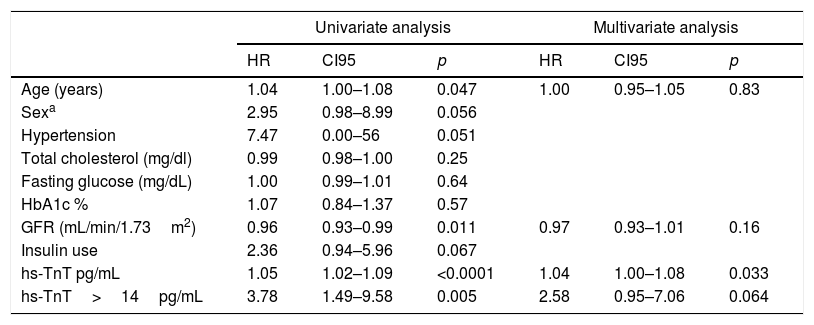
On follow-up with a median of 2.5 years, we observed 18 major cardiovascular events (3.84%). These include 6 deaths (1.28%), 9 ACS events (1.93%) and 3 stroke events (0.6%). A higher incidence of MACE was observed among those with troponin values above the reference limit, p long-rank test=0.0026 (Fig. 1). The patients with troponin levels above the reference threshold showed a rate of major cardiovascular events of 3.96 per 100 patients/year (p/y), while all others showed a rate of 1.07 per 100 p/y (HR=3.78 CI 95 1.49–9.58; p=0.005). Similarly, the rate of ACS events in patients with troponin levels above the threshold was 1.98 per 100 p/y and 0.53 per 100 p/y in those with troponin below the cut-off value (HR 3.83 CI95 1.02–14; p=0.045). Regarding mortality, although it was higher among those who presented a positive troponin, this difference was not statistically significant (1.48 vs 0.32 per 100 p/y; HR 4.65 CI95 0.94–23; p=0.06) (Table 4). In a multivariate analysis, only hs-TnT value as a continuous variable was independently associated with the risk of suffering MACE (Table 5).

Risk of vascular events in patients with hs-TnT above the reference limit (>14pg/mL).
| Incidence rate 100 p/y | HR | IC95 | p | ||
|---|---|---|---|---|---|
| hs-TnT≤14pg/mL | hs-TnT>14pg/mL | ||||
| Death | 0.32 | 1.48 | 4.65 | 0.94–23 | 0.06 |
| A.C.S. | 0.53 | 1.98 | 3.83 | 1.02–14 | 0.045 |
| Stroke | 0.21 | 0.50 | 2.31 | 0.21–25 | 0.49 |
| MACE | 1.07 | 3.96 | 3.78 | 1.49–9.58 | 0.005 |
A.C.S: Acute coronary syndrome; MACE: major adverse cardiovascular events.
MACE predictors.
| Univariate analysis | Multivariate analysis | |||||
|---|---|---|---|---|---|---|
| HR | CI95 | p | HR | CI95 | p | |
| Age (years) | 1.04 | 1.00–1.08 | 0.047 | 1.00 | 0.95–1.05 | 0.83 |
| Sexa | 2.95 | 0.98–8.99 | 0.056 | |||
| Hypertension | 7.47 | 0.00–56 | 0.051 | |||
| Total cholesterol (mg/dl) | 0.99 | 0.98–1.00 | 0.25 | |||
| Fasting glucose (mg/dL) | 1.00 | 0.99–1.01 | 0.64 | |||
| HbA1c % | 1.07 | 0.84–1.37 | 0.57 | |||
| GFR (mL/min/1.73m2) | 0.96 | 0.93–0.99 | 0.011 | 0.97 | 0.93–1.01 | 0.16 |
| Insulin use | 2.36 | 0.94–5.96 | 0.067 | |||
| hs-TnT pg/mL | 1.05 | 1.02–1.09 | <0.0001 | 1.04 | 1.00–1.08 | 0.033 |
| hs-TnT>14pg/mL | 3.78 | 1.49–9.58 | 0.005 | 2.58 | 0.95–7.06 | 0.064 |
The data presented in this study shows that detectable troponin levels can be measured in 95% of patients with type 2 diabetes, asymptomatic, with no history of cardiovascular events, renal insufficiency, inflammatory disease or systemic disease. Of these, 21% presented hs-TnT levels above the reference threshold. In this population, the 99th percentile was three times as high as the reference threshold proposed by the manufacturer. Similar results were observed in diabetic patients with an established cardiovascular disease.14 Nevertheless, it is noteworthy that we observed these high values in patients with type 2 diabetes with no history of cardiovascular disease, normal renal function and no clinical evidence of systemic or inflammatory disease.
It is well known that conventional assays allow the measurement of serum troponin levels in less than 1% of the population, while the use of high-sensitive assays allows for the detection of much lower troponin levels, thus increasing the rate of detection among patients.15 Because of this, the distribution of troponin values depends on the biochemical characteristics of each assay and of the population under study.4,16 The value of the 99th percentile proposed by the manufacturer as a threshold for medical decision of AMI depends on the corresponding population because these threshold values are established on populations that are presumably healthy or “normal”.16 However, because troponin levels are affected by the gender, age, ethnicity, and other factors that may influence this value on a given population, it has been proposed to determine different threshold values according to the corresponding population.15
The studies to determine the range of reference values for troponin assays demonstrated that the 99th percentile for men is substantially higher than for women, which could be explained by the higher heart mass in men.17 This difference can be observed not only on the value for the 99th percentile, but also on the percentage of patients with undetectable hs-TnT levels (10.9% in women vs 0.74% in men). Due to this, it may be necessary to use gender-specific values for the 99th percentile for patient evaluation.4 For example, Roche included gender-specific threshold values on an assay recently approved by the FDA.16
Our data also shows a progressive increase in hs-TnT levels with age, similar to other reports, even in healthy individuals (according to clinical, biochemical and imaging criteria) suggesting that this increase may be due to subtle changes that may have been undetected in the clinical characterization of these individuals.18 In another study performed on aging patients, the use of an age-adjusted reference threshold reduced the rate of hs-cTn false positives by approximately 90%, improving its diagnostic precision.19
In the case of patients with type 2 diabetes, the interpretation of hs-cTn values must be made with caution, taking into consideration the observed difference between the threshold values proposed by the manufacturer and the threshold value determined by this study. In these patients, the use of a lower threshold value determined for a healthy population may lead to an overestimation of ACS.15
Rubin et al. demonstrated that, in 9661 patients from the ARIC study, the troponin levels above the manufacturer's reference threshold increased progressively with increasing levels of glycosylated hemoglobin. We did not, however, observe a relationship between troponin and glycosylated hemoglobin levels. This difference may be because in our study all patients were diabetics and that the vast majority were under pharmacological treatment, which can clearly affect the levels of glycosylated hemoglobin.20
Our study opens the question as to why these diabetic patients with no history of significant coronary disease had elevated levels of troponin and what is its clinical meaning. The mechanisms by which hyperglycemia leads to myocardial damage, as evidenced by elevated troponin values, are not well understood. It has been proposed that the deleterious effect of chronic hyperglycemia in diabetic patients is due to an increased oxidative stress that leads to microcirculatory dysfunction and thus myocardial damage.21 Previously published mechanisms may explain this process, such as an increase in polyols flux, an increase in the intracellular formation of final products of exacerbated glycosylation, the activation of protein kinase C, and an increase in the hexosamine pathway.22 Also, the high prevalence of both systolic and diastolic ventricular dysfunction and left ventricular hypertrophy among diabetic patients could be a cause of chronic and sustained elevation of troponin levels.23 We cannot also exclude a role for possible atherosclerosis leading to a degree of silent ischemia. Diabetes also produces an increase in subclinical atheromatosis as evidenced by imaging studies, which then leads to increased silent myocardial damage as evidenced by higher biomarker levels.11
This would not only allow the use of troponin levels as a diagnostic tool for ACS, but also would provide prognostic information in diverse clinical situations: lung thromboembolism, patients with stable coronary disease, and even in the general population.24 hs-Tn and natriuretic peptides are promising markers with good discriminatory capacity for the risk of presenting heart failure or an acute coronary event as part of a primary prevention strategy. The presence of elevated biomarkers could allow early treatment or intensify therapeutic objectives by modifying the cardiovascular risk category of these patients.25,26 We can conclude from the data presented in this study that the detection of hs-TnT levels above the reference threshold is associated with an increased risk of cardiovascular events. However, this association must be adjusted by age and creatinine clearance. If we consider the troponin values as a continuous variable, its levels are associated with the incidence of cardiovascular events independently of age and glomerular filtration rate. This finding is in agreement with a previous study performed in diabetic women with no history of cardiovascular disease that showed that detectable hs-TnT levels, even below the reference threshold, were independently associated with the incidence of cardiovascular events.27
There is evidence of an increased risk of cardiovascular events in individuals under primary prevention with elevated hs-cTn levels.21,22,24,27,28 It is also known that changes in hs-cTn levels over time are associated with increased cardiovascular risk.29 However, there is no evidence of a treatment that can modify the troponin levels and alter the patient's clinical evolution.30 Nowadays the massive use of troponin for risk re-stratification in diabetic patients requires larger studies. These studies should have a design that allows evaluating the added value of biomarkers adjusted for the presence of structural heart disease in a systematic way.
Lastly, the finding that the 99th percentile hs-TnT levels in a given population is higher than the reference threshold raises the question of whether the reference value for ACS diagnosis on a patient that shows at the emergency department should be adjusted. Twerenbold proposes that the threshold values for diagnosis of ACS should be adjusted in a population of patients with diminished renal function.31 This value would be between 2 and 3 times the value for the reference population. Similar to others, we do not share this view, because in the presence of either diabetes or diminished renal function, even if the specificity and positive predictive value of this test are reduced, neither the sensitivity nor the negative predictive value are affected.32 In the case of patients that belong to a population of chronically elevated troponin levels, it is important to evaluate the changes above or below the basal troponin levels, considering significant any change beyond 20% to discriminate between chronic damage and acute injury.6
The lack of imaging data to confirm the absence of cardiovascular disease, not knowing the function and ventricular mass in all patients and the exclusion of inflammatory disease via biomarkers are limitations of the current study. Even if it is possible that a bias may be generated by the lack of evaluation of these entities, we consider that our study reflects the standard clinical practice, where a physician at an emergency department must evaluate the patient and determine a course of action in the absence of such information. The data obtained did not include the period of evolution of diabetes and we do not know the intensity of pharmacological treatment that these patients received. This may be a cause for the lack of correlation between glycosylated hemoglobin and troponin levels. Finally, it is important to highlight the low rate of events observed, which can be explained by the fact that is a selected population.
ConclusionsThe 99th percentile of hs-TnT levels in a population of patient with type 2 diabetes with no history of cardiovascular disease, normal renal function and no systemic or inflammatory disease was 3 times higher than the reference threshold proposed by the manufacturer for a healthy population. Also, we observed a difference in the distribution of hs-TnT levels between men and women. The measurement of elevated hs-TnT levels was associated with an increased risk of cardiovascular events.
Conflicts of interest and sponsorshipsThe authors declare that they have no conflicts of interest.
The realization of this work was funded by the Instituto de Medicina Cardiovascular and the Central Laboratory of the Hospital Italiano de Buenos Aires. We have not received any kind of sponsorship or financial assistance from third parties.
Alejandro P. Adam PhD.
