


To verify whether triponderal mass index (TMI) has a greater accuracy than body mass index (BMI), waist circumference (WC) and waist-to-height ratio (WHtR) as predictors of obesity in young people and older adults in a region of Chile.
Material and methodsA cross-sectional descriptive study was carried out in 1176 adults (565 men and 611 women) from the Maule region (Chile). Their ages ranged from 20 to 80 years. The percentage of fat mass (%FM) was evaluated by means of dual energy X-ray absorptiometry (DXA). Weight, height and waist circumference (WC) were evaluated. TMI, BMI and WHtR were calculated.
ResultsThe %FM predictions for BMI were 0.47% for men and 0.50% for women; for TMI, it was 0.50% for men and 0.51% for women; for WC, it was 0.28% for men and 0.21% for women; and finally, for WHtR, it was 0.28% in men and 0.21% in women. The area under the curve (AUC) for BMI was 0.85 in men and 0.85 in women; for TMI, it was 0.87 in men and 0.86 in women; for WHtR, it was 0.76 in men and 0.72 in women; and for WC, the AUC was 0.72 in men and 0.71 in women.
ConclusionIt was shown that TMI is the indicator that presented the greatest association with %FM and estimates body fat levels with greater precision than BMI, WC and WHtR. The results suggest its use and application as an indicator that discriminates obesity in young, middle-aged and elderly adults.
Verificar si el índice de masa triponderal (ITP) tiene una mayor precisión que el índice de masa corporal (IMC), circunferencia de cintura (CC) e índice cintura estatura (ICE) como predictores de obesidad en jóvenes y adultos mayores de una región de Chile.
Material y métodosSe efectuó un estudio descriptivo transversal en 1.176 sujetos (565 hombres y 611 mujeres), adultos de la región del Maule (Chile). El rango de edad oscila desde los 20 hasta los 80 años. Se evaluó el porcentaje de masa grasa (%MG) por medio de la absorciometría de rayos X de energía dual (DXA). Se evaluó el peso, la estatura y la circunferencia de la cintura (CC). Se calculó el ITP, IMC e ICE.
ResultadosLas predicciones del %MG para el IMC fueron 0,47% para hombres y 0,50% para mujeres; para ITP fue de 0,50% para hombres y 0,51% para mujeres; para la CC fue de 0,28% para hombres y 0,21% para mujeres; y finalmente, para el ICE en hombres fue de 0,28% en hombres y 0,21% en mujeres. El área bajo la curva (AUC) para el IMC en hombres fue de 0,85 y mujeres de 0,85; para el ITP fue de 0,87 en hombres y 0,86 en mujeres; para la ICE en hombres fue de 0,76 y en mujeres de 0,72; y para la CC, el AUC en hombre fue de 0,72 y en mujeres fue de 0,71.
ConclusiónSe demostró que el ITP es el indicador que presentó mayor asociación con el %MG y estima los niveles de grasa corporal con mayor precisión que el IMC, CC e ICE. Los resultados sugieren su uso y aplicación como un indicador que discrimina la obesidad en adultos de edad joven, media y tardía.
The World Health Organization (WHO) defines obesity as abnormal or excessive fat accumulation that can affect overall health.1 In recent years, the prevalence of obesity in the world has increased to epidemic proportions.2 This represents a threat to developed and developing countries.3,4
Obesity is a major public health problem worldwide, as excess fat or adipose tissue is strongly associated with risk factors for cardiovascular disease (CVD), such as hypertension, diabetes mellitus and dyslipidaemia.5,6
Alternative indicators have now been developed that deal with skinfold thickness, bioimpedance analysis, dual energy X-ray absorptiometry (DXA), and anthropometric index7–9 to assess excess weight in children, adolescents and adults. These indicators are generally used to characterise obesity in adults and assess the risks associated with excess body adiposity10 in various parts of the world.
In the case of anthropometric indices, measures of adiposity in adults have been developed and studied, including waist circumference (WC), waist-hip ratio (WHR), waist-to-height ratio (WHtR), body mass index (BMI),6,11 adiposity index (AI),4 among other indicators.
Nevertheless, as far as is known there is no consensus on the most useful and simple indicator to assess body adiposity in adults.12 These discrepancies open up new possibilities for researchers worldwide to identify and validate precise and exact indicators according to the socio-economic and cultural characteristics of each country.
In this context, Chile is a country with a high prevalence of obesity (43%),13 where several studies generally use BMI, WC, and WHtR to assess excess body adiposity among the adult population,14–17 and even the Ministry of Health in the national survey suggests using BMI to evaluate the nutritional status of young people and adults.13 However, the indiscriminate use of these indicators could cause inconsistencies and discrepancies between methods, since it is necessary to identify an appropriate anthropometric index to precisely and accurately classify excess body fat among the adult population of Chile.
This information is relevant, since it can contribute to an effective evaluation of the risk of obesity in the adult population, as well as guide the adequate and appropriate management of preventive strategies and policies in the country.
Consequently, several studies have recently used the triponderal mass index (TMI) as a more precise indicator to detect excess weight in children, adolescents and young adults,18 since height cubed allows for correcting variations in age, weight and changes in body fat during physical growth.18,19 However, to the best of our knowledge, no studies have been carried out in the adult population of Chile in which the applicability of TMI in other stages of life has been investigated.
Therefore, this research is based on the premise that if TMI is used during the stage of physical growth, due to differences in age, weight and height, then it is likely that it could be applicable during youth, adulthood and old age, given its ability to maximise accuracy, in detecting obesity due to significant changes in body composition20,21 and decrease in height22 with advancing age.
Therefore, this study aimed to verify whether TMI has a greater accuracy than BMI, WC and WHtR as predictors of obesity in young people and older adults in a region of Chile. For this purpose, DXA was used as the criterion method.
MethodsStudy type and sampleA cross-sectional descriptive study was carried out in 1176 adults (565 men and 611 women) from the Maule region (Chile). Their ages ranged from 20 to 80 years. The subjects were recruited voluntarily from universities (public and private), as well as young and older adults of Chilean nationality who participated in the social programmes of the Municipality of Talca (Chile). The sample selection was non-probabilistic.
The Maule region, the capital of which is the city of Talca, is the seventh region of Chile and has four provinces (Cauquenes, Curicó, Linares and Talca). It is located 230 km south of the capital (Santiago) and is at an altitude of 102 m above sea level.
The human development index (HDI) score for Chile, according to the United Nations Development Programme (UNDP),23 was 0.847 for 2018. Life expectancy is 80 years. In the Maule region, the HDI was 0.872.
Before being evaluated, all subjects received information about the objective of the study. The protocol was explained to them and they were invited to participate in the research in a laboratory at the University. Each participant signed the informed consent, authorising the anthropometric and DXA scan evaluations.
The protocol was developed in accordance with the indications of the local ethics committee (UA, 2015–16) and the Declaration of Helsinki for human beings. All subjects who completed the anthropometric evaluations, DXA and who were of Chilean nationality were included in the study. Those volunteers who had not maintained a stable weight in the last three months, foreigners and those who were not physically able to transport themselves (especially in adults older than 65–80 years) were excluded from the study, as were those who had some type of prosthesis and/or metallic implants, and pregnant women.
Techniques and proceduresData such as date of birth, evaluation and sex were recorded in an individual file created by the laboratory. The anthropometric evaluations and the DXA scan were carried out between 2015 and 2018 from 8.30 a.m. to 1.00 p.m. and from 3.00 p.m. to 6.00 p.m. from Monday to Friday between the months of April to June and August to November of each year.
The evaluations lasted between 12 and 15 min per subject and were carried out in a closed laboratory (20 to 24 °C) of the University. One of the researchers was responsible for the anthropometric evaluations and another for the DXA scan. Both have extensive experience and were properly trained for these activities.
Anthropometric evaluations of weight, height and waist circumference were performed according to the protocol standardised by Ross and Marfell-Jones.24 It was carried out with the least amount of clothing possible (shorts, T-shirt and no shoes).
For body weight (kg), an electronic scale (Tanita, United Kingdom) was used, with a scale from 0 to 150 kg, and with a precision of 100 g. Standing height was assessed using a portable stadiometer (Seca GmbH & Co. KG, Hamburg, Germany) with a precision of 0.1 mm, according to the Frankfurt plane.
Waist circumference (cm) was measured at the midpoint between the lower ribs and the upper part of the iliac crest, with a metal Seca tape measure graduated in millimetres and with a precision of 0.1 cm. To verify the reliability of the measurements, the technical error of measurement (TEM) of the entire sample was used. The values of the TEM% in the three variables ranged from 0.9% to 1.7%.
The percentage of total body fat (%FM) was estimated by DXA, using a Lunar Prodigy machine (General Electric, Fairfield, CT), with Encore 2006 software. The procedure consisted of scanning the whole body (without the head) for both sexes.
The scans were carried out in a single laboratory and with the same densitometer. The values for % of fat mass and fat mass (kg) were extracted. The procedure consisted of the subjects lying on the examination platform in a supine position with their arms and legs extended (in pronation). The ankles were fastened together with a hook-and-loop strap to ensure standard positioning.
The evaluations were carried out by a technician with extensive experience. Calibration was performed daily before scanning, following the vendor's recommended procedure. The reference values to classify obesity considered were >35% in women and >25% in men.25 To guarantee the TEM, 10% of the sample (57 men and 61 women) were selected, who were scanned twice. The TEM% ranged from 2.1% to 2.5%.
BMI was calculated using the formula: BMI = weight (kg)/height2 (m), TMI = weight (kg)/height3 (m) and WHtR = waist circumference (cm)/height (cm).
The cut-off points to determine the obesity category were: >30 kg/m2 for BMI2; >17 kg/m3 for TMI2; >102 cm (men) and >88 cm (women) for WC, according to the recommendations of the clinical guideline for obesity of the US National Institutes of Health (NIH); and >0.6 for WHtR.26
StatisticsThe normal distribution of the data was verified using the Kolmogorov-Smirnov test. Descriptive statistics of arithmetic mean, standard deviation, frequencies and range were analysed. Three age groups were considered for data analysis (20.0–30.9 years; 40.0–59.9 years and 60.0–80.0 years). Differences between sexes were verified by means of the t-test for independent samples. Differences between the three age groups were verified by means of the Anova and Tukey tests. Associations between BMI, TMI, WC, WHtR and %FM were made by means of quadratic regression (there was no linearity between variables).
The receiver operating characteristic (ROC) area under the curve (AUC) was used to determine the optimal cut-off points for BMI, TMI, WC and WHtR in relation to the DXA definition of obesity. The cut-off points were chosen based on the highest Youden's J index (sensitivity + specificity −1) by gender. For all cases, P < .05 was adopted and the calculations were performed using Excel spreadsheets, SPSS 18.0 and MedCalc 11.1.0.
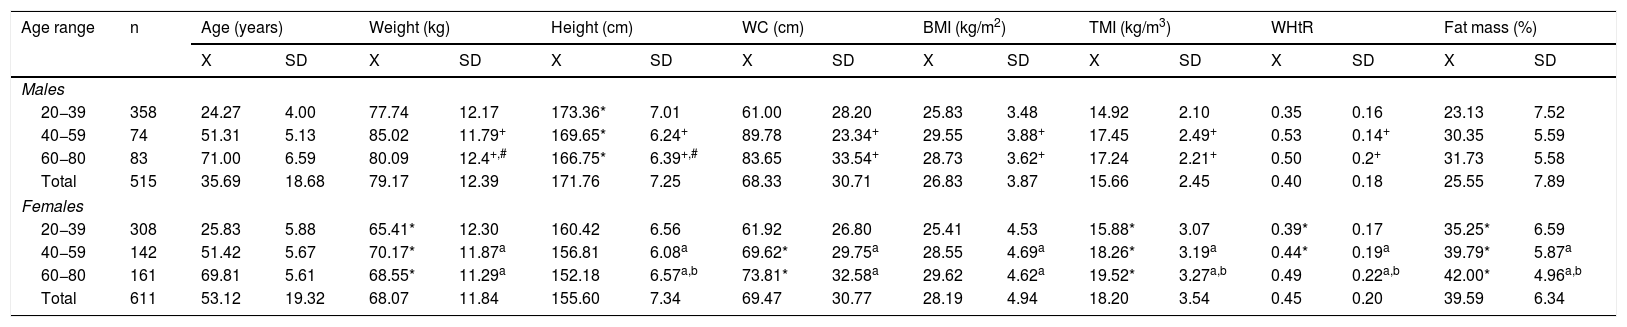
ResultsThe anthropometric variables, indicators of adiposity and %FM that characterise the studied sample are shown in Table 1. Men presented higher values of weight and height in relation to women (P < .05) in the three age ranges, while women had higher TMI and %FM values compared to men (P < .05).
Anthropometric indicators and % of fat mass by age ranges and sex of young people and older adults studied.
| Age range | n | Age (years) | Weight (kg) | Height (cm) | WC (cm) | BMI (kg/m2) | TMI (kg/m3) | WHtR | Fat mass (%) | ||||||||
|---|---|---|---|---|---|---|---|---|---|---|---|---|---|---|---|---|---|
| X | SD | X | SD | X | SD | X | SD | X | SD | X | SD | X | SD | X | SD | ||
| Males | |||||||||||||||||
| 20−39 | 358 | 24.27 | 4.00 | 77.74 | 12.17 | 173.36* | 7.01 | 61.00 | 28.20 | 25.83 | 3.48 | 14.92 | 2.10 | 0.35 | 0.16 | 23.13 | 7.52 |
| 40−59 | 74 | 51.31 | 5.13 | 85.02 | 11.79+ | 169.65* | 6.24+ | 89.78 | 23.34+ | 29.55 | 3.88+ | 17.45 | 2.49+ | 0.53 | 0.14+ | 30.35 | 5.59 |
| 60−80 | 83 | 71.00 | 6.59 | 80.09 | 12.4+,# | 166.75* | 6.39+,# | 83.65 | 33.54+ | 28.73 | 3.62+ | 17.24 | 2.21+ | 0.50 | 0.2+ | 31.73 | 5.58 |
| Total | 515 | 35.69 | 18.68 | 79.17 | 12.39 | 171.76 | 7.25 | 68.33 | 30.71 | 26.83 | 3.87 | 15.66 | 2.45 | 0.40 | 0.18 | 25.55 | 7.89 |
| Females | |||||||||||||||||
| 20−39 | 308 | 25.83 | 5.88 | 65.41* | 12.30 | 160.42 | 6.56 | 61.92 | 26.80 | 25.41 | 4.53 | 15.88* | 3.07 | 0.39* | 0.17 | 35.25* | 6.59 |
| 40−59 | 142 | 51.42 | 5.67 | 70.17* | 11.87a | 156.81 | 6.08a | 69.62* | 29.75a | 28.55 | 4.69a | 18.26* | 3.19a | 0.44* | 0.19a | 39.79* | 5.87a |
| 60−80 | 161 | 69.81 | 5.61 | 68.55* | 11.29a | 152.18 | 6.57a,b | 73.81* | 32.58a | 29.62 | 4.62a | 19.52* | 3.27a,b | 0.49 | 0.22a,b | 42.00* | 4.96a,b |
| Total | 611 | 53.12 | 19.32 | 68.07 | 11.84 | 155.60 | 7.34 | 69.47 | 30.77 | 28.19 | 4.94 | 18.20 | 3.54 | 0.45 | 0.20 | 39.59 | 6.34 |
X: mean; SD: standard deviation; BMI: body mass index; TMI: triponderal index; WC: waist circumference; WHtR: waist-to-height ratio.
On the contrary, both men and women presented similar ages and BMI in the three age groups (P > .05). In WC, in the first age group there were no differences between the sexes, while in the next two (40−59 years and 60−80 years), men presented higher values than women (P < .05). In WHtR, no differences were observed between the sexes in two age groups (20−39 years and 60−80 years). However, in the 40−59 years group, men showed higher values of WHtR compared to women (P < .05).
Regarding the comparisons between the three age groups, there were differences in both men and women in age, weight, height and WC (P < .05). However, in BMI, TMI and %FM, men and women in the 20−39 years group differ from the other groups (40−59 years and 60−80 years) (P < .05).
The R2 values of the non-linear quadratic model for each anthropometric index and sex can be observed in Fig. 1. The predictions of %FM for BMI were 0.47% for men and 0.50% for women; for TMI, it was 0.50% for men and 0.51% for women; for WC, it was 0.28% for men and 0.21% for women; and finally, for WHtR, it was 0.28% in men and 0.21% in women. In general, the best predictions were observed for TMI for both sexes.

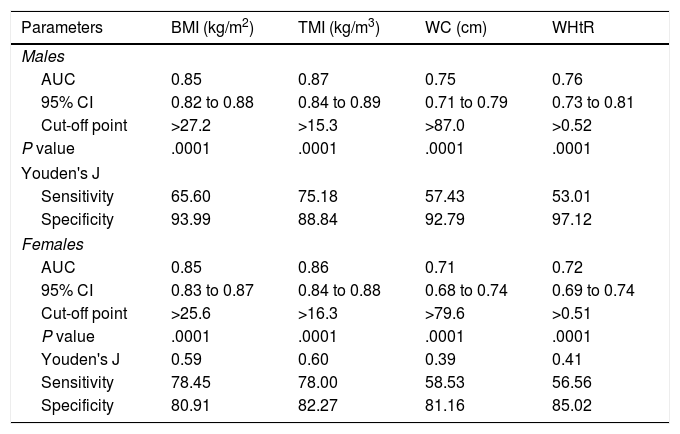
ROC curves for BMI, TMI, WC and WHtR were made from the general sample for both sexes. The comparisons and performance can be seen in Fig. 2 and Table 2.

Area under the curve, cut-off points, and sensitivity and specificity by age range and sex in young people and older adults studied.
| Parameters | BMI (kg/m2) | TMI (kg/m3) | WC (cm) | WHtR |
|---|---|---|---|---|
| Males | ||||
| AUC | 0.85 | 0.87 | 0.75 | 0.76 |
| 95% CI | 0.82 to 0.88 | 0.84 to 0.89 | 0.71 to 0.79 | 0.73 to 0.81 |
| Cut-off point | >27.2 | >15.3 | >87.0 | >0.52 |
| P value | .0001 | .0001 | .0001 | .0001 |
| Youden's J | ||||
| Sensitivity | 65.60 | 75.18 | 57.43 | 53.01 |
| Specificity | 93.99 | 88.84 | 92.79 | 97.12 |
| Females | ||||
| AUC | 0.85 | 0.86 | 0.71 | 0.72 |
| 95% CI | 0.83 to 0.87 | 0.84 to 0.88 | 0.68 to 0.74 | 0.69 to 0.74 |
| Cut-off point | >25.6 | >16.3 | >79.6 | >0.51 |
| P value | .0001 | .0001 | .0001 | .0001 |
| Youden's J | 0.59 | 0.60 | 0.39 | 0.41 |
| Sensitivity | 78.45 | 78.00 | 58.53 | 56.56 |
| Specificity | 80.91 | 82.27 | 81.16 | 85.02 |
AUC: area under the curve; CI: confidence interval; BMI: body mass index; TMI: triponderal mass index; WC: waist circumference; WHtR: waist-to-height ratio.
For example, the AUC for BMI in men was 0.85 (65% sensitivity and 94% specificity) and in women the AUC was 0.85 (78.5% sensitivity and 80.9% specificity). For TMI, the AUC for men was 0.87 (75.1% sensitivity and 88.8% specificity), while for women the AUC was 0.86 (78% sensitivity and 82.3% specificity). For WHtR, the AUC in men was 0.76 (53% sensitivity and 97.1% specificity) and in women it was 0.72 (56.5% sensitivity and 85% specificity). For WC, the AUC in men was 0.72 (57.4% sensitivity and 92.3% specificity) and in women it was 0.71 (58.5% sensitivity and 81.2% specificity).
Table 2 also shows the specific cut-off points for each anthropometric indicator, by sex. In general, TMI demonstrates the best performance for both sexes.
DiscussionThe results of the study have shown that TMI presented a greater association with the %FM criterion method in both sexes. The predictive power was followed by BMI, while WC and WHtR reflected much lower explanatory values (R2 = 28% and 21%) in relation to TMI.
It was also verified that the AUC and the sensitivity and specificity of TMI were higher in relation to the other anthropometric indices. This shows that this indicator can help identify excess weight (obesity) with greater precision in Chilean adults from 20 to 80 years of age.
These results confirm the hypothesis proposed in the study, since TMI proved to be more accurate in relation to indicators such as BMI, WC and WHtR; although BMI is still useful in this study, since the results support it as a possible alternative in anthropometric evaluation in young people and older adults in Chile.
These findings are consistent with some studies that have been carried out in samples of children and adolescents8,18,27 and young adults,18,28,29 which highlight that TMI can be considered an appropriate tool for the detection and classification of obesity, and there has even been other research carried out on infants that has shown a high degree of accuracy in determining body adiposity in relation to BMI.30,31
In this sense, the variations observed in this study, both in height (decrease in height with increasing age) and in %FM (increase in fat mass with more advanced age) (Table 1), could explain, in part, the applicability of TMI to the Chilean adult population, since height cubed is based on the fact that volume (weight) is proportional to L3 (height) and the V/L3 ratio is constant.32 This allowed us to better adjust the weight variations within a wide range of ages throughout the adult stage, as demonstrated by Peterson et al.18 when investigating children, adolescents and young adults up to 28 years of age.
In fact, a disproportionate increase in fat mass levels from young adulthood to middle and late (elderly) adulthood, as observed in this study, could lead to adverse health outcomes. Therefore, during these stages of adult life it is important to maintain an appropriate weight to prevent a wide spectrum of comorbidities, such as type 2 diabetes mellitus, hypertension, dyslipidaemia, cardiovascular disease, non-alcoholic fatty liver disease, reproductive dysfunction, respiratory disease, psychiatric disorders, some types of cancer33 and premature death from obesity.34
In addition, in a country like Chile, where there is on the whole a high burden of obesity,35 TMI could be considered a useful tool for defining overweight and obesity in the Chilean population. This tool could be essential for public health, to design and monitor intervention programmes.36
Based on the results obtained, there is a need for future studies that propose additional measurements and anthropometric indices that help to better understand the nutritional status of the Chilean population, since the prevalence of leanness and obesity varies widely from one country to another.37 Therefore, each geographical region should propose anthropometric indicators according to its social, economic and cultural characteristics. This information may be useful in proposing a national reference from birth to old age in the future.
Studies in general should also be concerned with investigating the specific powers of scale by age and sex, in each of the stages of life, since the allometric laws establish that shape is necessarily modified by body size,38 which can play a relevant role in the definition of obesity.
This study has some limitations that deserve to be acknowledged. It was not possible to design a probabilistic sampling, so the results are limited to the Maule region (Chile). It was also not possible to collect information on the levels of physical activity and eating habits, information that would have contributed to a better interpretation of the results obtained. However, notwithstanding that, this is the first study conducted in Chile and Latin America, in which a wide range of ages (20–80 years) was covered and DXA was used as the gold standard to compare with anthropometric indicators.
ConclusionIn conclusion, this study showed that TMI is the indicator that presented the greatest association with %FM and estimates body fat levels with greater precision than BMI, WC and WHtR. The results suggest its use and application as an indicator that discriminates obesity in young, middle-aged and elderly adults.
FundingThe authors thank the Proyecto Fondecyt Regular - ANID, 1141295.
Conflicts of interestThe authors declare that they have no conflicts of interest.
Please cite this article as: Gómez-Campos R, Vidal-Espinoza R, Castelli Correia de Campos LF, Sulla-Torres J, Cossio-Bolaños W, de Arruda M, et al. Comparación de indicadores antropométricos como predictores del porcentaje de masa grasa en jóvenes y adultos mayores de Chile. Endocrinol Diabetes Nutr. 2022;69:25–33.
