


Glycated hemoglobin (HbA1c) level reflects chronic glycemic status if reliable tests are used, however, in some regions worldwide high performing assays might not be readily available. This study aimed to asses two HbA1c immunoassays, comparing them with high-performance liquid chromatography (HPLC) assay, three methods available in Ecuador.
Material and methodsHbA1c were measured in 114 fresh whole blood-samples by DCA-Vantage point-of-care analyzer, I-Chroma portable fluorescent scanner immunoassay and BioRad Variant II Turbo HPLC. Normal and pathological HbA1c ranges were included. Blood samples with variants of hemoglobin were excluded. HbA1c values were expressed in National Glycohemoglobin Standardization Program percentages and mmol/mol, as mean±standard deviation.
ResultsHbA1c results by HPLC and DCA-Vantage were similar: 6.3±1.7% (45±18.6mmol/mol) vs. 6.3±1.8% (45±19.7mmol/mol), respectively, P=0.057; while HbA1c values by I-Chroma were lower than HPLC, 5.8±1.9% (40±20.8mmol/mol), P<0.001. The coefficient of variation was below 2% for high and low HbA1c levels, in all methods studied. HbA1c values by HPLC and DCA-Vantage were highly correlated (Spearman's Rank Correlation [SRC]: 0.916), while the correlation among HPLC and I-Chroma was weak (SRC: 0.368). The mean bias between DCA-Vantage and HPLC was −0.02±0.29% (−0.2±3.2mmol/mol), while for I-Chroma and HPLC mean bias was −0.50±1.62% (−5.5±17.7mmol/mol).
ConclusionHbA1c immunoassays DCA-Vantage was comparable to HPLC assay, showing good correlation, appropriate precision and low bias, whereas I-Chroma assay was precise but inaccurate. Therefore, DCA-Vantage has better performance than I-Chroma. These findings suggest that is convenient to assess the HbA1c immunoassays commercially available in our country, Ecuador.
El nivel de hemoglobina glucosilada (HbA1c) refleja el estado glucémico crónico si se utilizan pruebas confiables. En algunas regiones del mundo los métodos de alto desempeño para medir la HbA1c no son fácilmente accesibles. Nuestros objetivos fueron evaluar 2 inmunoensayos, comparándolos con la cromatografía líquida de alta resolución (HPLC, por sus siglas en inglés), 3 ensayos disponibles en Ecuador.
Materiales y métodosEn 114 muestras de sangre entera medimos la HbA1c por DCA Vantage®, escáner fluorescente i-Chroma® y HPLC Bio-Rad Variant II® Turbo. Incluimos valores normales y patológicos de HbA1c. Excluimos muestras con variantes de la hemoglobina. La HbA1c fue expresada en porcentaje según el Programa Nacional de Estandarización de la Glicohemoglobina y en mmol/mol (media±desviación estándar).
ResultadosLa HbA1c medida por HPLC y DCA Vantage® fue semejante: 6,3±1,7% (45±18,6 mmol/mol) y 6,3±1,8% (45±19,7mmol/mol), respectivamente, p=0,057; pero la cuantificada por i-Chroma® fue menor a HPLC, 5,8±1,9% (40±20,8mmol/mol), p<0,001. El coeficiente de variación fue menor al 2% en los 3 ensayos estudiados. Los valores de HbA1c obtenidos por HPLC y DCA Vantage® estuvieron fuertemente correlacionados (correlación de Spearman [CS]: 0,916), mientras que la correlación entre HPLC y i-Chroma® fue débil (CS: 0,368). El sesgo medio entre DCA Vantage® y HPLC fue −0,02±0,29% (−0,2±3,2mmol/mol), en cambio, entre i-Chroma® y HPLC fue −0,50±1,62% (−5,5±17,7mmol/mol).
ConclusiónEl inmunoensayo DCA Vantage® fue comparable a HPLC, mostrando buena correlación, apropiada precisión y bajo sesgo, mientras que i-Chroma® fue preciso, pero inexacto. Por lo tanto, DCA Vantage® tiene mejor desempeño que i-Chroma®. Estos hallazgos sugieren que es conveniente evaluar los inmunoensayos comercialmente disponibles en nuestro país, Ecuador.
Diabetes mellitus (DM) affects people worldwide, it was estimated in 2017 that in South and Central America 26.0 million adults suffered from DM, of these 10.4 million (40%) were undiagnosed.1,2 Glycated hemoglobin A1c (HbA1c) is the hemoglobin irreversibly glycated in the Valine amino-terminal residues located in beta hemoglobin chain.3–7 HbA1c illustrates the level of glycemic control over time and it was related to DM since five decades ago, becoming a useful tool due to higher reproducibility, specificity and convenience.8–16 HbA1c use was suggested for DM diagnostic, HbA1c values of 6.5% (48mmol/mol) revealed 99.6% specificity versus fasting plasma glucose criteria for DM diagnostic.9
Currently HbA1c quantification is utilized for both DM diagnosis and management, values of HbA1c ≥6.5% (≥48mmol/mol), obtained by means of methods certified by the international glycohemoglobin standardization programs, were recommended for DM diagnosis, while for DM management, individualized glycemic goals were strongly suggested.12–16 Additionally, high HbA1c levels were linked to an increased risk of chronic DM complications such diabetic nephropathy, and changes in HbA1c values ≥1% (≥10.9mmol/mol) were considered as being clinically significant,14,16–22 therefore, confidence in HbA1c results is critical for clinical practice and human research.
The HbA1c testing improved with the efforts of many national and international organizations.9,12,13,21 The National Glycohemoglobin Standardization Program (NGSP) and the International Federation of Clinical Chemistry Working Group on HbA1c Standardization (IFCC), improved the quality of HbA1c results in developed countries, however, in some regions worldwide, like Ecuador, high performing assays might not be readily available.9,12,13,21,22 The objective of this study was to evaluate two HbA1c immunoassays, comparing them with high-performance liquid chromatography (HPLC) assay, three methods commercially available in Ecuador. Our study identified the strengths and weaknesses of both studied immunoassays, distinguishing which one had the best performance.
Materials and methodsOne hundred fourteen fresh whole-blood samples from adults’ persons were analyzed in this study. This study was carried out in accordance with The Code of Ethics of the World Medical Association and all procedures performed in this study were in accordance with the ethical standards of the Ethics Committee of Luis Vernaza Hospital (DN-HLV0178-DV), Junta de Beneficencia de Guayaquil, Ecuador and with the Helsinki declaration. Informed consent was obtained from all subjects studied. Inclusion criteria were: individuals between 21 and 70 years of age, with and without diagnosis of DM, not hospitalized, not suffering acute illnesses, able to sign the informed consent and domiciled in the place of contact for at least 6 months prior to the study. Exclusion criteria included subjects with acute illnesses, temporary residents in the contact address and samples with hemoglobin variants.
Community leaders summoned 136 people between 21 and 70 years of age, individuals that agreed to participate, gave written consent and fulfilled inclusion and exclusion criteria were enrolled (n=114). The sample size was calculated considering the prevalence of DM in our country, the blood samples required by the international organizations to certificate laboratories and an estimated sample loss of 30%.1,21,22 Personal data including medical diagnosis of type 2 DM (T2DM) were collected from all individuals enrolled using a questionnaire filled by trained personnel. All blood samples obtained from enrolled people were deemed useful for the study (n=114).
Blood samples were obtained and maintained in the same pre-analytical conditions. They were collected by peripheral venous puncture and maintained in tubes with ethylenediamine tetra acetic acid (BD Vacutainer® K2 EDTA, spray-dried 3.6mg), at 4°C, until the HbA1c assay was performed at the laboratory, within 48hours following the blood draw. All instruments were calibrated by trained operators, utilizing the standards solutions provided by the manufacturers.
HbA1c was quantified in the same 114 blood samples by the three methods detailed below:
(1) DCA-Vantage Siemens (Simed S.A. Quito, Ecuador). This analyzer determines HbA1c by immunoassay. Briefly, when 1 microliter of whole blood is injected into the cartridge (reagent kit HbA1c, DCA System, Siemens, cartridges lot-number 0572036), which is manually placed in the equipment, the hemoglobin concentration is measured by spectrophotometry. Then, using a specific monoclonal antibody for HbA1c and inhibition of immunoagglutination in latex, HbA1c is quantified. All HbA1c measurements by DCA-Vantage were made in the laboratory of the Public Health School, State University of Milagro, Guayas, Ecuador.
(2) I Chroma™, Boditech Med Inc portable fluorescent scanner (I-Chroma) (Rapiservilab, Guayaquil, Ecuador). This equipment measures HbA1c by chemiluminescence immunoassay, based on the fluorescence generated by anti-HbA1c monoclonal antibodies. It is a method of immunodetection by competition. In a capillary tube 5μl of whole blood was placed and then incorporated into a mixture of hemolysis and detection buffer. This mixture of HbA1c from the hemolyzed erythrocytes and fluorescent HbA1c was loaded into a cartridge. The mixture then migrated into a nitrocellulose matrix where the HbA1c of the blood sample competed with the fluorescent HbA1c for anti-HbA1c antibodies bound to the matrix. The fluorescent signal was interpreted by the I-Chroma™ Reader. The HbA1c measurements by I-Chroma were performed at the Pazmiño Clinical and Microbiological Laboratory, Milagro, Guayas, Ecuador.
(3) Ion exchange with HPLC, BioRad Variant II Turbo, (Simed S.A. Quito, Ecuador). The whole blood sample was automatically diluted and injected into a cartridge. The Variant II Turbo Chromatographic Station pumps delivered a programmed buffer gradient. The hemoglobin fractions were separated based on ionic interactions, and the peak ratio of HbA1c to total hemoglobin was calculated. The HbA1c measurements by HPLC were performed in the laboratory Interlab SA, Principal branch, Guayaquil, Guayas, Ecuador.
To calculate the intraassay coefficient of variation (CV) we measured HbA1c five times two different fresh blood samples with each of the three methods assessed. One blood sample had HbA1c<6.5% (<48mmol/mol) representing low HbA1c levels (low-level-sample) and the other one had HbA1c>6.5% (>48mmol/mol), representing high HbA1c levels (high-level-sample). The CV was calculated using the following equation:
Statistical analysis. We applied Kosmogorov-Smirnov test to determine the normality of the data. To calculate the differences between paired values, we used the Wilcoxon test (HbA1c by HPLC vs HbA1c by DCA-Vantage; HbA1c by HPLC vs HbA1c by I-Chroma). To compare dichotomous variables, we applied Fisher's test (DM false negative and DM false positives HbA1c test by DCA-Vantage and I-Chroma). Spearman's rank correlation was calculated to study the correlation between HbA1c by HPLC and DCA-Vantage or I-Chroma. We applied the Passing-Bablok regression method, with bootstrap confidence intervals (CI) method. To evaluate data agreement, we performed the analysis and diagram of Bland and Altman23 using the Bahar's et al. interactive website24 for analytical method comparison and bias estimation (difference plot X vs. Y-X). Calculations were obtained using Microsoft Excel 2016, XLSTAT 2017 and statistical analyses were performed using Microsoft Excel, XLSTAT 2017 and Statgraphics Centurion XVII-X64. Age was expressed in mean±standard deviation. HbA1c values were expressed in NGSP percentages and mmol/mol, as mean±standard deviation; to convert NGSP percentage in mmol/mol IFCC we used the NGSP calculator.25P values <0.05 were deemed statistically significant.
ResultsAll blood samples (n=114) belonged to Hispanic individuals from Ecuador, mean age was 52.26±15.35 years, 59.65% were women. The mean age of individuals without T2DM (79%) was 50.79±16.49 years, 63.33% of them women. The mean age of T2DM individuals (21%) was 57.79±7.83 years and 45.83% of them were women.
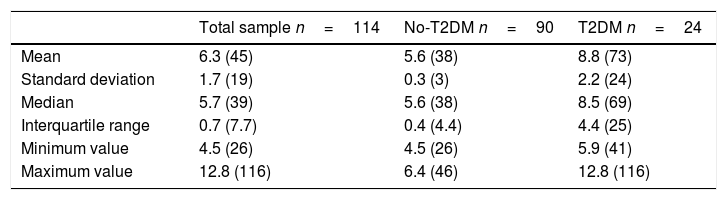
Normal and pathological HbA1c ranges were tested in this study, 58.77% of the blood samples examined by HPLC had HbA1c values between 5.6% (38mmol/mol) and 8.5% (53mmol/mol), 30.70% had HbA1c values lower than 5.6% (38mmol/mol) and 10.53% had HbA1c values higher than 8.5% (38mmol/mol). All samples whose HbA1c levels were ≥6.5% (≥48mmol/mol) by HPLC (18 blood samples), belonged to subjects with T2DM diagnosis. HbA1c values measured by HPLC are shown in Table 1, including blood samples from all individuals (114), and individuals with T2DM (24) and without T2DM (90).
HbA1c values measured by HPLC.
| Total sample n=114 | No-T2DM n=90 | T2DM n=24 | |
|---|---|---|---|
| Mean | 6.3 (45) | 5.6 (38) | 8.8 (73) |
| Standard deviation | 1.7 (19) | 0.3 (3) | 2.2 (24) |
| Median | 5.7 (39) | 5.6 (38) | 8.5 (69) |
| Interquartile range | 0.7 (7.7) | 0.4 (4.4) | 4.4 (25) |
| Minimum value | 4.5 (26) | 4.5 (26) | 5.9 (41) |
| Maximum value | 12.8 (116) | 6.4 (46) | 12.8 (116) |
No-T2DM: blood samples from persons without T2DM (79%); T2DM: blood samples from people with T2DM (21%). HbA1c values are expressed as NGSP percentage and as (mmol/mol).
HbA1c levels measured by HPLC were similar to those measured by DCA-Vantage: 6.3%±1.7% (45mmol/mol±18.6mmol/mol), median 5.7% (39mmol/mol) and interquartile range 0.7% (7.7mmol/mol) vs 6.3%±1.8% (45mmol/mol±19.7mmol/mol), median 5.7% (39mmol/mol) and interquartile range 0.6% (6.6mmol/mol) respectively (P=0.057), however, HbA1c levels measured by I-Chroma were lower than HPLC measurements, 5.8%±1.9% (40mmol/mol±20.8mmol/mol), median 5.2% (33mmol/mol) and interquartile range 1.2% (13.1mmol/mol) (P<0.0001). Variants of hemoglobin were undetected by chromatograms provided by the HPLC equipment.
Analysis of all 114 blood samples by HPLC showed that 7 samples from T2DM subjects had HbA1c≥6.5% (≥48mmol/mol) while the same 7 samples measured by I-Chroma showed HbA1c values <6.5% (<48mmol/mol) (i.e. false negatives). Only one HbA1c value <6.5% (<48mmol/mol) by DCA-Vantage, was found to be 6.5% (48mmol/mol) by HPLC (i.e. false negative) (P=0.06, compared to I-Chroma). Additionally, HbA1c measurements by I-Chroma revealed numerous false positives, eight samples in the DM range which when measured by HPLC HbA1c levels were <6.5% (<48mmol/mol) (P=0.0039, compared to DCA-Vantage).
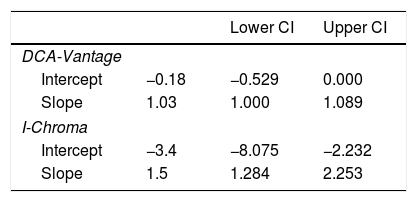
Correlation. A strong positive linear correlation between HbA1c levels measured by DCA-Vantage and HPLC was observed (Spearman's Rank Correlation: 0.916) (Fig. 1A and Table 2). In contrast, a weak positive correlation was observed between HbA1c measured by I-Chroma and HPLC (Spearman's Rank Correlation: 0.368), (Fig. 1B and Table 2). Together, these results show better correlation between HbA1c values by DCA-Vantage and HPLC than between HbA1c values by I-Chroma and HPLC.
 Strong positive linear correlation between HbA1c by HPLC and DCA-Vantage. (B) Weak positive correlation between HbA1c values by HPLC and I Chroma. Dark solid line: tendency line; (A) line equation: y=−0.18+1.03x; (B) y=−3.4+1.5x. These diagrams show better correlation between HbA1c values by DCA-Vantage and HPLC than between HbA1c values by I-Chroma and HPLC. Black dashed line: identity line; gray shadow: 95% confidence bounds. HbA1c expressed in NGSP percentage.")
Correlation. (A) Strong positive linear correlation between HbA1c by HPLC and DCA-Vantage. (B) Weak positive correlation between HbA1c values by HPLC and I Chroma. Dark solid line: tendency line; (A) line equation: y=−0.18+1.03x; (B) y=−3.4+1.5x. These diagrams show better correlation between HbA1c values by DCA-Vantage and HPLC than between HbA1c values by I-Chroma and HPLC. Black dashed line: identity line; gray shadow: 95% confidence bounds. HbA1c expressed in NGSP percentage.
Agreement. To evaluate the agreement of immunoassay data with HPLC, we performed a Bland and Altman analysis.23,24 The mean bias between DCA-Vantage and HPLC was −0.02%±0.29% (−0.2mmol/mol±3.2mmol/mol), 95% Confidence Interval (CI) of the differences [0.55%, −0.60%] (6.0mmol/mol, −6.6mmol/mol) (Fig. 2A), the Bland and Altman diagram also shows a random distribution of the points, 96.5% of them were included within a limit of agreement (dashed lines). The differences between HbA1c values by DCA-Vantage and HPLC ranged from −1.3% (−14.2mmol/mol) to 1.4% (15.3mmol/mol). Nevertheless, the mean bias between I-Chroma and HPLC was −0.50%±1.62% (−5.5mmol/mol±17.7mmol/mol), 95% CI of the differences [2.74%, −3.74%] (30mmol/mol, −40.9mmol/mol) (Fig. 2B), the Bland and Altman diagram shows that only 92.5% of the points were included within a limit of agreement (Fig. 2B, dashed lines). The differences between I-Chroma and HPLC ranged from −7.7% (−61mmol/mol) to 7.6% (60mmol/mol). Together these results show better agreement between HbA1c values obtained by DCA-Vantage and HPLC than between HbA1c results by I-Chroma and HPLC.
, showing random distribution of the points, 96.5% of them were included within a limit of agreement (black dashed line). Agreement between I Chroma and HPLC (B), showing that only 92.5% of the points were included within a limit of agreement (black dashed lines). These diagrams show better agreement between HbA1c values by DCA-Vantage and HPLC than between HbA1c results by I-Chroma and HPLC. Gray solid line: bias. HbA1c expressed in NGSP percentage.")
Agreement. Bland and Altman diagram between DCA Vantage and HPLC (A), showing random distribution of the points, 96.5% of them were included within a limit of agreement (black dashed line). Agreement between I Chroma and HPLC (B), showing that only 92.5% of the points were included within a limit of agreement (black dashed lines). These diagrams show better agreement between HbA1c values by DCA-Vantage and HPLC than between HbA1c results by I-Chroma and HPLC. Gray solid line: bias. HbA1c expressed in NGSP percentage.
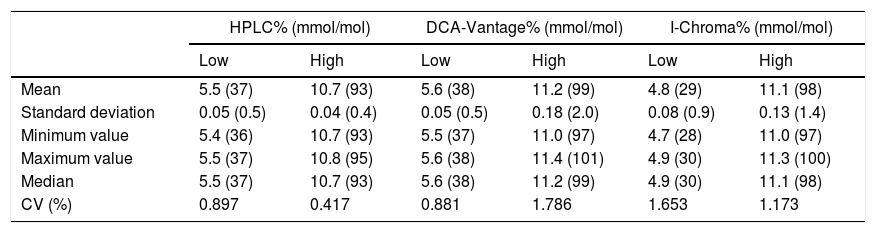
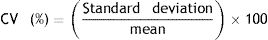
Precision. Precision analysis revealed that CV was below 2% for high and low HbA1c levels, in all methods studied (Table 3). CV by HPLC was 0.897% in low-level samples and 0.417% in high-level samples. CV by DCA-Vantage was 0.881% in low-level samples and 1.786% in high-level samples. By I-Chroma, CV was 1.653% in low-level samples and 1.173% in high-level samples (Table 3). These results indicate a high precision in all the methods studied.
Precision analysis.
| HPLC% (mmol/mol) | DCA-Vantage% (mmol/mol) | I-Chroma% (mmol/mol) | ||||
|---|---|---|---|---|---|---|
| Low | High | Low | High | Low | High | |
| Mean | 5.5 (37) | 10.7 (93) | 5.6 (38) | 11.2 (99) | 4.8 (29) | 11.1 (98) |
| Standard deviation | 0.05 (0.5) | 0.04 (0.4) | 0.05 (0.5) | 0.18 (2.0) | 0.08 (0.9) | 0.13 (1.4) |
| Minimum value | 5.4 (36) | 10.7 (93) | 5.5 (37) | 11.0 (97) | 4.7 (28) | 11.0 (97) |
| Maximum value | 5.5 (37) | 10.8 (95) | 5.6 (38) | 11.4 (101) | 4.9 (30) | 11.3 (100) |
| Median | 5.5 (37) | 10.7 (93) | 5.6 (38) | 11.2 (99) | 4.9 (30) | 11.1 (98) |
| CV (%) | 0.897 | 0.417 | 0.881 | 1.786 | 1.653 | 1.173 |
HbA1c values are expressed as NGSP percentage and as mmol/mol. Low: low-level-sample with HbA1c<6.5%. High: high-level-sample with HbA1c>6.5%. CV: coefficient of variation.
HbA1c measurements by DCA-Vantage were comparable to HPLC, maintaining a strong and positive correlation, appropriate precision and low bias. Whereas I-Chroma assay was precise but inaccurate.
HbA1c immunoassays have been validated and they were globally accepted to quantify HbA1c.10–14,21 Point-of-care (POC) equipment measure HbA1c from a drop of blood, the results are available in few minutes and allow to achieve more timely treatment changes.12–14,16,21 POC testing was used at outpatient clinics improving the metabolic control of DM patients including in rural areas, however, this technology has not been recommended for DM diagnosis.12–14,17,21,22,26 DCA-Vantage, a POC equipment, has been certified by NGSP in other countries, but it has not yet been internationally certified neither in our laboratory nor in Ecuador.22,27,28 Some disadvantages of DCA-Vantage were attributed to handling by untrained operators and lack of quality controls,12 to solve this problem, the equipment was handled by trained personnel, using materials and machines provided by Siemens's representatives in Ecuador. DCA-Vantage was also questioned because of differences in HbA1c results according to the batches of cartridges used,29 however, later HbA1c levels were endorsed in the NGSP quality criteria, using different batches of cartridges.30 In this study all samples were processed with the same batch of cartridges to overcome lot-to-lot variability and all HbA1c measurements were performed in the laboratory, nevertheless, ours results showed that a smaller range of differences would be desirable. We used HPLC as a reference method for HbA1c quantification because of its accuracy, precision and linearity.12,13,21,28 The HPLC equipment, utilized in this study, was provided by the same manufacturers (BioRad) that supplied several internationally certified laboratories worldwide, and the precision level was optimal, consistent with the strengths of our reference method.12,13,21,27,28 Lack of a reference assay framed in HbA1c international certification programs is a weakness of this study, but still in Ecuador no laboratory was internationally certified by the programs currently available.22,27,28 To our knowledge, no published reports described I-Chroma immunoassay, it was certified by NGSP, but not in Ecuador.28 Given that in our country some clinical laboratories utilize this method, it was selected for our study. The HbA1c measured by I-Chroma were different and weakly correlated from those measured by HPLC, false positives values were high and the range of differences between HbA1c measured by I-Chroma and HPLC were unacceptable. Hemoglobin variants may induce interferences in HbA1c assays,9,12–14,22 but samples with hemoglobinopathies were excluded.
In conclusion, DCA-Vantage immunoassay has better performance than I-Chroma immunoassay. However, our findings suggest that is convenient to evaluate the HbA1c assays commercially available in places where high performing methods might not be readily available. A multidisciplinary working group including state, social security and private experts might optimize the quality of HbA1c results in our country, Ecuador.
FundingThis work was supported by the Secretary of Education Superior, Science, Technology and Innovation of Ecuador (Secretaría de Educación Superior, Ciencia, Tecnología e Innovación de Ecuador, Senescyt), Prometeo Project (2013–2017 Awards), and State University of Milagro (Universidad Estatal de Milagro), Milagro, Guayas, Ecuador. Grants: UNEMI-OCAS-SO-27092013-N°26 DV2013–2014, UNEMI-OCAS-SO-03072014-N8-DV2014-2015 and UNEMI-OCAS-SO-30052016-N5-DV2015-2017.
Conflict of interestNone declared.
We would like to thank Dr. Vicenta Cevallos, Laboratory Interlab SA, principal branch, Guayaquil, Ecuador, for helping us in the HbA1c measurements by HPCL. We also thank all people, organizations and libraries that allow to reach the published scientific knowledge for free. Portions of this work were presented at the 79th American Diabetes Association Scientific Sessions, 2019.
This work was framed in the clinical trial (NCT02237352), that is currently on-going in Ecuador.
