


Malnourishment can be caused by either a lack of food or an excess of low-nutrient foods. Due to several factors, this predisposes children to academic failure. The objective of this study is to estimate the prevalence of school children with eating problems, study their nutrition level, food quality in the diet, and level of physical activity.
Material and methodsThe study involved the school children between 3 months and 16.5 years of age in the municipalities of Centelles, Hostalets de Balenyà and Sant Martí de Centelles. Personal, age, nutrition and physical activity data were collected for the descriptive and bivariate analyses.
ResultsA total of 1374 children were included, of which 122 were under 3 years of age (8.9%). Obesity was recorded in 2.5%, while 17.2, 15.6 and 64.8% were overweight, underweight and of normal weight, respectively. The remaining 1252 children were over 3 years of age (91.1%), and obesity was recorded in 8.1%, while 26.1, 11.0 and 62.9% were overweight, underweight and of normal weight, respectively. Adherence to the Mediterranean diet decreased significantly with increasing age. The maintenance of body weight was significantly correlated to the consumption of carbohydrates for breakfast before going to school, daily fruit consumption, and not having a need for care from the social services. The differences in physical activity and a sedentary lifestyle proved significant between males and females.
ConclusionBeing underweight and overweight are factors related to eating habits and dependency upon the social services.
La malnutrición puede deberse tanto a la falta de alimentos como al exceso de alimentos poco nutritivos. Ello predispone al niño, por diversos factores, a un fracaso escolar. El objetivo de este estudio es estimar la prevalencia de niños escolarizados con dificultades alimentarias, estudiar el grado de nutrición, la calidad alimentaria de la dieta y el grado de actividad física.
Material y métodosSe estudió la población escolarizada de las poblaciones de Centelles, Hostalets de Balenyà y Sant Martí de Centelles, de 3 meses a 16,5 años. Se recogieron datos personales, antropométricos, nutricionales y de actividad física para la valoración por análisis descriptivo y bivariante.
ResultadosSe estudiaron 1.374 niños, 122 menores de 3 años (8,9%), observándose obesidad en el 2,5%, sobrepeso en el 17,2%, infrapeso en el 15,6% y normopeso en el 64,8% de la muestra, y 1.252 mayores de 3 años (91,1%), observándose un 62,9% de normopeso, un 11,0% de infrapeso y un 26,1% de exceso de peso, del cual un 8,1% se trataba de obesidad. La adherencia a la dieta mediterránea se reduce significativamente con la edad. Se observa una relación significativa para el mantenimiento de un peso corporal el consumo de hidratos de carbono para desayunar antes de ir a la escuela, consumir fruta diariamente y no precisar atención de los servicios sociales. Es significativa la diferencia de actividad física y sedentarismo entre sexos.
ConclusiónEl infrapeso y el exceso de peso son factores relacionados con los hábitos alimentarios y la dependencia de los servicios sociales.
In previous decades, malnourishment was mainly due to excess food, but today it may be due to deficient nutrition because of increasingly precarious working conditions and unemployment, resulting in families finding it difficult to provide a sufficient number of meals of adequate quality. In April 2015, unemployment rates in the study populations were 13.64% in Centelles (C), 17.42% in Hostalets de Balenyà (HB), and 15.5% in Sant Martí de Centelles (SMC).1
According to the World Health Organization (WHO), the term malnourishment refers to deficiencies, excesses, or imbalances in the intake of energy, proteins and/or other nutrients. Its meaning includes both malnutrition and overfeeding. By contrast, malnutrition is defined as a sustained food intake that is inadequate to meet energy requirements, a deficient absorption and/or a deficient biological use of the nutrients taken.2
Malnutrition during childhood has been related to school absenteeism, decreased school performance, and impaired mood and ability to relate to peers and the environment, which predisposes to school failure.3
In order to ascertain nutritional status, food quality, and the physical activity levels of schoolchildren from C, HB, and SMC, a study was conducted, designed by the pediatric, and the dietetic and nutrition team from EBA Centelles and called ALIN 2014.
Subjects and methodsThe study was conducted on the school population of the above mentioned towns aged 3 months to 16 years and a half, from February to June 2014 in children attending nurseries and children at SMC, who accounted for 34.2% of the sample, and from September to December 2014 in children in primary and secondary education at C and HB, who accounted for 65.8% of the sample.
Parents were requested to give their informed consent for the participation of their children in the study. The nutritional and physical activity survey was completed by the families of the children in the second grade or younger, and by the children themselves from the third grade.
Personal particulars: age, sex, school, school year, date of birth, weight, and height at birth.
Anthropometric data: weight and height were individually measured in a room at the school by the same observer using the same calibrated device and following previously established procedures. Weight was measured in grams using a BF Body Complete Beurer scale placed on a stable, flat, and hard surface. Measurements were taken in underwear for preschool children or younger, and with no shoes or vests for those in primary and secondary education. Height was measured with a portable Seca stadiometer, stabilized on a horizontal, stable surface. Measurements were taken in centimeters to the nearest millimeter with the children standing with their shoulders balanced and their arms relaxed at the sides of the body, their feet together, and their heels and the back of their skull in contact with the stadiometer. The children looked straight ahead with the Frankfurt plane parallel to the floor.4
Nutritional data:
- A)
Nutritional survey: the KidMed survey was used,4 along with the weekly frequency of their intake of meat, fish, eggs, and pulses (A.1). In the second phase of the study, the question “Do you eat a piece of fruit or drink fruit juice every day?” was split into two questions: (a) “Do you eat a piece of fruit every day”, and (b) “Do you drink natural fruit juice every day?” (A.1A and A.1B) to ascertain the source of the fruit, which is significant from a nutritional viewpoint. The modified survey still allowed us to combine the answers to get the same results as would have been obtained with the original KidMed survey.
- B)
24hour survey: this was applied by the professional to each child, and was given more relevance the older the age.
Physical activity data: a simplified version of the survey conducted at the “Study of obesity prevalence and intervention on obesity in the pediatric population of the Sant Celoni area”5 was used, and out of school physical activity type and time were recorded.
SubjectsSchoolchildren from the three population studies were enrolled after informed consent from their parents or guardians. Those in secondary education were not included due to their incompatible schedules.
Analytical methodsThe variables calculated included: (1) exact age in days based on the WHO protocol (“examination date”-“birth date”/365.25) and (2) the body mass index z-score (BMIz) using the formula “BMI assessed”−“mean BMI for age”/“SD for age”,6,7 a calculation made subsequently in the absence of children following the indications of the WHO protocol for the COSI initiative.7
The BMIz was used to assess nutritional status because it is an objective parameter that may be easily analyzed statistically8 with the following criteria: underweight (BMIz≤−1SD), normal weight (BMI≥−1SD and 1SD), overweight (BMIz≥+1SD to≤2SD), and obesity (BMIz≥+2SD) (5), based on the WHO growth standards9 (A.3) and on the Spanish Studies of Growth (EEC)10 (A.4).
The data were studied using the WHO and the EEC growth tables. The WHO tables are formulated as a guide to the adequate growth of a child, irrespective of race, while the EEC tables were prepared based on the standard growth of children born in Spain, regardless of whether growth is or not adequate. Because of the different objectives of the two tables, it was finally decided to use the WHO tables instead of the EEC tables as a basis for discussion.
To assess the quality of the Mediterranean diet (MD), the categories established in the KidMed survey were considered with the following criteria: optimum adherence to the MD (8–12 points), need for improvement in the MD (4–7 points), low adherence to the MD (0–3 points).4
An assessment of the parameter related to eating or not eating at school in relation to BMIz was made, both in those attending every day and in those never attending the school canteen, to allow for comparison with the POIBA study.11
The dietitian-nutritionist assessed the food basket provided to families with poor incomes in Centelles based on healthy nutrition guidelines, mean calories needed, and the economic value of the food items.12
Statistical dataStatistical analysis was performed as a descriptive data analysis. Quantitative variables are given as mean and SD, and qualitative variables as frequencies and percentages. Bivariate data analysis was performed using a Chi-square test for comparing qualitative variables and an analysis of variance for comparing values of a quantitative variable between the study groups. Probability values less than 5% were considered statistically significant. STATA/MP 14 (StataCorp) statistical software was used for the analysis.
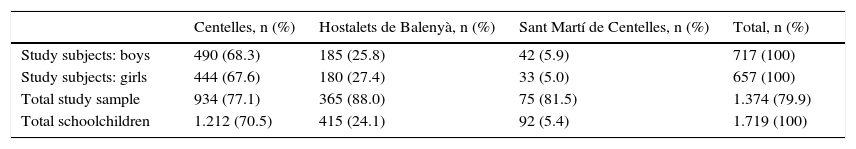
ResultsThe study sample consisted of 1374 schoolchildren aged 3 months to 16.5 years, 934 (77.1%) from C, 365 (88.0%) from HB, and 75 (81.5%) from SMC (Table 1).
Distribution of study subjects.
| Centelles, n (%) | Hostalets de Balenyà, n (%) | Sant Martí de Centelles, n (%) | Total, n (%) | |
|---|---|---|---|---|
| Study subjects: boys | 490 (68.3) | 185 (25.8) | 42 (5.9) | 717 (100) |
| Study subjects: girls | 444 (67.6) | 180 (27.4) | 33 (5.0) | 657 (100) |
| Total study sample | 934 (77.1) | 365 (88.0) | 75 (81.5) | 1.374 (79.9) |
| Total schoolchildren | 1.212 (70.5) | 415 (24.1) | 92 (5.4) | 1.719 (100) |
The relationship between growth evolution and birth weight and height could not be determined because of the few data available.
Anthropometric characteristics of the sampleBoys and girls under 3 years of age accounted for 8.9% of the sample (n=122). Of these, 45.1% were girls (n=55) and 54.9% were boys (n=67), with a mean age of 1.7 years (from 3 months to 3 years).
Boys and girls older than 3 years represented 91.1% of the sample (n=1252). Of these, 49.2% were girls (n=616) and 50.8% were boys (n=636), with a mean age of 8 years (from 3 to 16.5 years). The age distribution of children in the sample was as follows: 36.3% (n=455) were from 3 to 6 years; 24.7% (n=308) were from 6 to 9 years; 27.6% (n=340) were from 10 to 12 years; and 11.4% (n=143) were more than 12 years old.
The study results showed that more than one third of the population had an inadequate BMIz. Thus, 11.0% were underweight, 26.1% had excess weight (which was obesity in 8.1%), and 62.9% had normal weight.
Quality of the Mediterranean dietAdherence to the MD was optimum in 68.9% and needed improvement in 29.4%. Low adherence to the MD was found in 1.7% of children.
Adherence to the MD significantly decreased with age (p≤0.05). Optimum adherence was found in 72.3% of children aged 3–5 years and 61.8% in those over 12 years of age (Fig. 1) (p≤0.05).
The relationship between diet and the body mass index z-score.")
The data showed no relationship between eating at home or school and the BMIz in children both under or over three years of age.
In children of both sexes older than three years, a significant positive relationship for the maintenance of adequate body weight was seen for the following: (1) the consumption of carbohydrates (CH) such as bread, toasts, or cereals for breakfast before going to school, and (2) drinking a fruit juice or eating a piece of fruit daily. By contrast, a significant negative relationship was found for: (1) the consumption of nuts 2–3 times weekly, and (2) the consumption of vegetables twice daily (p≤0.05) (Fig. 2).
.")
However, the parameters that were not significant with the BMIz were related to the health of the subject,13,14 so that it is important to know that 19.4% of the study children did not eat a piece of fruit or drink a natural juice daily, while only 33.0% ate two pieces of fruit daily. As regards vegetables, 28.4% did not eat them every day, and only 30.3% ate vegetables twice daily. On the other hand, 72.5% ate fish 2–3 times weekly; 80.7% ate pulses more than once weekly, but only 28.4% ate them three or more times weekly; 57.3% ate CH as pasta, rice or potatoes five or more times weekly; and 94.5% consumed food fried in olive oil. Breakfast was taken by 92.4% of the children before going to school. Of these, 74.6% took CH, 88.3% dairy products, and 34.2% biscuits or pastries. In addition, 39.5% ate nuts three or more times weekly and 77.1% two portions of dairy products daily, 92.0% did not eat at fast food restaurants at least once weekly, and 11.6% ate sweets every day.
The weekly frequency of food items was four times for meat, twice for eggs, twice for pulses, and twice for fish.
The relationship between physical activity and the body mass index z-scoreThe practice of out-of-school sports was significantly greater the older the child (p≤0.05). Out-of-school sports were practiced by 45.2% of children aged 3–5 years and by 85.2% of children older than 12 years (p≤0.05) (Fig. 3). Girls practiced significantly less out-of-school sport than boys (61% and 69% respectively) and devoted more time to homework (0.8 and 0.68h daily respectively) (p≤0.05) (Fig. 3). However, no significant association was found between out-of-school sports and the BMIz.

The average weekly time devoted to out-of-school physical activity was four times greater in children older than 12 years (3h and 7min) as compared to the group aged 3–5 years (44min). A gradual increase occurs with age, as shown by average times of 1h and 50min for the group aged 6–9 years and 2h and 23min in the group aged 10–12 years.
With regard to sedentary lifestyles, there was no difference in the time spent watching TV between the groups, which was 7–8h per week for all of them. However, the time spent doing homework increased with age from 2h and 24min per week in the group aged 3–5 years to 7h and 12min in the group aged 10–12 years. The group aged 6–9 years spent 5h and 38min doing their homework. Data from the group older than 12 years are not documented.
The relationship between the need for attention from social services and the body mass index z-scoreAmong the 1041 children studied at C, 4.4% were from families that required attention from the social services. Significantly greater rates of underweight and obesity, and significantly lower proportions of normal weight and overweight, were found in these children as compared to those not requiring social services (p≤0.05) (Fig. 4). Children living in HB and SMC were not compared because the relevant data could not be collected.
DiscussionAnthropometric characteristics of the sample
The definition of obesity in children is difficult. In this study, the Quetelet index or the BMI, the ratio of weight (in kg)/height2 (in meters), was used. This is one of the indices used to assess body fat, but it is not an accurate method for distinguishing between lean and fat mass, especially in adolescence. The BMI is a constant figure in adults, but changes with age in children, which represents an added difficulty. Our study classified subjects according to the WHO definition, expressing the BMI as SD, as defined in the Methods section. There are other methods available to determine obesity, normal weight, and underweight, such as the measurement of skin folds and circumferences, but they would make comparison to other studies difficult, as there are not so many data available.15,16
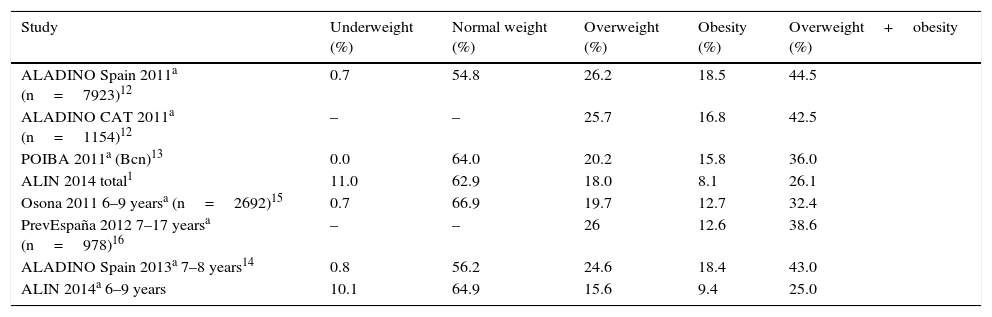
In the group older than 3 years, normal weight was found with a similar frequency to that reported by other studies, and the proportion of children with excess weight (especially obesity) was lower than the mean, but there was a higher proportion of underweight children. Comparing our study with other population studies conducted in Catalonia (ALADINO CAT 201117 Osona 201119), Barcelona (POIBA 201111), and Spain (ALADINO 2011,13 ALADINO 2013,18 and PrevEspaña 201219) (Table 2), the group aged 6–9 years of our study differed from the group of a similar age in the Osona 2011 study in the lower proportion of children with excess weight and the greater rate of underweight (Table 2). Participation in this ALIN 2014 study was optional and required consent from the parents or guardians, so that the families of children with excess weight may have refused participation, with a resulting bias.
Percentage of BMI ranges according to different studies, based on the WHO and EEC growth tables, total sample.
| Study | Underweight (%) | Normal weight (%) | Overweight (%) | Obesity (%) | Overweight+obesity (%) |
|---|---|---|---|---|---|
| ALADINO Spain 2011a (n=7923)12 | 0.7 | 54.8 | 26.2 | 18.5 | 44.5 |
| ALADINO CAT 2011a (n=1154)12 | – | – | 25.7 | 16.8 | 42.5 |
| POIBA 2011a (Bcn)13 | 0.0 | 64.0 | 20.2 | 15.8 | 36.0 |
| ALIN 2014 total1 | 11.0 | 62.9 | 18.0 | 8.1 | 26.1 |
| Osona 2011 6–9 yearsa (n=2692)15 | 0.7 | 66.9 | 19.7 | 12.7 | 32.4 |
| PrevEspaña 2012 7–17 yearsa (n=978)16 | – | – | 26 | 12.6 | 38.6 |
| ALADINO Spain 2013a 7–8 years14 | 0.8 | 56.2 | 24.6 | 18.4 | 43.0 |
| ALIN 2014a 6–9 years | 10.1 | 64.9 | 15.6 | 9.4 | 25.0 |
There has been a change in the evolution of the BMIz: the proportion of underweight has increased and overweight and obesity rates have decreased. This change may be due to several factors, including a decreased intake of unnecessary food, which would facilitate a reduction of total calorie intake and, thus, BMIz decrease. However, there may be nutritional deficiencies with any BMIz range of values, but especially in underweight, overweight or obesity, which is in turn related to the need for assistance from the social services (Fig. 4).
Quality of the Mediterranean dietA comparison of the results of the KidMed study4 in the group aged 2–14 years and those of the ALIN 2014 study in a group aged 3–16.5 years shows in the later a greater percentage of optimum adherence to the MD (47% and 68.9% respectively) and a lower percentage of intermediate (49.5% and 29.4% respectively) and low (2.5% and 1.7% respectively) adherence to the MD.
These results, more positive than those reported in the KidMed study, may give some idea of the value of the effort made by the primary care center of the town, which since 2004 has had a reference dietitian-nutritionist who works to educate children and their families in healthy dietary habits, with invaluable support from pediatricians and pediatric nurses of the center and the commitment of schools and public administration to improve child nutrition.
However, when adequate food intake was evaluated based on the recommendations of the MD, such as the intake of pulses three or more times weekly, and with juice not being considered equivalent to the intake of fruit, then adherence to the MD was optimum in 62.6%, in need of improvement in 35.1%, and low in 2.3% of the children.
Based on the Vilamarxant (Valencia) study,20 the relative risk of having overweight or obesity is 2.47-fold greater in children who do not follow an optimum MD.
Relationship between diet and the body mass indexThe relationship between diet and body weight is not seen within the same parameters in other studies. In the study “Quality of diet and its relation to the BMI and sex in adolescents”,21 conducted on boys and girls in the third year of secondary education, significant differences were found with regard to: (1) the almost daily consumption of pasta or rice; (2) the regular intake of nuts, and (3) the daily consumption of a second piece of fruit; the latter had a negative relation with the BMIz. By contrast, other studies22 correlated lower intakes of fruit, vegetables, fish, dairy products, and cereals to higher BMIz values.
Regarding the frequencies of consumption of meat, fish, pulses, and egg, these were adequate for meat and fish, but the intake of pulses and eggs was below the three times weekly recommended by the guidelines for a Mediterranean, healthy diet.13
Unlike in the ALIN study, the relationship between the BMIz and lunch at school was significant in the POIBA study,11 where overweight and obesity rates were lower in children who had lunch at school as compared to those who did not (16.5% and 21.4% respectively).
Relationship between physical activity and the body mass index z-scoreThe results of the Vilamarxant study,20 conducted in 11-year-old children, as compared to those found at a similar age in the ALIN study, showed similar proportions of children who practiced physical activity (43.4% and 40.0% respectively) and similar times spent in sedentary activities such as watching TV or playing videogames (16.6% and 15.0% respectively). However, when the time spent doing homework was computed as a sedentary activity, the proportion increased to 31.0%.
No significant relationship was found between physical activity and the BMIz, as occurred in the Vilamarxant study,20 but the latter reported that the relative risk of overweight was 2.2-fold greater if sleep time was ≤8h daily.
Relationship between the need for attention from social services and the body mass index z-scoreThe food baskets given to families who require attention from social services were evaluated. The main items included in such baskets are sugars (packs of sugar, biscuits, cocoa powder, fruit juice), flour (used for preparing pastries and for frying), pasta and rice, and a considerable amount of oil. Raw pulses and, to a lesser extent, canned cooked pulses are also available, but families are reluctant to take these because they do not usually eat them and they can be difficult to cook at home because they often find it too expensive to use gas or electricity for a meal. Thus, if only the food items included in the basket are used, the resulting diet will be poor in micronutrients and protein and rich in simple CHs and fat.
An inexpensive weekly basket including products more adequate for health was therefore suggested, composed of the following: 1.5L of milk, 0.5kg of pasta, 0.5kg of rice, 1kg of potatoes, 250g of cheese, 1kg of pulses, 7 pieces of fruit, 0.7kg of vegetables, 1kg of chopped tomato, 0.5kg of bread, half a dozen eggs and, monthly, 1.5L of olive oil per person, providing approximately 2100kcal daily.
ConclusionDietary habits are related to underweight and excess weight, and worsen with the age of children, as they become increasingly independent, and as visits to the pediatrician become less frequent.
The results of this and previous studies4,5,16,18,20–23 demonstrate the need for the collaboration of primary care centers and schools, with the support of physicians and dietitians-nutritionists, to provide education and achieve the changes in habits required to stop the pandemic of overweight, as has been and is being done in other European countries, and to improve the food baskets provided by social services.
Conflicts of interestThe authors state that they have no conflicts of interest.
We gratefully acknowledge the help and collaboration of the teachers and managers of the schools Ildefons Cerdà, Xoriguer, Sagrats Cors, and Niu d’Infants in Centelles, Joan XXI and Roc Petit in Hostalets de Balenyà, and Escola Valldeneu and L’Arc de Sant Martí in Sant Martí de Centelles, and also the parents and the children who collaborated in this study.
Please cite this article as: Aguilà Q, Ramón MÀ, Matesanz S, Vilatimó R, del Moral I, Brotons C, et al. Estudio de la valoración del estado nutricional y los hábitos alimentarios y de actividad física de la población escolarizada de Centelles, Hostalets de Balenyà y Sant Martí de Centelles (Estudio ALIN 2014). Endocrinol Nutr. 2017;64:138–145.
