


Psychological and neuroendocrine alterations are typical characteristics in anorexia nervosa patients. The role of adipokines and cytokines as mediators of body systems’ adaptations to the patients’ abnormal eating behavior is not well understood. The duration of disease seems to be a determinant of nutritional status and associated hormone changes. We aimed to assess whether alterations in adipokines, cytokines and cortisol do already exist in patients with a recent disease onset by means of a case–control study.
MethodsForty-one adolescent female patients on their first-episode and diagnosed with anorexia nervosa, were matched by age and socioeconomic status (SES) (1:1) with healthy girls. Leptin, soluble leptin receptor (sOB-R), adiponectin, cortisol, and the cytokines IL-1β, IL-2, IL-6 and TNF-α were examined.
ResultsThe results showed reduced leptin and increased sOB-R and cortisol levels in AN patients. Adiponectin was also increased but opposite to the previous biomarkers did not correlate with BMI Z-score. Serum TNF-α and IL-2 showed significantly lower and higher values, respectively, in the AN patients than in the controls. Cortisol showed the strongest correlation with sOB-R (r=0.436; P=0.005).
ConclusionsOur study confirms previous findings on adipokine and cortisol alterations in AN patients, while overall cytokine results did not show a clear disruption in AN patients with short disease duration. The results highlight the need to disentangle the role of the sOB-R in the interactions between leptin and cortisol secretion.
Las alteraciones psicológicas y neuroendocrinas son típicas de las pacientes con anorexia nerviosa (AN). El papel de las adipoquinas y citocinas como mediadores de la adaptación del organismo al comportamiento alimentario alterado no es bien conocido. La duración de la enfermedad parece ser un determinante del estado nutricional y de los cambios hormonales asociados. Nuestro objetivo ha sido establecer si existen alteraciones de adipoquinas, citocinas y cortisol en pacientes con un comienzo reciente de la enfermedad en un estudio caso-control.
MétodosCuarenta y una chicas adolescentes diagnosticadas de AN en su primer episodio fueron emparejadas por edad y estado socioeconómico (1:1) con adolescentes sanas. Se midieron la leptina, el receptor soluble de leptina, la adiponectina, el cortisol y las citocinas IL-1β, IL-2, IL-6 y TNF-α.
ResultadosLas pacientes con AN mostraron niveles reducidos de leptina y elevados de receptor de leptina y cortisol. La adiponectina también se observó elevada pero, al contrario que los otros marcadores, no correlacionó con el Z-score del índice de masa corporal. Las pacientes mostraron valores de TNF-α e IL-2 menores y mayores, respectivamente, que las controles. El cortisol y el receptor de leptina mostraron la correlación más fuerte de todas las observadas (r=0,436; p=0,005).
ConclusionesSe confirman los resultados previos de adipoquinas y cortisol en pacientes con AN. Sin embargo, los resultados globales de citocinas no muestran una alteración clara en pacientes con corta duración de la enfermedad. Los resultados apuntan la necesidad de desentrañar el papel del receptor soluble de leptina en las interacciones entre leptina y cortisol.
Anorexia nervosa (AN) is a psychiatric syndrome characterized by self-induced starvation leading to severe weight loss, mainly at the expense of adipose tissue.1 Multiple adaptive mechanisms that seem to change along the course of the illness are triggered.2 In this sense, adipokines and cytokines are among the regulatory molecules that have been appointed as essential contributors to some of the physiological adaptations.3 Specifically, leptin and adiponectin have emerged as the most abundant fat-derived hormones, redefining adipose tissue as a key component not only of the endocrine system, but also of the immune system. While leptin plasma concentrations are markedly reduced in AN patients in comparison to controls,4,5 circulating adiponectin levels show contradictory results in the literature.6 In this sense, the fluctuations in adipokine levels along the course of the treatment have shown associations with the anthropometrical recovery,5 which points out to these biomarkers as useful indicators of treatment response and possibly also of the risk of future relapse. It is known that leptin and adiponectin display effects on immune cells, being leptin an enhancer of immune activation and an up-regulator of inflammatory responses and adiponectin, on the contrary, an inhibitor of pro-inflammatory cytokine production.7 These soluble messengers secreted mainly by immune cells also seem to be altered in AN.8 In these sense, elevated plasma levels of proinflammatory cytokines (IL-1β, IL-6 and TNF-α) have been reported in some studies performed with AN patients when compared to controls9,10 and also in a meta-analysis.11 However, no full consistency exists among studies, many of them having found no alteration in cytokines in comparison with healthy females.12,13 On the other hand, evidence suggests that activation of a bidirectional feedback loop between cytokines and cortisol is central to the appropriate functioning of the hypothalamic–pituitary–adrenal (HPA) axis and elevated serum cortisol levels have been found in AN patients.14 However, elucidating the interplay between the HPA axis and cytokines and regulatory hormones of appetite and weight control in the acute stage of disease development is essential to evaluate if any of these the molecules might be useful to estimate recovery and relapse risks along the course of treatment.
Since the controversial results published with respect to immune markers and regulatory molecules might be associated, to some extent, to the heterogeneity of the patients included in the study groups in terms of age and duration of the disease,11,12,15 we aimed to determine the basal status of these metabolic and immune biomarkers in a homogenous group of patients that were all suffering their first episode of disease. In addition, we have followed a case–control design, based in pairs matched by age and socioeconomic status (SES), aiming to reduce potential confounding factors that might also account for the discrepancies found among previous studies on adiponectin and cytokine levels.
Materials and methodsSubjects and study designA 1:1 matched case–control study was conducted. Adolescent female patients diagnosed with anorexia nervosa participated in the study. All patients were recruited upon admission at the Eating Disorders (ED) Unit, at Niño Jesus Children University Hospital (NJCUH) in Madrid during the years 2010–2013. All patients consecutively admitted and diagnosed in a semi-structured interview were invited to participate in the ANABEL study16 which is a comprehensive study of clinical, familial and biological variables involved in prognosis of ED. The following inclusion criteria were considered: (1) female gender, (2) age range between 12 and 17 years, (3) no specific ED treatment. Exclusion criteria were: (1) patients with a differential diagnosis of any other disease. With these criteria, 114 patients were included in the ANABEL study as explained somewhere else,16 and a subsample of 63 patients was included in the blood biomarkers sub-study based on lymphocyte counts as outcome variable for sample size calculations.17 For the current study of matched case–control pairs, power analysis was based in cortisol, assuming that leptin, adiponectin and related parameters would not present difficulties regarding statistical power because the expected impact of anorexia nervosa on them is higher than for cortisol. Taking as reference the cortisol value of healthy European adolescents published in Perez de Heredia et al.18 and considering 80% statistical power and a minimum expected difference of 20% between AN and C groups, the results showed that 42 matched pairs would be necessary. However, similar sample size calculations for cytokine values produced unfeasible sample sizes due to the very high standard deviation of these biomarkers.18 Among the 63 ED patients with blood biomarker analyses, only patients with a diagnosis of AN were included and exclusion criteria were: (1) patients with no suitable matching control, (2) patients with uncomplete blood sample analyses. All patients were initially diagnosed according to Diagnostic and statistical Manual of Mental Disorders (DSM IV-TR) criteria by clinical interview performed by clinical experts but were later reclassified according to the DSM-519 in order to be in line with current operational criteria. Thus, 33 patients were diagnosed as AN-restricting type (ANR) and 8 patients as AN-binge/purging type (ANP). Most of the patients at study enrolment had been recently admitted for in-hospital treatment (80%) and a lower number were admitted to follow home care hospitalization (15%) and outpatient treatment (5%). Sixty five percent of patients were under psychopharmacological therapy (anxiolytics/antidepressants/antipsychotics) prescribed no more than three weeks before the evaluation. 37% of AN patients take serotonin reuptake inhibitors, 32% take anxiolytics (benzodiazepines) and 7% take second generation antipsychotics. However, 46% of the patients under psychopharmacological therapy had a combination of at least two types of medication.
The control group consisted of 50 healthy female adolescents, free of psychiatric or somatic illness as ascertained by clinical interviews (K-SADS-PL), which were carried out by trained psychologists. These girls participated in the ANOBAS case–control study (PSI2011-23127), which involved the completion of a battery of psychological questionnaires by parents and adolescents. They were recruited from secondary schools (both public and state subsidized) in Madrid through direct response flyers. Psychological reports and blood results were personally delivered to the parents. Adolescents presenting with a psychiatric diagnosis were referred to their corresponding mental health services and were excluded from the study. Each AN case was matched with a control, using age and socioeconomic status (SES) as matching criteria. SES was typified by using the Hollingshead index,20 based on primary caregiver education and occupation. A range from I to V designated the lowest and highest categories of SES. Matching within ±1 year difference was acceptable for age and also matching within adjacent categories for SES. With this criteria 50 case–control pairs where formed but only 41 included AN patients participating in the blood biomarkers sub-study. Thus, 41 pairs where studied in this work.
All procedures performed were in accordance with the ethical standards of the 1964 Helsinki declaration and its later amendments and the Spanish law14/2007 on Biomedical Research. This study was approved by the Ethics Committee of the Niño Jesús Children University Hospital and the Autonomous University of Madrid. Informed consent was obtained from all the parents and guardians of the participants included in the study.
Anthropometrical measurementsAll patients and controls underwent anthropometrical assessment by standard procedures (without shoes and in underwear clothes). Patients’ measurements were performed on their first day of admission or on the following day using a digital electronic weighing scale (Seca 780; 0.100g precision) with an incorporated telescopic measuring rod (Seca 220: 0.5cm precision). From these data, body mass index (BMI) [weight (kg)/height2 (m2)], Z-score of the BMI and ideal body weight percentage (IBW %) were calculated according to the Spanish growth reference Charts.21 Anthropometric measurements in the healthy adolescents were obtained at their schools using a Seca digital weighing scale (Type 799 and 769; 0.100g precision) with height measuring rod.
Biomarkers analysisBlood extractions in patients and controls were performed in the NJCUH. Venous blood samples were obtained between 8 and 9AM, after an overnight fast. Following collection in EDTA-K3E Vacutainer tubes (BD Biosciences), blood samples were centrifuged during 15min at 1300g and 4°C to obtain the plasma. The investigators checked that no subject participating in the study had any vaccine administered within the six weeks prior to the day of blood sampling and that they presented no active infectious episode or were taking immunomodulatory medications. Fasting plasma levels of adipokines (leptin and adiponectin) and cytokines (IL-1β, IL-2, IL-6, TNF-α) were measured by Multiplex immunobead assay technology following the manufacturer's protocol (Milliplex MAP Human Metabolic Hormone panel, Human Adipokine panel and Human high sensitivity Cytokine/Chemokine panel respectively, from Millipore Corp.; Magpix analytical test instrument, Luminex Corp., Austin, TX). The soluble leptin receptor was measured by ELISA (Abnova, Walnut, CA, USA) and cortisol was measured by chemiluminescent microparticle immunoassay using Architect i1000SR kit (Abbott Laboratories, Abbott Park, IL, USA). The minimum detectable concentration for each analyte was as follows: IL-1β, 0.06pg/mL; IL-2, 0.26pg/mL; IL-6, 0.20pg/mL; TNF-α, 0.07pg/mL; leptin, 27pg/mL; adiponectin, 11pg/mL; leptin receptor, 0.04ng/mL; cortisol, 0.40μg/dL. All analyses were performed in different aliquots to avoid freeze-thawing repetitions. Free leptin index (FLI) was calculated as the ratio leptin: sOB-R.
Statistical analysisPrior to statistical analyses, data were examined for normal distribution with the Kolmogorov–Smirnov test. After logarithmic transformation of IL-6, leptin and FLI values and logarithmic transformation of variable plus 1 for TNF-α, all variables were normally distributed. The differences between the AN patients and their matched controls were assessed using a lineal mixed model including “Group (AN or Control)” and “Psychopharmacological treatment (yes/no)”as fixed factors and “Pair” as a repetition factor with random effect. In the same model, “subtype of AN (ANR or ANP)” was included as a nested factor within the AN Group and it was analyzed through a type I hierarchical fixed-effect contrast. Since IL-1β and IL-2 plasma detectable values were only 25% and 49% of the total samples, respectively, we analyze those variables through a conversion to categorical variables. Three levels were defined for each cytokine: undetectable values, “low” and “medium” ranges, seeing that a balanced number of the total detectable data fell in the two latest categories. Subsequently, the distribution of AN and Control data by category was compared using the Chi-square test. Age-adjusted partial correlations were also performed to find significant relationships between cytokines, adipokines, cortisol levels and BMI Z-score in the patients and healthy peers separately. Differences were considered statistically significant at P<0.05. Statistical analysis was performed using the IBM SPSS statistical software version 23.
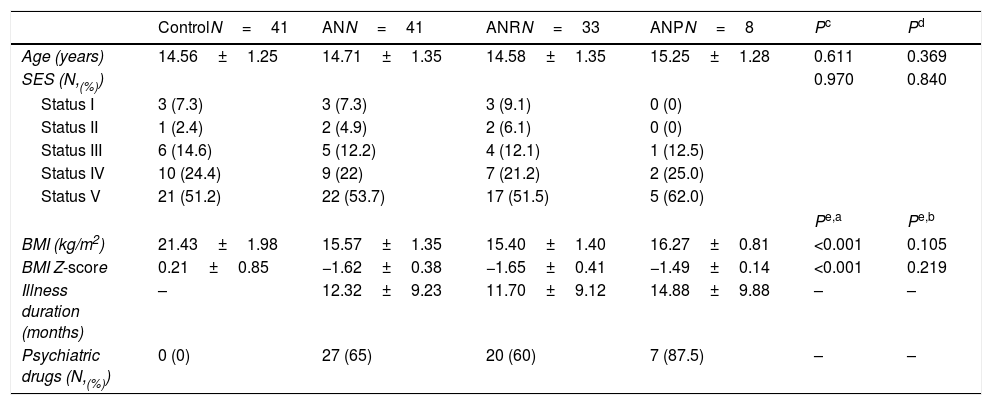
ResultsThe AN patients and controls distribution into the SES categories is shown in Table 1. In 87.8% of the cases for age and 85.4% for SES, couples of the same category were formed. Five AN patients were matched to one-year younger control. Five AN patients were matched with a control in an immediately inferior SES category and one AN patient was matched with a control in an immediately superior SES category. Nevertheless, age and SES distribution was similar in AN and Control groups, as intended (Table 1).
Demographic and anthropometrical parameters in female adolescent patients with anorexia nervosa matched to healthy adolescents.
| ControlN=41 | ANN=41 | ANRN=33 | ANPN=8 | Pc | Pd | |
|---|---|---|---|---|---|---|
| Age (years) | 14.56±1.25 | 14.71±1.35 | 14.58±1.35 | 15.25±1.28 | 0.611 | 0.369 |
| SES (N,(%)) | 0.970 | 0.840 | ||||
| Status I | 3 (7.3) | 3 (7.3) | 3 (9.1) | 0 (0) | ||
| Status II | 1 (2.4) | 2 (4.9) | 2 (6.1) | 0 (0) | ||
| Status III | 6 (14.6) | 5 (12.2) | 4 (12.1) | 1 (12.5) | ||
| Status IV | 10 (24.4) | 9 (22) | 7 (21.2) | 2 (25.0) | ||
| Status V | 21 (51.2) | 22 (53.7) | 17 (51.5) | 5 (62.0) | ||
| Pe,a | Pe,b | |||||
| BMI (kg/m2) | 21.43±1.98 | 15.57±1.35 | 15.40±1.40 | 16.27±0.81 | <0.001 | 0.105 |
| BMI Z-score | 0.21±0.85 | −1.62±0.38 | −1.65±0.41 | −1.49±0.14 | <0.001 | 0.219 |
| Illness duration (months) | – | 12.32±9.23 | 11.70±9.12 | 14.88±9.88 | – | – |
| Psychiatric drugs (N,(%)) | 0 (0) | 27 (65) | 20 (60) | 7 (87.5) | – | – |
Values are expressed as mean±SD.
BMI, body mass index; ANR: AN restricting type; ANP: AN binge eating-purging type; SES, socioeconomic status according to Hollingshead index.20
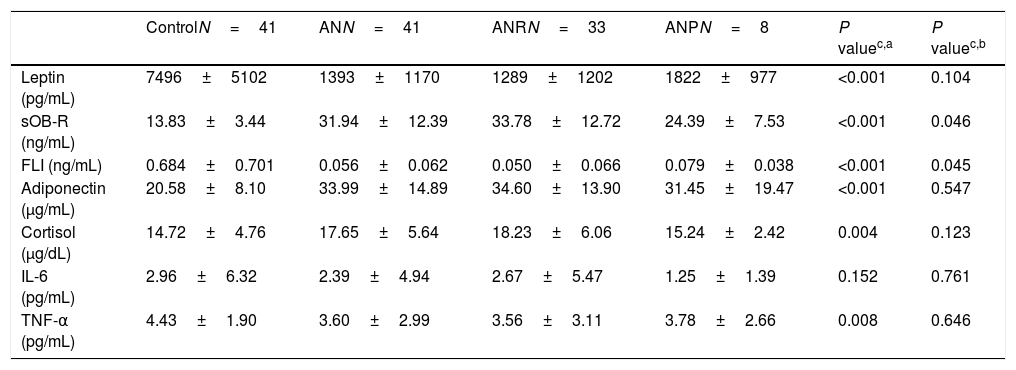
Malnutrition in AN patients is evidenced by BMI Z-score values as shown in Table 1. Leptin levels were very significantly lower in AN patients than in their controls while leptin receptor, adiponectin and cortisol concentrations were significantly higher (Table 2; Fig. 1). No differences were found between AN subtypes in adipokine values, although there was a trend for increased leptin receptor levels in ANR compared to ANP together with lower FLI values.
Adipokine, cortisol and cytokine levels in female adolescent patients with anorexia nervosa matched to healthy adolescents.
| ControlN=41 | ANN=41 | ANRN=33 | ANPN=8 | P valuec,a | P valuec,b | |
|---|---|---|---|---|---|---|
| Leptin (pg/mL) | 7496±5102 | 1393±1170 | 1289±1202 | 1822±977 | <0.001 | 0.104 |
| sOB-R (ng/mL) | 13.83±3.44 | 31.94±12.39 | 33.78±12.72 | 24.39±7.53 | <0.001 | 0.046 |
| FLI (ng/mL) | 0.684±0.701 | 0.056±0.062 | 0.050±0.066 | 0.079±0.038 | <0.001 | 0.045 |
| Adiponectin (μg/mL) | 20.58±8.10 | 33.99±14.89 | 34.60±13.90 | 31.45±19.47 | <0.001 | 0.547 |
| Cortisol (μg/dL) | 14.72±4.76 | 17.65±5.64 | 18.23±6.06 | 15.24±2.42 | 0.004 | 0.123 |
| IL-6 (pg/mL) | 2.96±6.32 | 2.39±4.94 | 2.67±5.47 | 1.25±1.39 | 0.152 | 0.761 |
| TNF-α (pg/mL) | 4.43±1.90 | 3.60±2.99 | 3.56±3.11 | 3.78±2.66 | 0.008 | 0.646 |
Mean±SD. FLI: free leptin index.

Adipokines, cortisol and cytokine levels in AN patients and controls. Scatter dot plots show individual data in each group and lines represent the median and interquartile range for each data set. Significant differences show the “group effect” as calculated by lineal mixed model including “group” and “psychiatric drugs” as fixed factors, “pair” as a repetition factor with random effect and “subtype of ED” as a nested factor.
Significant correlations between adipokines and BMI Z-score were found, both in patients and controls, for leptin and sOB-R but not between adiponectin and the BMI Z-score.
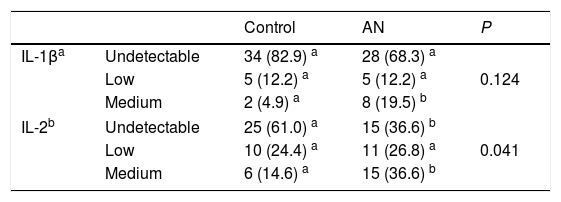
Regarding cytokines, TNF-α levels were significantly lower in patients than in their matched controls but no differences were observed for IL-6 and IL-1β plasma concentrations between both groups (Tables 2 and 3; Fig. 1). IL-1β was detectable in only 25% (N=20) of the total samples and while the overall distribution of values in the set of ranges was similar in both groups (P=0.124), the proportion of patients with “medium” levels (20%, N=8) was higher than in the controls (5%, N=2) (Table 3). Similarly, differences between groups were observed for IL-2. The proportion of patients with detectable values was higher (63%, N=26) than in controls (39%, N=16) and also de proportion of patients with “medium” levels was higher in the AN patients (36.6%, N=15) than in the controls (14.6%, N=6).
IL-1 β and IL-2 levels in female adolescent patients with anorexia nervosa matched to healthy adolescents.
| Control | AN | P | ||
|---|---|---|---|---|
| IL-1βa | Undetectable | 34 (82.9) a | 28 (68.3) a | 0.124 |
| Low | 5 (12.2) a | 5 (12.2) a | ||
| Medium | 2 (4.9) a | 8 (19.5) b | ||
| IL-2b | Undetectable | 25 (61.0) a | 15 (36.6) b | 0.041 |
| Low | 10 (24.4) a | 11 (26.8) a | ||
| Medium | 6 (14.6) a | 15 (36.6) b | ||
Data show number of subjects and percentage in brackets.
No correlations were found between cytokine concentrations and BMI Z-score, in the patients or in the controls. No correlations were found either between cytokines and adipokines in any of the study groups. The correlation between leptin and sOB-R was observed both in AN and control groups. Moreover, a positive correlation was found between cortisol and sOB-R (r=0.436; P=0.005), whereas an inverse correlation was detected between cortisol and BMI Z-score (r=−0.403; P=0.010). Both associations were also observed in ANR type patients but not in the healthy peers.
DiscussionOur study, performed in adolescent patients in the early stage after onset of the disease has revealed significant changes in adipokines and cortisol levels compared to their control peers and scarce differences in basal cytokine levels.
As expected, serum leptin concentration was found highly perturbed in the AN patients. Our results showed leptin values 81.42% lower than in their matched controls, which is in agreement with numerous studies performed in AN.1,4,5 Leptin changes are believed to be partly responsible for changes in neuroendocrine axes during restricted energy intake circumstances.22 In this sense, it is worth mentioning also the role of the sOB-R in energy homeostasis through the regulation of leptin bioavailability. Studies invivo23 and invitro24 showed that sOB-R inhibits leptin-binding to cell surface receptors, neutralizing leptin-mediated STAT3 signaling and anorexic responses in vivo. Increased sOB-R and decreased FLI are in agreement with previous studies.4,25 Moreover, the highly significant correlation found in this study between cortisol and sOB-R, which is in agreement with the findings of Kratzsch et al.,25 reinforces the need to disentangle the role of the sOB-R in leptin function regulation and in the interactions between leptin and cortisol secretions.
Although adiponectin is a well studied adipokine in AN patients, published data show variable results.4,6,26 In the current study, adiponectin level was significantly higher (65.16% higher) in the AN group than in the matched controls, which was similarly found in many previous studies.1,5,27 On the other hand, significant negative correlations between adiponectin and BMI have been found only in certain circumstances,1,27 which seem to arise from groups of AN patients that present high inter-individual heterogeneity in terms of BMI, duration of disease, etc. It has been suggested that a combination of factors including fat mass and temporal delays in the response of adiponectin to changes in body composition might explain adiponectin variability.28
Some authors have pointed out the importance of cytokine involvement in the pathogenesis of ED.8 The cytokine results in this study do not support a basal pro-inflammatory status in our patients, which is in contrast with some previous findings that described elevated plasma levels of proinflammatory cytokines (IL-1, IL-6 and TNF-α) in AN patients.10,11 We found lower values of TNFα in patients than in controls. On the contrary, activation of the TNF-α axis and a negative correlation with BMI and duration of disease were found in a heterogeneous group of AN patients.9 Therefore, we suggest that the precise regulation of pro-inflammatory cytokines at disease onset and during the first episode is different as compared to their status in patients with longer illness duration. However, this is a small group of AN patients studied if the big inter-individual variability in plasma cytokines is taken into account. Thus, a posterior power analysis showed only a 63% statistical power (1-β error=0.63) for the differences observed in TNF-α. Regarding IL-2, the results point toward a conserved production, which is in contrast to other results in the literature that described decreased serum levels29 or a decreased response to a stimulus.30 Our results might be linked to the fact that, despite the lower number of leukocytes, the CD4+ lymphocytes in this group of patients with short duration of disease were not lower than in controls.17 Finally, the trend toward elevated IL-1β might be an early sign of the alteration of the adrenal axis regulation evidenced also by the hypercortisolemic status of the AN patients found in this study as well as in others.14,31 A positive correlation between IL-1β production and cortisol has been previously found, which shows that the counter-regulatory feedback loop between cytokines and cortisol might be deranged in AN patients.31 On the other hand, the inverse relationship between cortisol and BMI Z-score found, suggests a response of cortisol to undernutrition, which was also observed by Misra et al.14 As pointed out by these authors, it can be considered as an adaptive mechanism to maintain euglycemia in a status of low energy availability.
This study has some limitations that should be considered. Firstly, the number of patients is small and especially is insufficient to draw conclusions for the purgative-type AN patients. Since patients were recruited as they were referred to the ED hospital unit, the sample reflects the disparity that is normally found between subtypes incidence at first AN diagnosis. The usefulness of the results shown here is also limited by the cross-sectional nature of the study; however, further work regarding the follow-up of these treated patients would soon and hopefully provide new scientific evidences of biomarkers evolution in response to treatment.
In conclusion, the alterations of adipokines and cortisol reported in the literature are confirmed with this case–control study in adolescent onset AN patients. However, the alteration of pro-inflammatory cytokines was not confirmed, which suggests that the increase in these cytokines might occur in patients with a longer duration of the illness. However, these results should be taken with caution due to the scarce sample size for cytokine analysis. Finally, the associations found for cortisol with BMI Z-score and sOB-R point toward an interaction between the HPA axis and leptin function driving the early adaptations to energy restriction. Thus, a longitudinal study of adipokines and cortisol in this homogeneous group of patients is warranted in order to find out if follow-up measurements can predict good and poor treatment response and be used as prognostic factors.
FundingThis project received grants from the Ministry of Health (FIS PI08/1832), the Ministry of Innovation and Science (MICINN PSI2011-23127) and Alicia Koplowitz Foundation (2009).
Conflict of interestThe authors declare that they have no conflict of interest.
