


Fibromyalgia is a form of non-articular rheumatic disorder of unknown origin. It is characterized by widespread, chronic musculoskeletal pain. Patients with fibromyalgia suffer more frequently eating disorders, obesity, metabolic syndrome, and other gastrointestinal symptoms. Studies have pointed out to nutrition as a relevant factor in these patients. Some of them think that diet has an influence on fibromyalgia symptoms, and tend to adopt certain dietary patterns. This, combined with access to non-scientific information about diets and supplements, makes analysis of dietary behavior, avoidance, and restrictions particularly important. The aim of this study was to describe dietary habits and eating avoidance behaviors in patients with fibromyalgia, and to compare these data to those of a healthy sample of similar sociodemographic characteristics.
MethodsA descriptive case–control study was conducted in healthy subjects (n=60) age and sex-matched to the fibromyalgia group (n=60), whose eating habits and restrictions were analyzed using a food frequency questionnaire, a sociodemographic questionnaire, and a food restriction scale.
ResultsThe group with fibromyalgia had significantly higher values in body mass index, weight fluctuation, use of herbal products, and development of diets, and significantly lower mean consumption of cereals, fruits, sugars, alcohol, and soft drinks.
ConclusionsThese results describe a sample of patients with fibromyalgia who follow a varied diet similar to that of healthy subjects, but more frequently avoid certain foods.
La fibromialgia es una forma de reumatismo no articular de origen desconocido, caracterizado por dolor musculoesquelético difuso y crónico. Estos pacientes sufren con mayor frecuencia desórdenes alimentarios, obesidad, síndrome metabólico y algunos síntomas grastrointestinales. Diferentes estudios han señalado la nutrición como factor relevante en estos pacientes, los cuales, creyendo que la dieta influye en sus síntomas, tienden a adoptar determinados patrones dietéticos. Esto, unido al acceso a información no científica acerca de dietas y suplementos, hace que resulte especialmente importante un análisis de sus conductas alimentarias, evitaciones y restricciones. El objetivo del presente estudio es describir los hábitos dietéticos y conductas de evitación alimentaria en pacientes con fibromialgia, y comparar estos datos con los de una muestra sana de características sociodemográficas similares.
MétodosEstudio descriptivo de caso control formado por personas sanas (n=60) apareadas en edad y género con el grupo con fibromialgia (n=60), cuyos hábitos alimenticios y restricciones fueron analizados a través de un cuestionario de frecuencia de consumo de alimentos, cuestionario sociodemográfico y escala de restricción alimentaria.
ResultadosSe observaron cifras significativamente superiores para el grupo con fibromialgia en el índice de masa corporal, la fluctuación del peso, el consumo de productos de herboristería y el desarrollo de dietas. El consumo de cereales, frutas, azúcares, alcohol y refrescos mostró medias significativamente menores para dicho grupo.
ConclusionesEstos resultados describen una muestra de pacientes con fibromialgia que lleva a cabo una dieta variada similar a la de la muestra sana, aunque con mayores evitaciones en determinados alimentos.
Compared with healthy individuals, adults with fibromyalgia (FM) are more likely to experience eating disorders, obesity, metabolic syndrome and other gastrointestinal manifestations such as abdominal pain, dyspepsia or prolonged gastric emptying.1–4
In this regard, certain digestive problems such as irritable colon, periods of nausea and/or vomiting, altered bowel habit, stomach pain, flatulence and even bloating and cramps after meals constitute other characteristic and little studied alterations in patients with FM.4 On the other hand, certain food intolerances or allergies, or the appearance of symptoms mainly upon consuming bread, milk and fruit, appear to be more common in individuals with FM.5,6
Due to the lack of a fully effective treatment for FM, the management approach usually includes pharmacological and non-pharmacological measures.7
A number of studies have pointed to nutrition as a factor to be taken into account in patients with FM, with emphasis on different aspects. In this regard, some studies have examined the greater prevalence of overweight, obesity and eating disorders among the population with FM8,9 or the relationship between a high body mass index (BMI) and worsened patient quality of life, with emphasis on the need to maintain normal body weight.1,10
Some authors describe the existence of nutritional deficiencies or imbalances in such patients.5 While some studies have reported positive effects with nutritional supplements in FM, the results are inconclusive.11 The same applies to the use of traditional Chinese herbal remedies.7,12
Other studies point to the potential benefits of nutrients with antioxidant effects, which can be obtained either through vegetarian diets13 or from food supplements such as anthocyanin or soy.12 Alternatively, they recommend the elimination of stimulants from the diet, though there is no evidence to support this avoidance strategy.14
Intestinal bacterial overgrowth has also been related to FM. In addition to the existence of similar manifestations, different findings support the hypothesis of a role of intestinal bacterial overgrowth in FM, especially in those patients that experience gastrointestinal symptoms. This in turn has led to studies on the efficacy of bifidobacteria and certain probiotic combinations in such patients, with promising results.15
According to a review carried out by Slim et al.,4 a considerable percentage of patients with FM believe that dietetic interventions have a strong impact upon the symptoms of the disease, and describe a worsening of the symptoms when certain foods are consumed. As a result, there is a general tendency to adopt certain eating habits with the purpose of improving symptoms control.6
On the other hand, while patients with FM can obtain information about various treatments for their disease from the news media, television, patient associations or the internet, few of them are based on hard scientific evidence.2,14 This is the case with food supplements, elimination diets, and the avoidance and/or restriction of certain foods, whether upon recommendation or through personal initiative.5,14
In view of the above, and taking into account the great amount of non-scientific information regarding the supposedly beneficial diets and supplements to which people with FM have access, it is particularly important to conduct an analysis of the eating behavior and dietetic habits, as well as the avoidance and restriction practices, of these patients.
The present study was carried out to describe the eating habits and food avoidance behavior of patients with FM, and to compare these data with those of a sample of healthy individuals of similar sociodemographic characteristics.
Material and methodsParticipantsA descriptive case–control study of healthy individuals versus a group of age- and gender-matched patients with FM was carried out.
Since the gender distribution of FM in Spain is 20 female cases for every male case, a female sample was selected. This criterion was adopted to ensure greater uniformity, eliminating gender-related differences in the nutritional parameters.
Likewise, in order to reduce differences in dietetic requirements related to age, we excluded individuals under 40 years of age and over 65 years of age. We also excluded patients diagnosed with eating disorders or other diet-influencing conditions such as diabetes, arterial hypertension, chronic renal failure and celiac disease, as well as those with some condition such as pregnancy, or who performed activities such as athletics requiring changes in diet.
Thus, in addition to the female gender, the inclusion criteria were patient age between 40 and 65 years, Spanish citizenship, informed consent to participation in the study and, in the case of the FM group, a diagnosis of the disease according to the criteria of the American College of Rheumatology.16
Compliance with these criteria was checked before the administration of the questionnaires. A total of 60 women with FM finally completed the questionnaires. Likewise, we recruited 60 subjects similar to the patients with FM in terms of age and gender, from different locations (study centers, women's associations, healthcare centers, university and shopping centers).
All participants signed the informed consent document, and the study protocol was approved by the Human Research Bioethics Committee of the University of Almería (Spain).
Study variablesThe evaluation of eating habits was carried out by an investigator based on a food frequency questionnaire (FFQ). This assesses food intake with the purpose of exploring the association between diet and disease, and affords information on regular eating habits over the long term, while being inexpensive, rapid and easy to apply. We used the Spanish version of the questionnaire, validated for the adult Spanish population by Trinidad Rodríguez et al.17 Calculation of the daily grams consumed was based on the weights of the usual servings, the foods being grouped into categories.
As a food restriction indicator we used the food restriction scale (FRS) in its validated Spanish version.18 This scale comprises 10 items grouped into two subscales. The subscale “concern about diet” evaluates the tendency of a person to restrict eating and the fear of putting on weight. The subscale “weight fluctuations” in turn registers the reported changes in body weight. Globally, the variations in the FRS score–particularly at the higher levels–have been related to a chronic tendency to restrict eating due to exacerbated fear of weight gain. The median obtained for the total group was used to classify the participants into restrictive or non-restrictive individuals.
Likewise, an ad hoc questionnaire was developed to obtain sociodemographic and health information, as well as data on the use of food supplements, alternative therapies and the following of diets. We also asked the patients whether the avoidance of certain foods was related to the appearance or worsening of certain symptoms, or to information obtained encouraging their elimination from the diet.
Data analysisThe data were analyzed using the SPSS version 22 statistical package. Descriptive variables were reported as frequencies and percentages, and the chi-squared test and likelihood ratio were used to explore associations between variables. The normal distribution of the quantitative variables was evaluated using the Kolmogorov–Smirnov test. Since non-normal distribution was confirmed, the variables were analyzed using the Mann–Whitney U-test and analysis of variance (ANOVA), with reporting of the values as the mean and standard deviation (SD).
For the analysis of avoidance, 25% of the mean monthly servings in the healthy subjects group (control group) for the food group in question were used as reference, avoidance being defined as a number of monthly servings below that number.
ResultsThe total study sample consisted of 120 women between 40 and 65 years of age, with a mean age of 53.12±7.00 years.
There were no statistically significant differences between the two groups in terms of the sociodemographic variables. The two populations were therefore considered to be comparable. However, significant differences between the two groups were observed in relation to the BMI (p<0.05), with higher values in the FM group (Table 1).
Sociodemographic characteristics and FRS scores of the study groups.
| FM (n=60) Mean±SD | CG (n=60) Mean±SD | Z | p | |
|---|---|---|---|---|
| Age | 53.93±6.14 | 52.32±7.74 | −1.272 | 0.203 |
| Years of disease | 9.70±5.41 | – | – | – |
| Height (cm) | 158.20±4.93 | 159.70±5.59 | −1.646 | 0.100 |
| Weight (kg) | 68.87±13.98 | 65.78±13.66 | −1.351 | 0.177 |
| BMI | 27.46±5.05 | 25.73±4.81 | −1.995 | 0.046 |
| Concern about diet (ERA) (0–19) | 6.77±3.95 | 6.38±2.41 | −0.587 | 0.557 |
| Weight fluctuations (ERA) (0–16) | 6.63±3.40 | 4.92±2.65 | −2.504 | 0.012 |
| Total ERA (0–35) | 13.40±4.48 | 11.43±4.33 | −1.930 | 0.054 |
| Frequency | % | Frequency | % | Chi2 | p | |
|---|---|---|---|---|---|---|
| BMI | 4.648 | 0.098 | ||||
| Normal weight | 22 | 36.7 | 33 | 55.0 | ||
| Overweight | 22 | 36.7 | 13 | 21.7 | ||
| Obesity | 16 | 26.7 | 14 | 23.3 | ||
| FRS | 1.637 | 0.201 | ||||
| Restrictive | 28 | 46.7% | 35 | 58.3% | ||
| Non-restrictive | 32 | 53.3% | 25 | 41.7% | ||
| Gender | ||||||
| Females | 60 | 100 | 60 | 100 | – | |
| No. pregnancies | 6440 | 0.376 | ||||
| 0 | 10 | 16.7 | 12 | 20 | ||
| 1 | 5 | 8.3 | 8 | 13.3 | ||
| 2 | 23 | 38.3 | 18 | 30 | ||
| 3 | 8 | 13.3 | 15 | 25 | ||
| 4 | 8 | 13.3 | 5 | 8.3 | ||
| 5 | 4 | 6.7 | 1 | 1.7 | ||
| 6 | 2 | 3.3 | 1 | 1.7 | ||
| Occupation | 7.863 | 0.248 | ||||
| Housewife | 18 | 30 | 19 | 31.7 | ||
| Cleaner | 14 | 23.3 | 7 | 11.7 | ||
| Agriculture | 6 | 10 | 3 | 5 | ||
| Education | 3 | 5 | 7 | 11.7 | ||
| Administration | 2 | 3.3 | 7 | 11.7 | ||
| Healthcare | 11 | 18.3 | 10 | 16.7 | ||
| Shop worker | 6 | 10 | 7 | 11.7 | ||
SD: standard deviation; FRS: food restriction scale; CG: healthy control group; FM: fibromyalgia group; BMI: body mass index; Z: Mann–Whitney U-test.
With regard to the food restrictions assessed with the FRS, statistically significant differences were noted in the weight fluctuations subscale (p<0.05). No significant differences were observed between the two groups on taking the median of the global sample (13 in our case) as the cut-off point for distinguishing between restrictive subjects (n=57) and non-restrictive subjects (n=63) (Table 1).
Both the consumption of herbal products and the use of diets were significantly greater in the FM group, despite the fact that certain products such as soy (consumed by 30% of the sample) or mint tea (25%) were not associated with symptoms improvement according to most patients (Table 2).
Food supplements and herbal products.
| FM (n=60) | Effective | % | CG (n=60) | % | Chi2 | p | ||
|---|---|---|---|---|---|---|---|---|
| Yes | No | |||||||
| Herbal products | 28.134 | 0.000 | ||||||
| Yes | 52 | 22 | 30 | 87 | 24 | 40 | ||
| No | 8 | 13 | 36 | 60 | ||||
| Type of product | 27.969 | 0.022 | ||||||
| Lime blossom | 16 | 8 | 8 | 26.6 | 5 | 8.3 | ||
| Fish oil | 2 | 0 | 2 | 3.33 | 0 | – | ||
| Seaweed | 5 | 0 | 5 | 8.3 | 0 | – | ||
| Cartilage | 8 | 5 | 3 | 13.3 | 0 | – | ||
| Hypericum | 4 | 1 | 3 | 6.6 | 0 | – | ||
| Brewer's yeast | 8 | 4 | 4 | 13.3 | 1 | 1.6 | ||
| Chamomile | 5 | 4 | 1 | 8.3 | 8 | 13.3 | ||
| Onagra | 8 | 7 | 1 | 13.3 | 1 | 1.6 | ||
| Passiflora | 5 | 3 | 2 | 8 | 0 | – | ||
| Garlic pearls | 6 | 3 | 3 | 10 | 0 | – | ||
| Mint | 15 | 5 | 10 | 25 | 5 | 8 | ||
| Propolis | 5 | 0 | 5 | 8 | 1 | 1.6 | ||
| Rosemary | 4 | 3 | 1 | 6 | 0 | – | ||
| Soy | 18 | 7 | 11 | 30 | 3 | 5 | ||
| Valerian | 16 | 9 | 7 | 26.6 | 6 | 10 | ||
| Supplements | 0.178 | 0.673 | ||||||
| Yes | 16 | 26.6 | 14 | 23.3 | ||||
| No | 44 | 73.3 | 46 | 76.6 | ||||
| Type of supplement | 10.065 | 0.185 | ||||||
| Schüssler | 2 | 0 | 2 | 3.3 | 1 | 1.6 | ||
| Silica | 6 | 4 | 2 | 10 | 0 | – | ||
| Q10 | 4 | 0 | 4 | 6.6 | 3 | 5 | ||
| Calcium | 6 | 6 | 0 | 10 | 4 | 6.6 | ||
| Multivitamins | 23 | 9 | 14 | 38.3 | 18 | 30 | ||
| Magnesium | 3 | 0 | 3 | 5 | 0 | – | ||
| Others | 12 | 2 | 10 | 20 | 4 | 6.6 | ||
Of note was a greater incidence of avoidances in the FM group, including significant differences in the avoidance of lactose (p<0.05), vegetables (p<0.05), cereals (p<0.05) and caffeine (p<0.01) (Table 3).
Diet, restrictions, symptoms and information sources.
| FM (n=60) | % | CG (n=60) | % | Chi2 | p | |
|---|---|---|---|---|---|---|
| Diet | 4.615 | 0.032 | ||||
| Yes | 12 | 20 | 4 | 6.6 | ||
| No | 48 | 80 | 56 | 93.3 | ||
| Restrictions | 55.958 | 0.001 | ||||
| Spices | 3 | 5 | 1 | 1.6 | 1.745 | 0.309 |
| Acids | 7 | 11.6 | 3 | 5 | 13.333 | 0.186 |
| Salt | 2 | 3.3 | 2 | 3.3 | 0.000 | 1.000 |
| Lactose | 8 | 13.3 | 2 | 3.3 | 3.927 | 0.048 |
| Vegetables | 6 | 10 | 0 | – | 6.316 | 0.012 |
| Cereals | 4 | 6.6 | 0 | – | 4.138 | 0.042 |
| Fats | 38 | 63.3 | 42 | 70 | 0.600 | 0.439 |
| Caffeine | 42 | 70 | 27 | 45 | 7.673 | 0.006 |
| Alcohol | 44 | 73.3 | 34 | 56.6 | 3.663 | 0.056 |
| Symptoms | 91.255 | 0.000 | ||||
| Indigestion | 33 | 55 | 10 | 16.7 | ||
| Excitation | 0 | – | 11 | 18.3 | ||
| Anxiety | 18 | 30 | 1 | 1.7 | ||
| Tension | 3 | 5 | 0 | – | ||
| Pain | 22 | 36.7 | 6 | 10 | ||
| Diarrhea | 10 | 16.7 | 0 | – | ||
| Constipation | 15 | 25 | 6 | 10 | ||
| Tiredness | 1 | 1.7 | 0 | – | ||
| Vomiting | 4 | 6.6 | 0 | – | ||
| Flatulence | 2 | 3.3 | 0 | – | ||
| Insomnia | 2 | 3.3 | 0 | – | ||
| Weight gain | 6 | 10 | 9 | 15 | ||
| Malaise | 1 | 1.7 | 8 | 13.3 | ||
| Headache | 0 | – | 3 | 5 | ||
| Health professionals | 1.948 | 0.745 | ||||
| Physician | 39 | 65 | 8 | 13.3 | ||
| Homeopath | 2 | 3.3 | 0 | – | ||
| Physiotherapist | 1 | 1.7 | 0 | – | ||
| Nurse | 2 | 3.3 | 0 | – | ||
| Communication media | 8.923 | 0.258 | ||||
| Family/friends | 7 | 11.6 | 8 | 13.3 | ||
| TV | 8 | 13.3 | 8 | 13.3 | ||
| Press | 4 | 6.6 | 7 | 11.6 | ||
| Internet | 3 | 5 | 7 | 11.6 | ||
| Radio | 4 | 6.6 | 5 | 8 | ||
CG: healthy control group; FM: fibromyalgia group.
Comparison of food consumption in grams showed significantly lesser mean values in the FM group regarding cereals (p<0.01), fruit (p<0.05), sugar (p<0.05), alcohol (p<0.001) and soft drinks (p<0.01) (Table 4).
Food consumption (grams).
| Percentiles FM | Mean±SD | Percentiles CG | Mean±SD | Z | p | |||||
|---|---|---|---|---|---|---|---|---|---|---|
| 25 | 50 | 75 | 25 | 50 | 75 | |||||
| Dairy products | 142.67 | 241.17 | 328.67 | 230.18±117.52 | 233.66 | 293.33 | 337.83 | 282.43±88.23 | −1.134 | 0.257 |
| Meat | 53.33 | 80.00 | 103.33 | 79.05±28.94 | 53.33 | 83.33 | 126.66 | 95.53±50.67 | −1.318 | 0.187 |
| Fish | 46.66 | 70.83 | 105.00 | 80.05±50.32 | 45.41 | 66.66 | 80.00 | 68.78±29.17 | −1.246 | 0.213 |
| Cereals | 51.33 | 61.33 | 80.17 | 61.12±23.66 | 55.33 | 78.33 | 102.67 | 80.42±32.55 | −3.034 | 0.002 |
| Vegetables | 106.66 | 165.00 | 206.66 | 157.89±58.33 | 106.66 | 160.00 | 220.00 | 155.28±85.25 | −0.263 | 0.793 |
| Fruit | 93.33 | 146.66 | 193.33 | 159.55±82.03 | 106.66 | 200.00 | 233.33 | 195.44±109.75 | −2.175 | 0.030 |
| Sugar | 2.67 | 18.92 | 40.01 | 32.55±43.06 | 16.50 | 23.33 | 70.67 | 41.13±35.26 | −2.287 | 0.022 |
| Alcohol | 0.00 | 0.00 | 0.00 | 7.17±15.37 | 0.00 | 13.33 | 20.00 | 18.56±23.41 | −3.864 | 0.000 |
| Soft drink | 0.00 | 0.00 | 0.00 | 41.94±75.39 | 0.00 | 33.33 | 216.66 | 92.78±130.38 | −2.921 | 0.003 |
| Legumes | 12.00 | 16.00 | 32.00 | 19.27±10.54 | 8.00 | 16.00 | 24.00 | 18.27±8.97 | −0.318 | 0.751 |
| Eggs | 6.42 | 10.08 | 18.33 | 12.89±11.15 | 5.50 | 14.67 | 22.00 | 14.54±10.38 | −0.854 | 0.393 |
SD: standard deviation; CG: healthy control group; FM: fibromyalgia group; Z: Mann–Whitney U-test.
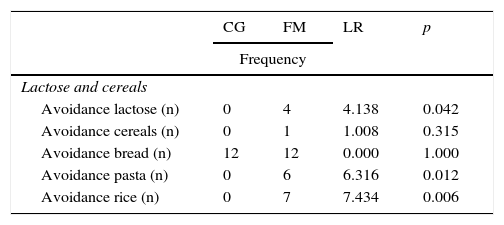
With regard to avoidance, four women with FM were seen to completely avoid lactose (two consumed lactose-free milk and avoided dairy products, while two consumed soy products). This behavior was not observed in the control group (Table 5).
Food avoidance.
| CG | FM | LR | p | |
|---|---|---|---|---|
| Frequency | ||||
| Lactose and cereals | ||||
| Avoidance lactose (n) | 0 | 4 | 4.138 | 0.042 |
| Avoidance cereals (n) | 0 | 1 | 1.008 | 0.315 |
| Avoidance bread (n) | 12 | 12 | 0.000 | 1.000 |
| Avoidance pasta (n) | 0 | 6 | 6.316 | 0.012 |
| Avoidance rice (n) | 0 | 7 | 7.434 | 0.006 |
| Mean±SD | Z | p | ||
|---|---|---|---|---|
| Bread (g) | 29.05±19.91 | 27.30±18.72 | −0.487 | 0.626 |
| Pizza and croquettes (g) | 10.36±9.55 | 6.84±13.57 | −3.311 | 0.001 |
| Rice (g) | 14.74±6.69 | 10.97±7.00 | −2.206 | 0.027 |
| Cereal (g) | 8.19±10.53 | 2.80±6.83 | −3.934 | 0.000 |
| Pasta (g) | 14.47±7.20 | 10.58±5.98 | −2.516 | 0.012 |
| Frequency | LR | p | ||
|---|---|---|---|---|
| Meat and cold meats | ||||
| Avoidance meat (n) | 1 | 2 | 0.342 | 0.559 |
| Mean±SD | Z | p | ||
|---|---|---|---|---|
| Ground meat/sausages (g) | 11.83±12.76 | 6.72±8.38 | −1.893 | 0.058 |
| Veal (g) | 33.92±32.39 | 21.42±16.24 | −1.820 | 0.069 |
| Chicken (g) | 39.33±19.52 | 41.33±23.75 | −0.303 | 0.762 |
| Ham (g) | 10.44±7.21 | 9.58±8.27 | −0.772 | 0.440 |
| Frequency | LR | p | ||
|---|---|---|---|---|
| Fish | ||||
| Avoidance fish (n) | 0 | 2 | 2.034 | 0.154 |
| Mean±SD | Z | p | ||
|---|---|---|---|---|
| Fish (g) | 68.78±29.18 | 80.06±50.33 | −1.246 | 0.213 |
| White fish (g) | 26.00±14.34 | 39.50±20.16 | −3.790 | 0.000 |
| Blue fish (g) | 35.83±21.90 | 34.83±30.99 | −0.807 | 0.420 |
| Shellfish (g) | 6.94±7.74 | 5.72±4.69 | −0.566 | 0.572 |
| Frequency | LR | p | ||
|---|---|---|---|---|
| Sweets | ||||
| Avoidance sweets (n) | 6 | 11 | 1.713 | 0.191 |
| Mean±SD | Z | p | ||
|---|---|---|---|---|
| Sweets (g) | 30.99±28.34 | 24.99±35.38 | −2.120 | 0.034 |
| Ice cream (g) | 9.67±13.92 | 5.44±8.91 | −1.802 | 0.072 |
| Candy | 0.86±1.05 | 0.98±2.60 | −2.958 | 0.003 |
| Frequency | LR | p | ||
|---|---|---|---|---|
| Alcoholic beverages and soft drinks | ||||
| Avoidance alcohol (n) | 15 | 37 | 16.425 | 0.000 |
| Avoidance soft drinks (n) | 21 | 38 | 9.636 | 0.002 |
| Mean±SD | Z | p | ||
|---|---|---|---|---|
| Distilled spirits (g) | 2.39±3.98 | 0.06±0.30 | −4.198 | 0.000 |
| Alcohol-free beer (g) | 13.33±18.04 | 28.22±50.72 | −1.014 | 0.310 |
| Wine (g) | 16.17±21.65 | 7.11±15.35 | −3.559 | 0.000 |
| Beer (g) | 47.62±55.10 | 13.76±29.71 | −4.670 | 0.000 |
| Soft drinks (g) | 92.78±130.38 | 41.94±75.40 | −2.921 | 0.003 |
| Light soft drinks (g) | 65.00±96.15 | 26.67±67.07 | −2.067 | 0.039 |
| Frequency | LR | p | ||
|---|---|---|---|---|
| Fruit and vegetables | ||||
| Avoidance fruit (n) | 2 | 2 | 0.000 | 1.000 |
| Avoidance citrus fruit (n) | 0 | 12 | 13.333 | 0.000 |
| Avoidance vegetables (n) | 5 | 0 | 5.217 | 0.022 |
| Mean±SD | Z | p | ||
|---|---|---|---|---|
| Fruit (g) | 195.44±109.76 | 159.56±82.03 | −2.175 | 0.030 |
| Fresh fruit (g) | 67.00±42.97 | 50.11±32.53 | −1.963 | 0.050 |
| Citrus fruit (g) | 57.83±31.32 | 43.11±33.61 | −2.578 | 0.010 |
| Vegetables (g) | 154.61±86.32 | 157.89±58.34 | −0.263 | 0.793 |
| Salad (g) | 67.00±32.78 | 71.33±25.76 | −0.282 | 0.778 |
| Frequency | LR | p | ||
|---|---|---|---|---|
| Eggs and potatoes | ||||
| Avoidance eggs (n) | 7 | 10 | 0.617 | 0.432 |
| Avoidance potatoes (n) | 8 | 9 | 0.069 | 0.793 |
| Mean±SD | Z | p | ||
|---|---|---|---|---|
| Eggs (g) | 14.54±10.38 | 12.89±11.15 | −0.854 | 0.393 |
| Potatoes (g) | 56.50±42.10 | 40.17±27.80 | −2.035 | 0.042 |
SD: standard deviation; CG: healthy control group; FM: fibromyalgia group; LR: likelihood ratio; Z: Mann–Whitney U-test.
The FM group showed significantly greater avoidance of certain cereal-containing food groups, while in contrast these patients reported a higher monthly intake of white fish and a significantly lower intake of sweets (Table 5).
Although the question referring to avoidance in the sociodemographic questionnaire showed no significant differences between the two groups in terms of alcohol avoidance (Table 1), on analyzing alcohol intake we found total avoidance to be significantly more frequent in the FM group (61%). The consumption of alcoholic beverages such as beer, wine or distilled spirits was significantly lower in the FM group (Table 5).
The consumption of fruit in general was significantly greater in the control group. Of note in this regard was the lesser consumption of citrus fruits in the FM group. Likewise, the consumption of potatoes and sweets was significantly lower in the FM group (Table 5).
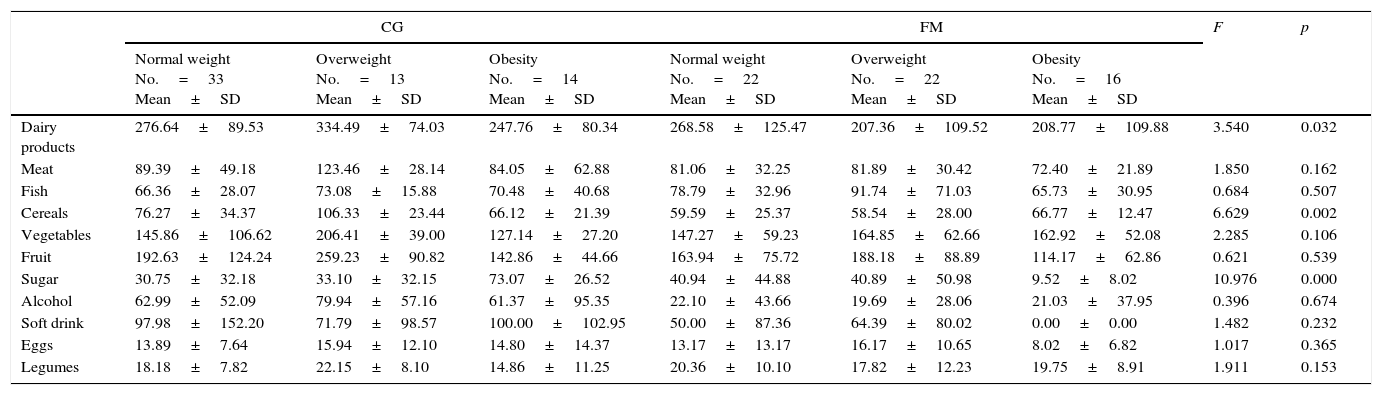
The patients with FM reported a significantly lower intake of soft drinks, with a greater incidence of avoidance, compared with the healthy subjects. Furthermore, a greater number of people in the FM group exclusively consumed soft drinks without caffeine (18.3%). On classifying and comparing the groups according to the BMI, we observed significant differences in the consumption of dairy products, cereals and sugar (Table 6).
Comparison of food consumption according to BMI and FRS.
| CG | FM | F | p | |||||
|---|---|---|---|---|---|---|---|---|
| Normal weight No.=33 Mean±SD | Overweight No.=13 Mean±SD | Obesity No.=14 Mean±SD | Normal weight No.=22 Mean±SD | Overweight No.=22 Mean±SD | Obesity No.=16 Mean±SD | |||
| Dairy products | 276.64±89.53 | 334.49±74.03 | 247.76±80.34 | 268.58±125.47 | 207.36±109.52 | 208.77±109.88 | 3.540 | 0.032 |
| Meat | 89.39±49.18 | 123.46±28.14 | 84.05±62.88 | 81.06±32.25 | 81.89±30.42 | 72.40±21.89 | 1.850 | 0.162 |
| Fish | 66.36±28.07 | 73.08±15.88 | 70.48±40.68 | 78.79±32.96 | 91.74±71.03 | 65.73±30.95 | 0.684 | 0.507 |
| Cereals | 76.27±34.37 | 106.33±23.44 | 66.12±21.39 | 59.59±25.37 | 58.54±28.00 | 66.77±12.47 | 6.629 | 0.002 |
| Vegetables | 145.86±106.62 | 206.41±39.00 | 127.14±27.20 | 147.27±59.23 | 164.85±62.66 | 162.92±52.08 | 2.285 | 0.106 |
| Fruit | 192.63±124.24 | 259.23±90.82 | 142.86±44.66 | 163.94±75.72 | 188.18±88.89 | 114.17±62.86 | 0.621 | 0.539 |
| Sugar | 30.75±32.18 | 33.10±32.15 | 73.07±26.52 | 40.94±44.88 | 40.89±50.98 | 9.52±8.02 | 10.976 | 0.000 |
| Alcohol | 62.99±52.09 | 79.94±57.16 | 61.37±95.35 | 22.10±43.66 | 19.69±28.06 | 21.03±37.95 | 0.396 | 0.674 |
| Soft drink | 97.98±152.20 | 71.79±98.57 | 100.00±102.95 | 50.00±87.36 | 64.39±80.02 | 0.00±0.00 | 1.482 | 0.232 |
| Eggs | 13.89±7.64 | 15.94±12.10 | 14.80±14.37 | 13.17±13.17 | 16.17±10.65 | 8.02±6.82 | 1.017 | 0.365 |
| Legumes | 18.18±7.82 | 22.15±8.10 | 14.86±11.25 | 20.36±10.10 | 17.82±12.23 | 19.75±8.91 | 1.911 | 0.153 |
| Non-restrictive No.=25 Mean±SD | Restrictive No.=35 Mean±SD | Non-restrictive No.=32 Mean±SD | Restrictive No.=28 Mean±SD | F | p | |
|---|---|---|---|---|---|---|
| Dairy products | 284.30±98.98 | 279.81±72.44 | 239.55±137.00 | 221.99±98.93 | 0.115 | 0.735 |
| Meat | 98.71±52.70 | 91.07±48.41 | 77.68±29.24 | 80.26±29.10 | 0.448 | 0.505 |
| Fish | 61.33±17.89 | 79.20±38.02 | 81.43±54.19 | 78.85±47.54 | 1.835 | 0.178 |
| Cereals | 86.42±38.74 | 72.02±18.77 | 60.94±26.03 | 61.28±21.79 | 2.010 | 0.159 |
| Vegetables | 149.33±90.71 | 162.00±81.02 | 156.19±50.64 | 159.38±65.10 | 0.121 | 0.729 |
| Fruit | 219.90±110.37 | 161.20±101.31 | 157.38±76.17 | 161.46±88.01 | 3.191 | 0.770 |
| Sugar | 31.08±30.32 | 55.21±37.43 | 34.10±34.58 | 31.19±49.84 | 3.594 | 0.600 |
| Alcohol | 61.30±52.06 | 73.27±79.88 | 18.20±40.60 | 23.32±32.79 | 0.125 | 0.725 |
| Soft drink | 98.10±147.65 | 85.33±103.95 | 52.38±78.20 | 32.81±72.86 | 0.030 | 0.863 |
| Eggs | 14.40±8.64 | 14.74±12.61 | 15.45±13.90 | 10.66±7.57 | 1.688 | 0.196 |
| Legumes | 18.06±8.08 | 18.56±10.26 | 18.71±10.54 | 19.75±10.68 | 0.022 | 0.884 |
SD: standard deviation; F: univariate analysis of variance; CG: healthy control group; FM: fibromyalgia group.
The data obtained in our study are consistent with those reported by other similar studies6 in terms of gender distribution, mean age, weight and height, and the BMI. The observed differences between the two groups in terms of the BMI also coincided with those of certain previous studies relating FM to an increased BMI and a greater probability of overweight and obesity.11
The FM group contained a significantly greater number of patients that followed a diet (20%) and used herbal products (87%). Restrictions were also more frequent in this group. These percentages are somewhat higher than those reported by Shaver et al.19 (43%), but are consistent with those of Slim et al.,4 who described diet modifications in up to 30% of the patients with FM, and attributed this behavior to their belief that diet influences the symptoms, with a perceived worsening of the manifestations following the consumption of certain foods. With regard to the use of herbal products, our figures were higher than those recorded in people with chronic fatigue.20 Likewise, the proportion of individuals that consumed food supplements in our series (26.6%) was lower than that reported by the survey of the National Fibromyalgia Association2 (68%) or by Arranz et al.6 (73%). However, our data coincide with those of some studies6,14,19,20 in that multivitamin formulations were the most widely consumed supplements, even though the effectiveness of such products has not been scientifically demonstrated. In general, the population with FM did not have a high opinion as to the efficacy of herbal products and supplements, which coincided with the observations of Shaver et al.19 and De Silva et al.7 This was the case with soy, which was not usually associated with improvements, in keeping with the existing negative evidence.12
According to our data, television was the communications media with the greatest influence upon the use of herbal products and supplements, and in relation to avoidances (13.3%), in contrast to the results of the National Fibromyalgia Association,2 according to which the internet is the most widely consulted source of information. As with Arranz et al.,6 most of the patients with FM claimed to follow medical advice in relation to supplements or avoidance practices.
The main consequences reported by our patients with FM after the consumption of certain foods were indigestion (55%) and stomach pain (37%). This agrees with the observations in patients with chronic fatigue.20 Other studies5,14 speak of the presence of intolerance and digestive problems.
With regard to food restriction, the total FRS score among the patients with FM was similar to that obtained in American adults by Williamson et al.21 (13.4±6.0) and in university students by Boerner et al.22 (13.0±6.1) and Urland et al.23 (13.8±5.0). On the other hand, the mean score in the control group was similar to that recorded by Scagliusi et al.24 in Portuguese students (11.3±5). The significantly greater score obtained in the FM group on the “weight fluctuations” subscale could be related to the use of diets and the greater presence of overweight individuals in that group.
On comparing our data with those published by Trinidad Rodríguez et al.17 in the validation of the FFQ, similar values were observed in the percentiles of our control group of healthy individuals regarding food groups such as fish, vegetables, fruit, alcohol, sweets and eggs. Other foods such as meat, dairy products or cereals were less consumed, a fact that could be explained by the older age of our sample. By contrast, the FM group showed a lower consumption of all the food groups, except fish.
The greater incidence of avoidances recorded in the FM group, particularly that of caffeine, alcohol and lactose, is consistent with the results obtained by Arranz et al.5 in relation to elimination diets, where irritating foods that may cause subclinical allergies were identified and eliminated. The differences in avoidance practices between the sociodemographic questionnaire and the FFQ could be explained by the desire among certain patients to avoid foods which they felt to be harmful.
The lesser intake of milk and dairy products among the patients with FM could be related to the increased prevalence of lactose intolerance reported by some studies4 among this population group. Nevertheless, in our study the avoidance of dairy products was recorded in 6.7% of the FM group, which is lower than the values reported by other authors.20,25
Alcohol avoidance was significantly greater in the FM group, despite the lack of evidence of an association between alcohol intake and the worsening of symptoms. In this regard our results were very similar to those obtained in patients with chronic fatigue.20,26
Both the greater avoidance of pasta and rice, and the lesser consumption of cereals in general recorded in the FM group were comparable to the cereal restriction rate of up to 43% published by Trabal et al.20 These findings are consistent with those of some studies25,27 involving gluten-free diets and the evaluation of celiac disease symptoms among FM patients, with results which support the existence of a relationship between gluten sensitivity and FM.
Likewise, we observed a significantly lower intake of fruit and a greater avoidance of citrus fruit in the FM group. This could be related to the fact that 11.6% of the sample with FM claimed to avoid acid foods.
These findings could also be consistent with studies28,29 that speak of sensitivity to oligo-, di- and monosaccharides and fermentable polyols as the possible common element underlying sensitivity to different food components found in a broad range of dietetic sources such as fruit, cereals, milk and yoghurt.
On the other hand, the significantly lesser consumption of soft drinks could be related to the avoidance of carbonated beverages, which can exacerbate certain gastrointestinal symptoms, or the avoidance of caffeine or sugar present in such beverages. In the study published by Trabal et al.,20 the patients were found to apply certain restrictions regarding the intake of stimulants.
In general, the patients with FM reported a lesser consumption of sweets and potatoes, with a greater intake of white fish. In contrast to the healthy control group, and despite the findings of the sociodemographic questionnaire, we recorded no avoidance of vegetables among the patients with FM. There were no significant differences in the consumption of such food, in contrast to the data published in relation to patients with chronic fatigue.20,26 We likewise recorded no patients claiming to follow a vegetarian diet, despite the reported improvements associated with such a diet in patients with FM.14
These results could be explained by the interest of patients with FM in maintaining a healthy diet, with the aim of securing better control of their BMI, since an increase in this parameter would have a negative impact upon their quality of life.1,4 Furthermore, in the FM group we found overweight and obese subjects to be the patients that consumed the fewest dairy products and sweets.
Our results showed the eating habits of patients with FM to differ from those of the healthy controls, with a lesser intake of cereals, fruit, sugar, soft drinks and alcohol. Furthermore, food avoidances were generally more frequent in the FM group, particularly with reference to dairy products, citrus fruit, cereals, alcohol and soft drinks. As in other studies, the patients with FM followed diets and used more herbal products than the controls, though in many cases they reported no improvements as a result of such practices.
According to the FRS scores, the patients with FM experienced greater body weight fluctuations than the healthy group. Nevertheless, the total scores of the questionnaire were similar to those obtained in the healthy samples of both this and other studies. Furthermore, the patients with FM made more frequent use of diets and herbal products, while television and the physician were respectively the information source and professional of greatest influence in relation to eating habits in both study groups.
Thus, our results describe a sample of patients with FM following a varied diet similar to that of the healthy controls, though with a greater avoidance of certain food groups which according to the literature coincide with those foods that have been associated with a worsening of the symptoms in such patients. The greater consumption of foods considered healthy, and the avoidance of alcohol or sugar, could be related to the choice of a healthy diet, as evidenced by Goedendorp et al.26 These findings provide an important insight into the eating habits of this population, and moreover underscore the differences with respect to a healthy population of very similar characteristics. These results may serve as a starting point for future dietetic interventions in patients of this kind.
One of the limitations of our study concerns the use of the FFQ instead of a daily food consumption diary that would have provided a more precise description of the food consumed. Likewise, the use of a quantitative methodology did not allow us to identify the direct causes underlying food avoidance or restriction. Future studies should focus on the qualitative analysis of avoidance practices in these patients, while retrospective or prospective studies should allow for the drawing of conclusions regarding the causes of food avoidance or restriction.
In conclusion, the results of the present study offer important information concerning the eating habits and food avoidance behavior of patients with FM, and on the differences with respect to a sample of healthy controls of similar age and gender distribution.
Conflicts of interestThe authors declare that they have no conflicts of interest.
The authors wish to thank all the people who participated in this study, and the professionals of Complejo Hospitalario Torrecárdenas and the University of Almería that contributed to making the study possible.
Please cite this article as: López-Rodríguez MM, Granero Molina J, Fernández Medina IM, Fernández Sola C, Ruiz Muelle A. Patrones de evitación y conductas alimentarias en pacientes con fibromialgia. Endocrinol Diabetes Nutr. 2017;64:480–490.
