


To assess adherence to self-monitoring of blood glucose and the main factors associated with it, particularly those related to self-perception of glycemia, in patients with diabetes on insulin therapy.
Patients and methodsAn epidemiological, observational, prospective, multicenter study conducted in standard clinical practice in primary care, outpatient centers, and hospitals from different Spanish regions. Sociodemographic, clinical and treatment data were collected. Patients were considered adherent to self-monitoring if they performed the minimum number of controls recommended by the Spanish Society of Diabetes (SED).
ResultsAdherence was shown in 61.6% of patients. Factors associated to adherence included treatment with less than three insulin injections daily (OR 2.678; 95% CI 2.048–3.5029; p<0.001), presence of peripheral vascular disease (OR 1.529; 95% CI 1.077–2.171; p=0.018), alcohol abstinence (OR 1.442; 95% CI 1.118–1.858; p=0.005), and collection of the glucose test strips from the pharmacy (OR 1.275; 95% CI 1.026–1.584; p=0.028). Adequate self-perception of glycemia was found in 21.4% of patients.
ConclusionsOur results show a suboptimal adherence to the recommended protocol for blood glucose self-monitoring in patients with diabetes on insulin therapy. Independent variables associated to good adherence were treatment with less than three insulin injections daily, presence of peripheral vascular disease, alcohol abstinence, and collection of glucose test strips from the pharmacy.
El objetivo principal del estudio fue determinar la adherencia al autoanálisis de la glucemia capilar y los principales factores que influyen en ella, con especial atención a los relacionados con la percepción glucémica, en personas con diabetes tipo 1 o 2 en tratamiento con insulina.
Material y métodosEstudio epidemiológico, observacional, prospectivo y multicéntrico realizado en condiciones de práctica clínica habitual en centros de Atención Primaria, ambulatorios y hospitalarios de distintas comunidades autónomas. Se recogieron datos sociodemográficos, clínicos y de tratamiento. Las personas fueron consideradas adherentes si realizaban el número mínimo de controles recomendado por la Sociedad Española de Diabetes.
ResultadosEl 61,6% de los pacientes demostraron ser adherentes. Los factores asociados a la adherencia fueron tratamiento con insulina de menos de 3 inyecciones diarias (OR: 2,678; IC 95%: 2,048-3,5029; p<0,001), presentar enfermedad vascular periférica (OR: 1,529; IC 95%: 1,077-2,171; p=0,018), no tomar alcohol (OR: 1,442; IC 95%: 1,118-1,858; p=0,005) y recoger las tiras reactivas en la farmacia (OR: 1,275; IC 95%: 1,026-1,584; p=0,028). El 21,4% de los pacientes presentaron una autopercepción glucémica correcta.
ConclusionesLos resultados encontrados demuestran una adherencia al autoanálisis subóptima con respecto a las recomendaciones establecidas por la Sociedad Española de Diabetes en las personas con diabetes en tratamiento con insulina. Las variables independientes asociadas con una buena adherencia fueron tratamiento con menos de 3 inyecciones de insulina al día, presentar enfermedad vascular periférica, no tomar alcohol y retirar las tiras reactivas en la farmacia.
Diabetes mellitus (DM) is one of the chronic diseases with the greatest socioeconomic impact, due to its high prevalence and important morbidity–mortality, fundamentally associated with cardiovascular events. The prevalence of type 2 DM in Spain is 13.8%, with 6% of the cases being unknown.1,2 Among other factors, the complications of DM are attributable to inadequate metabolic control and the years of evolution of the disease.3,4 Various studies have shown good glycemic control to be associated with a lesser risk of the appearance or progression of microvascular complications related to diabetes such as neuropathy, retinopathy and renal problems.5,6 A consensus has been established among a number of scientific bodies regarding the indicated frequency of capillary blood glucose determination depending on the type of DM, the kind of treatment and the clinical condition (stable or unstable) of the patient, the presence of intercurrent illness, pregnancy, etc. In our country, the Spanish Diabetes Society (Sociedad Española de Diabetes [SED])7 highlights two concepts in relation to capillary blood glucose determination: self-monitoring or performance of the capillary blood glucose technique, and glycemic self-control determined by the changes which the patient can introduce to his or her treatment regimen (diet, exercise and insulin dose) in accordance with the blood glucose values. Although the self-monitoring of blood glucose levels is the first step toward self-control seeking to consolidate good glycemic control in diabetics receiving insulin treatment, the fact is that many patients perform less monitoring than recommended.8 International studies have reported suboptimum adherence to self-monitoring, with rates of up to 44% in adults with type 1 DM and 24% in those with type 2 DM.9–14 Furthermore, a relationship has been observed between low self-monitoring frequency and higher glycosylated hemoglobin (HbA1c) levels.13,15,16 The barriers facing self-monitoring and adherence to the recommendations include psychological factors (pain, fear, frustration), social aspects (relationship with colleagues, workplace) or simply financial considerations (cost).8,11,17,18 Other possible influencing factors are the conviction of the patient that he or she knows what the blood glucose value is without having to perform capillary blood glucose testing, and the level of knowledge or skill the patient has for making the pertinent changes in personal treatment. In this regard, a lack of knowledge or deficient understanding of the relationship between glucose concentration and personal health condition, as well as unawareness of how to correctly respond to the readings obtained (this encompassing self-control of the disease) can contribute to reducing the recommended self-monitoring frequency.8,19 Despite the importance of self-monitoring as a fundamental part of the care of patients receiving insulin therapy, few studies to date (and none in Spain) have specifically analyzed adherence to recommended self-monitoring regimens. The main objective of this study, therefore, was to determine adherence and the main factors influencing adherence, with special attention to those related to glycemic perception, in people with type 1 or 2 DM treated with insulin.
Material and methodsA prospective, observational, multicenter epidemiological study was carried out in diabetic patients under conditions of routine clinical practice between September 2012 and February 2013, in the context of primary, outpatient and hospital care in Spanish Autonomous Communities. The inclusion criteria were males and females between 18 and 80 years of age, non-pregnant women, the absence of mental disorders, a diagnosis of DM (type 1 or 2), treatment with insulin (at least 2 daily injections), with at least one year of blood glucose self-monitoring experience, a period of 6 months with the same treatment and without perspectives of change, and the signing of informed consent to participation in the study. The exclusion criteria were the non-availability of the capillary blood glucose recorder at the baseline visit, participation in a clinical trial, or the existence of cancer or serious disease with a life expectancy of less than one year. The sample size was calculated on the basis of a total of 400,000 people with DM receiving insulin therapy in Spain, assuming a precision of 2% and an expected proportion of non-adhering individuals of 50%. The contemplated sample size was 2300 individuals. The study was carried out with two visits and four telephone calls over a period of one month:
1. Baseline visit: the patient's regular nurse collected sociodemographic, clinical and treatment data, along with information regarding the dispensation of reactive strips (at the primary care center or pharmacy). This information was matched with the Autonomous Community in which the patient resided. In nearly all the Communities the strips were dispensed at the healthcare centers; the exceptions were Andalusia, the Canary Islands, Galicia and Valencia, where they were dispensed at pharmacies. The Diabetes Treatment Satisfaction Questionnaire (DTSQ) was also used.20 The data corresponding to the previous week were downloaded from the recorder normally used by the patient, with the determination of HbA1c, and a new Contour® XT (Bayer) recorder was provided. Adherence was defined by compliance with the minimum number of controls established by the SED in the week before the baseline visit (a minimum of 7 controls a week for patients with two daily insulin doses, and 21 controls in those with over three insulin injections a day). Adherence to the protocol was defined as compliance with the minimum number of controls established by the healthcare staff. The recommendations regarding the number of controls could differ from one center to another. For this reason, two self-monitoring adhesion measures were specified: the protocol of the healthcare staff and the recommendations of the SED (the latter being considered more objective). In the case of a single control measure recommended by the healthcare staff, adherence was defined as a control compliance rate of ≥75%. Blood glucose control was classified into four intervals based on the HbA1c (%) values: <7%, ≥7% and <8%, ≥8% and <9%, and ≥9%. A patient with HbA1c≥7% was considered to have non-satisfactory glycemic control.21,22
2. Telephone monitoring: for one month the patients answered a weekly telephone questionnaire to assess blood glucose perception (glycemia values as perceived by the patient). Those patients that failed to specify the blood glucose measurements or the number of daily insulin injections made were excluded from the analysis, as were those who had been using the recorder for less than one week. The subjects were asked about their blood glucose perception at that moment, and were asked to perform a capillary blood glucose measurement. The self-perceived blood glucose data were compared with the real glycemia values obtained with the recorder at the monthly visit. A patient was considered to have correct self-perception when the perceived glycemia values coincided with the real values, with a margin of ±15mg/dl (real glycemia <75mg/dl) or ±20mg/dl (real glycemia ≥75mg/dl). A patient was considered to have correct global blood glucose perception when at least 65% of the perceived values were correct.
3. Final visit: this visit took place after one month, with a downloading of the data recorded in the course of the month.
Statistical analysisCategorical variables were reported as absolute and relative frequencies (%), while continuous variables were reported as the mean and standard deviation (SD). The factors associated with adherence were determined by binary logistic regression analysis (odds ratio [OR] with the corresponding 95% confidence interval [95%CI]). Factor selection was made using the backward stepwise method, and certain factors such as the number of controls made were discarded in order to avoid confusion bias. The chi-squared test was used for the comparison of adherence to the self-monitoring protocol established by the SED versus that established by the healthcare staff. The comparative analysis of the HbA1c values according to adherence was performed using the Mann–Whitney U-test. The association between the blood glucose controls made and the HbA1c values was examined by calculating the Pearson correlation coefficient. The relationship between the number of blood glucose controls made according to the established glycemic control groups was explored by means of the Kruskal–Wallis test. The analysis of the categorized minimum weekly recordings recommended by the SED (7, 21 or 28 measurements) in relation to adherence was performed using the Fisher exact test. Statistical significance was considered for p≤0.05. The SAS version 9.4 statistical package was used throughout.
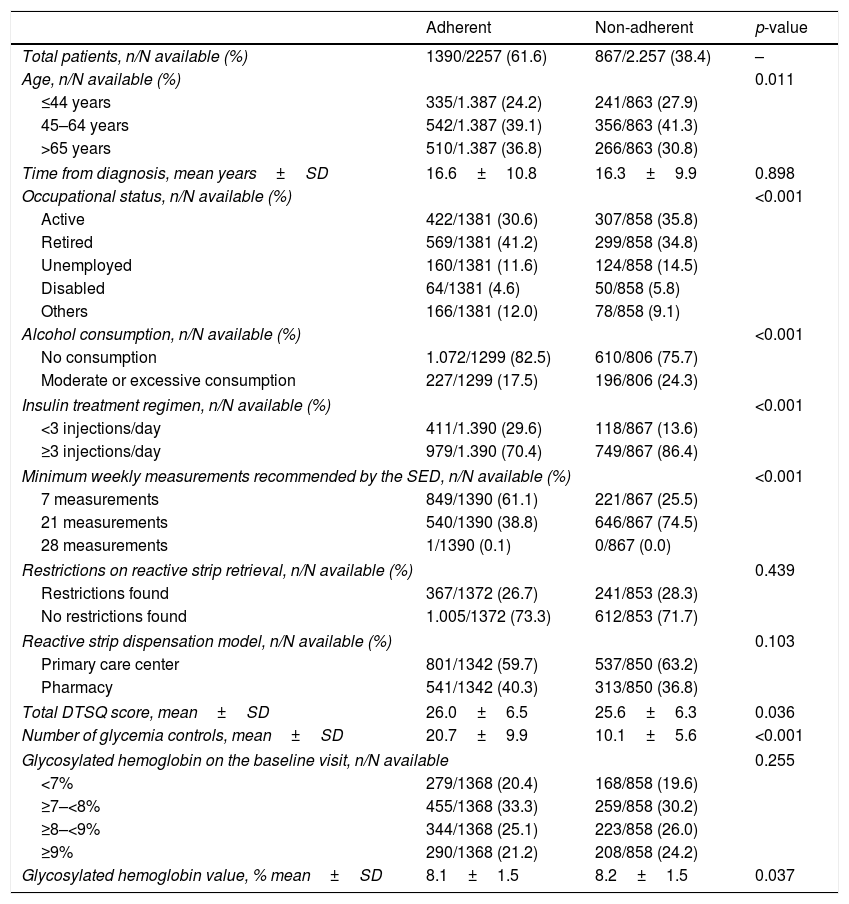
ResultsOf a total of 2700 recruited subjects, 2257 were finally included in the study. A total of 61.6% were seen to adhere to the self-monitoring protocol of the SED. Table 1 shows the sociodemographic, clinical and treatment characteristics of the patients, classified according to adherence to the self-monitoring protocol established by the SED (adherent versus non-adherent). The insulin treatment regimen showed significant differences between patients (p<0.001), with <3 daily injections being more common among adherent individuals (29.6% versus 13.6%), while the ≥3 daily injections regimen was more common among non-adherent subjects (86.4% versus 70.4%). On categorizing the minimum weekly measurements recommended by the SED, we found 7 measurements to be the most frequent practice among adherent patients (61.1%), versus 21 among the non-adherent individuals (74.5%; p<0.001). Regarding availability, 26.7% of the adherent subjects and 28.3% of the non-adherent individuals claimed to have experienced some difficulty in obtaining the reactive strips, which were mainly dispensed at the primary care centers. The DTSQ score was significantly greater (p=0.036) among the adherent subjects (26.0±6.5) than in the non-adherent individuals (25.6±6.3). In turn, the number of blood glucose controls made in the week before the baseline visit was significantly greater (p<0.001) among the adherent subjects (20.7±9.9) than in the non-adherent subjects (10.1±5.6). The HbA1c values recorded at the baseline visit were similar in the adherent subjects (8.1±1.5) and in the non-adherent individuals (8.2±1.5). It should be noted that although statistical significance was not reached, the adherent subjects showed a greater presence of values between 7 and 8%, while the non-adherent individuals showed a greater number of values above 8%. A negative correlation was found (Pearson coefficient −0.0646; p=0.002) between the number of blood glucose controls made and the HbA1c values: as the number of controls increased, the HbA1c values decreased (Fig. 1).
Sociodemographic, clinical and treatment characteristics of the patients, classified according to adherence to the self-monitoring protocol established by the SED.
| Adherent | Non-adherent | p-value | |
|---|---|---|---|
| Total patients, n/N available (%) | 1390/2257 (61.6) | 867/2.257 (38.4) | – |
| Age, n/N available (%) | 0.011 | ||
| ≤44 years | 335/1.387 (24.2) | 241/863 (27.9) | |
| 45–64 years | 542/1.387 (39.1) | 356/863 (41.3) | |
| >65 years | 510/1.387 (36.8) | 266/863 (30.8) | |
| Time from diagnosis, mean years±SD | 16.6±10.8 | 16.3±9.9 | 0.898 |
| Occupational status, n/N available (%) | <0.001 | ||
| Active | 422/1381 (30.6) | 307/858 (35.8) | |
| Retired | 569/1381 (41.2) | 299/858 (34.8) | |
| Unemployed | 160/1381 (11.6) | 124/858 (14.5) | |
| Disabled | 64/1381 (4.6) | 50/858 (5.8) | |
| Others | 166/1381 (12.0) | 78/858 (9.1) | |
| Alcohol consumption, n/N available (%) | <0.001 | ||
| No consumption | 1.072/1299 (82.5) | 610/806 (75.7) | |
| Moderate or excessive consumption | 227/1299 (17.5) | 196/806 (24.3) | |
| Insulin treatment regimen, n/N available (%) | <0.001 | ||
| <3 injections/day | 411/1.390 (29.6) | 118/867 (13.6) | |
| ≥3 injections/day | 979/1.390 (70.4) | 749/867 (86.4) | |
| Minimum weekly measurements recommended by the SED, n/N available (%) | <0.001 | ||
| 7 measurements | 849/1390 (61.1) | 221/867 (25.5) | |
| 21 measurements | 540/1390 (38.8) | 646/867 (74.5) | |
| 28 measurements | 1/1390 (0.1) | 0/867 (0.0) | |
| Restrictions on reactive strip retrieval, n/N available (%) | 0.439 | ||
| Restrictions found | 367/1372 (26.7) | 241/853 (28.3) | |
| No restrictions found | 1.005/1372 (73.3) | 612/853 (71.7) | |
| Reactive strip dispensation model, n/N available (%) | 0.103 | ||
| Primary care center | 801/1342 (59.7) | 537/850 (63.2) | |
| Pharmacy | 541/1342 (40.3) | 313/850 (36.8) | |
| Total DTSQ score, mean±SD | 26.0±6.5 | 25.6±6.3 | 0.036 |
| Number of glycemia controls, mean±SD | 20.7±9.9 | 10.1±5.6 | <0.001 |
| Glycosylated hemoglobin on the baseline visit, n/N available | 0.255 | ||
| <7% | 279/1368 (20.4) | 168/858 (19.6) | |
| ≥7–<8% | 455/1368 (33.3) | 259/858 (30.2) | |
| ≥8–<9% | 344/1368 (25.1) | 223/858 (26.0) | |
| ≥9% | 290/1368 (21.2) | 208/858 (24.2) | |
| Glycosylated hemoglobin value, % mean±SD | 8.1±1.5 | 8.2±1.5 | 0.037 |
SD: standard deviation; DTSQ: Diabetes Treatment Satisfaction Questionnaire.

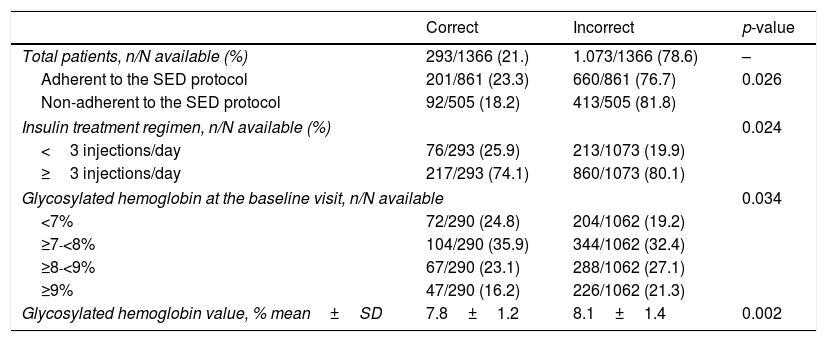
A total of 21.4% of the patients showed a correct self-perception of their glycemia. The percentage of adherent individuals with correct self-perception (23.3%) was significantly greater than in the non-adherent individuals (18.2%; p=0.026). Table 2 shows the clinical characteristics of the subjects and their self-perception of glycemia (correct or incorrect). There were no significant differences between the individuals with correct or incorrect self-perception stratified according to age groups, gender or sociodemographic factors (data not shown). A total of 60.7% of the subjects with correct self-perception had HbA1c values of between 5 and 8%, while 59.5% of the individuals with incorrect self-perception had HbA1c values of between 7 and 9% (p<0.05). The mean HbA1c value among the individuals with correct self-perception was significantly lower (p=0.002) than in those with incorrect self-perception (7.8±1.2 versus 8.1±1.4). Fig. 2 shows the variation over time of real glycemia versus patient self-perceived glycemia during the four weeks of the study according to whether self-perception was correct or incorrect. The subjects with correct self-perception had lower mean glycemia values (both real and self-perceived) than those with incorrect self-perception.
Clinical characteristics of the subjects and their self-perception of glycemia (correct or incorrect).
| Correct | Incorrect | p-value | |
|---|---|---|---|
| Total patients, n/N available (%) | 293/1366 (21.) | 1.073/1366 (78.6) | – |
| Adherent to the SED protocol | 201/861 (23.3) | 660/861 (76.7) | 0.026 |
| Non-adherent to the SED protocol | 92/505 (18.2) | 413/505 (81.8) | |
| Insulin treatment regimen, n/N available (%) | 0.024 | ||
| <3 injections/day | 76/293 (25.9) | 213/1073 (19.9) | |
| ≥3 injections/day | 217/293 (74.1) | 860/1073 (80.1) | |
| Glycosylated hemoglobin at the baseline visit, n/N available | 0.034 | ||
| <7% | 72/290 (24.8) | 204/1062 (19.2) | |
| ≥7-<8% | 104/290 (35.9) | 344/1062 (32.4) | |
| ≥8-<9% | 67/290 (23.1) | 288/1062 (27.1) | |
| ≥9% | 47/290 (16.2) | 226/1062 (21.3) | |
| Glycosylated hemoglobin value, % mean±SD | 7.8±1.2 | 8.1±1.4 | 0.002 |
SD: standard deviation; SED: Sociedad Española de Diabetes.

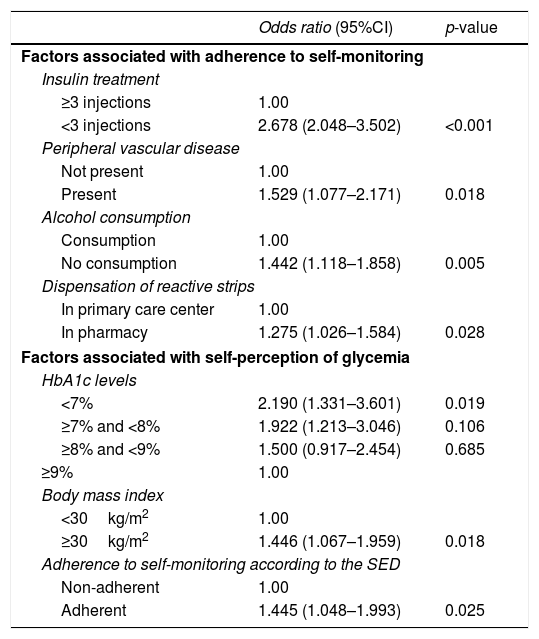
The factors associated with adherence, identified from the binary logistic regression analysis, were insulin treatment involving <3 daily injections (OR: 2.678; 95%CI: 2.048–3.5029; p<0.001), the presence of peripheral vascular disease (OR: 1.529; 95%CI: 1.077–2.171; p=0.018), alcohol abstinence (OR: 1.442; 95%CI: 1.118–1.858; p=0.005) and reactive strip retrieval from the pharmacy (OR: 1.275; 95%CI: 1.026–1.584; p=0.028 [Table 3]). On considering factors associated with correct self-perception of glycemia, we identified three independent variables: HbA1c<7% (OR: 2.190; 95%CI: 1.331–3.601; p=0.019), the body mass index (BMI) ≥30kg/m2 (OR: 1.446; 95%CI: 1.067–1.959; p=0.018) and adherence to self-monitoring as established by the SED (OR: 1.445; 95%CI: 1.048–1.993; p=0.025).
Factors associated with adherence to self-monitoring as established by the SED and self-perception of glycemia.
| Odds ratio (95%CI) | p-value | |
|---|---|---|
| Factors associated with adherence to self-monitoring | ||
| Insulin treatment | ||
| ≥3 injections | 1.00 | |
| <3 injections | 2.678 (2.048–3.502) | <0.001 |
| Peripheral vascular disease | ||
| Not present | 1.00 | |
| Present | 1.529 (1.077–2.171) | 0.018 |
| Alcohol consumption | ||
| Consumption | 1.00 | |
| No consumption | 1.442 (1.118–1.858) | 0.005 |
| Dispensation of reactive strips | ||
| In primary care center | 1.00 | |
| In pharmacy | 1.275 (1.026–1.584) | 0.028 |
| Factors associated with self-perception of glycemia | ||
| HbA1c levels | ||
| <7% | 2.190 (1.331–3.601) | 0.019 |
| ≥7% and <8% | 1.922 (1.213–3.046) | 0.106 |
| ≥8% and <9% | 1.500 (0.917–2.454) | 0.685 |
| ≥9% | 1.00 | |
| Body mass index | ||
| <30kg/m2 | 1.00 | |
| ≥30kg/m2 | 1.446 (1.067–1.959) | 0.018 |
| Adherence to self-monitoring according to the SED | ||
| Non-adherent | 1.00 | |
| Adherent | 1.445 (1.048–1.993) | 0.025 |
SED: Sociedad Española de Diabetes.
On analyzing adherence to the self-monitoring protocol established by the healthcare staff, 58.2% of the patients were found to be adherent. Of the patients adherent to the protocol of the SED, 73.5% were also adherent to the protocol established by the healthcare staff. In turn, 33.4% of the subjects not adherent to the protocol of the SED were adherent to the protocol established by the healthcare staff (p<0.001; data not shown). The factors associated with adherence to the protocol established by the healthcare staff were an age of over 65 years (OR: 1.418; 95%CI: 1.071–1.877; p=0.005), ease in obtaining the reactive strips (OR: 1.311; 95%CI: 1.046–1.643; p=0.019), and an insulin treatment regimen of <3 daily injections (OR: 1.286; 95%CI: 1.000–1.653; p=0.050; data not shown).
DiscussionDespite the importance of the self-monitoring of blood glucose as a fundamental part of the care of diabetic patients receiving insulin therapy, no clinical study has been made to date in Spain of the factors associated with adherence to the recommended self-monitoring protocols. The most important findings of our study included the 61.6% rate of adherence to the SED protocol for the self-monitoring of glycemia and the identification of independent factors associated with such adherence, such as an insulin treatment regimen of <3 daily injections, the presence of peripheral vascular disease, alcohol abstinence and retrieval of the reactive strips from the pharmacy.
The adherence rate found in our study (61.6%) is slightly higher than the values reported in the literature.9–13 A possible explanation for this discrepancy is the fact that our study included individuals with type 1 DM, who potentially show greater adherence than patients with type 2 DM.9–13 A survey conducted in the year 2004, and which jointly analyzed patients with type 1 and type 2 DM, recorded an adherence rate of 52%, which is slightly lower than our own rate. Another possible reason is the way in which adherent individuals were classified and the type of study made to measure adherence. In our case we defined adherence according to the minimum number of controls established by the SED, while other studies have used the relative frequency of behavior (assessed by questionnaires with answers in the form of “always”, “a lot”, “sometimes” or “never”),9 or absolute measures (difference between the controls actually made in a certain period of time versus the recommended number of controls),10–14 along with a cut-off value defining adherence (often taken to be 80%).11 Likewise, qualitative studies such as surveys tend to record overestimated results. On the other hand, there was very similar adherence to the SED protocol (61.6%) and to the protocol established by the healthcare staff (58.2%) in our series, so the use of these protocols cannot account for the discrepancy.
A number of studies have identified a series of psychosocial (interference with lifestyle, inconvenience, low self-efficacy and self-esteem, the pain caused) and economic factors (assumed cost) as barriers that can adversely affect adherence to self-monitoring.8,11,17 A number of demographic and clinical variables, such as the type of DM (type 2 versus type 1), the kind of medication or a long duration of diabetes have also been reported as predictors of non-adherence to self-monitoring recommendations.9,23–25 Other factors associated with poor glycemia control in patients with type 2 DM are young age or a low body mass index.26 In our series, the multivariate analysis identified the insulin treatment regimen (<3 injections), the presence of vascular disease, alcohol abstinence and the obtaining of reactive strips from the pharmacy as independent factors associated with adherence to the self-monitoring recommendations of the SED. However, the bivariate analysis contrasting adherent versus non-adherent individuals also identified differences in sociodemographic and clinical parameters such as age (over 65 years), occupational status (retirees) or the recommended minimum weekly measurements (7). Different studies have found excessive alcohol consumption to have a direct impact upon the self-care of patients with DM, increasing the risk of loss of adherence in both self-monitoring and self-control of the disease.27 Improved adherence associated with fewer insulin injections (<3 versus ≥3 daily injections) may be related to patient fear of pain caused by the injection of insulin and the needle prick of glucose self-monitoring, which interferes with adequate glycemia control.28,29 The association between vascular complications and adherence could be explained by the fact that such patients require stricter self-monitoring and self-control than individuals without these complications.
Moreover, patient attitude or perception of the disease, its treatment and glycemia may contribute to reducing the frequency of self-monitoring with respect to the recommended periodicity.8,18 In our study, 21.4% of the patients showed correct self-perception of glycemia. The factors associated with correct self-perception were HbA1c <7%, a body mass index of ≥30kg/m2 and adherence to self-monitoring. In fact, the adherent patients were mainly the individuals that showed correct self-perception (23.3%). The results of our study also stress the importance of optimum adherence to self-monitoring. This agrees with the literature, a relationship having been found between adherence and low HbA1c values. Specifically, a greater frequency of adherent subjects was observed in the presence of HbA1c <8%.13 Furthermore, a relationship was observed between low self-monitoring frequency and higher HbA1c levels in patients with type 1 and type 2 DM.10,14,15 Knowing this situation of suboptimum adherence underscores the crucial importance of patient training and adequate follow-up in order to correct the problem. Our study has a number of methodological limitations, such as the fact that the information about the type of DM was not recorded, or failure to evaluate the therapeutic actions of the patient/caregiver after glycemic measurement, i.e., self-control. Another limitation is the fact that the minimum recommendations of the SED for determining whether a patient is adherent or not were established according to the insulin treatment regimen documented during the study.
ConclusionsThe results obtained show suboptimum adherence to the established self-monitoring recommendations in diabetic patients receiving insulin treatment. The independent variables associated with good adherence to the SED protocol were an insulin treatment regimen of <3 daily injections, the presence of peripheral vascular disease, alcohol abstinence and the retrieval of the reactive strips from the pharmacy.
Conflicts of interestThe authors state that they have no conflicts of interest.
The authors thank Prof. Ceriello for his contribution to the analysis of the results.
Thanks are also due to all the diabetic patients for their participation.
To the professionals that have collaborated on the project.
Please cite this article as: Vidal Florc M, Jansà Morató M, Galindo Rubio M, Penalba Martínez M. Factores asociados a la adherencia al autoanálisis de la glucemia capilar en personas con diabetes en tratamiento con insulina. Estudio dapa. Endocrinol Diabetes Nutr. 2018;65:99–106.
