More than 50% of first cardiovascular events (CVE) occur in populations identified as at low or intermediate risk by the risk equations, so the inclusion of additional variables, such as polygenic risk scores (PRS), has been proposed to improve the predictive capacity of these equations. The aim of this study was to assess whether a PRS, independently or with clinical risk equations, is associated with the presence, severity and extent of subclinical atherosclerosis.
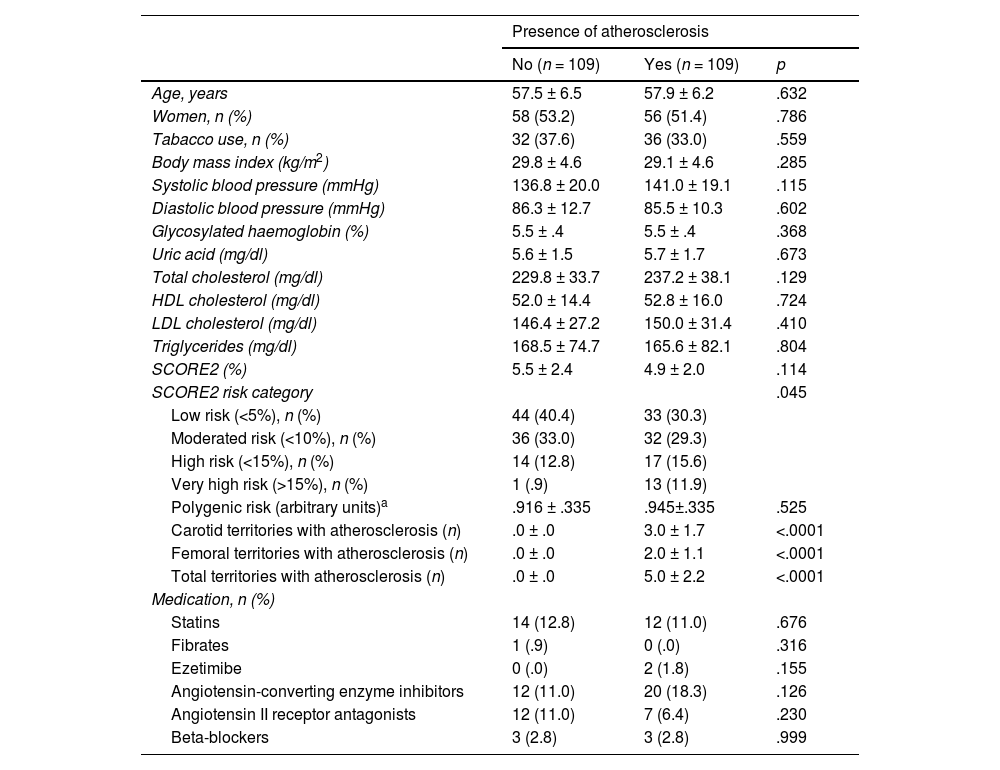
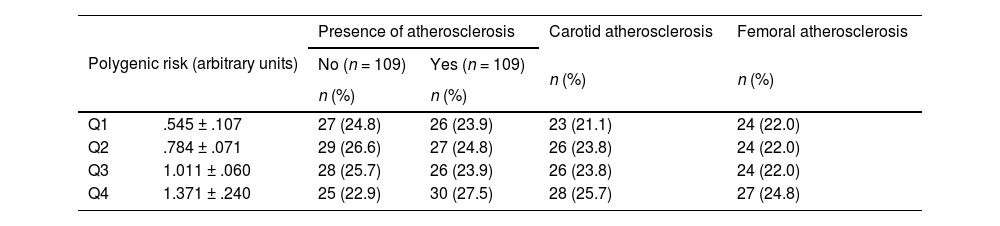
Methods109 subjects with atherosclerosis were selected from the ILERVAS cohort (primary prevention) and matched with 109 participants without atherosclerosis of the same age, sex and SCORE2 risk level. Atherosclerosis was assessed and quantified by arterial wall vascular ultrasound in 12 territories, and PRS was estimated using the Cardio inCode Score®. The predictive capacity of the presence of subclinical atherosclerosis was estimated, as well as the association between the extent and severity of atherosclerosis with PRS and clinical risk (SCORE2).
ResultsPRS was similar between participants with or without atherosclerosis (P = .525). We did not find an association between PRS and SCORE2 (r = −.29, P = .709), and the addition of PRS to SCORE2 did not improve the prediction of atherosclerosis [AUC (95% CI) = .566 (.477, .654, P = .148). The extent of atherosclerosis was related to SCORE2 (P = .009), but not to PRS (P = .709).
ConclusionsThe Selected PRS is not associated with the presence of atherosclerosis or clinical risk, suggesting that its additional contribution to CVE risk would be mediated by mechanisms independent of the development of atherosclerosis. Additional biomarkers are needed to improve the prediction of subclinical atherosclerosis without using imaging tests as a first step in personalised assessment.
Más de un 50% de primeros eventos cardiovasculares (ECV) ocurren en población identificada como de riesgo bajo o intermedio por las ecuaciones de riesgo, por lo que se ha propuesto la inclusión de variables adicionales, como puntuaciones de riesgo poligénicos (PRP), para mejorar la capacidad predictiva de estas ecuaciones. El objetivo de este estudio fue evaluar si una PRP, independientemente o junto a las ecuaciones de riesgo clínico, se asocia a la presencia, gravedad y extensión de aterosclerosis subclínica.
MétodosSe seleccionaron 109 sujetos con aterosclerosis de la cohorte ILERVAS (prevención primaria) y se aparearon con 109 participantes sin aterosclerosis de la misma edad, sexo y nivel de riesgo SCORE2. Se evaluó y cuantificó la aterosclerosis en 12 territorios mediante ecografía vascular de pared arterial y se estimó la PRP mediante el Cardio inCode Score®. Se estimó la capacidad de predicción de presencia de aterosclerosis subclínica, y la asociación entre la extensión y gravedad de la aterosclerosis con la PRP y el riesgo clínico (SCORE2).
ResultadosLa PRP fue similar entre participantes con o sin aterosclerosis (P = 0.525). No encontramos una asociación entre la PRP y el SCORE2 (r= -0.29, P = 0.709), y la adición de la PRP al SCORE2 no mejoró la predicción de aterosclerosis [AUC (95% IC)= 0.566 (0.477, 0.654, P = 0.148). La extensión de la aterosclerosis se relacionó con el SCORE2 (P = 0.009), pero no con la PRP (P = 0.709).
ConclusionesLa PRP seleccionada no se asocia con la presencia de aterosclerosis ni con el riesgo clínico, sugiriendo que su contribución adicional al riesgo de ECV se mediaría por mecanismos independientes al desarrollo de aterosclerosis. Se necesitan biomarcadores adicionales para mejorar la predicción de aterosclerosis subclínica sin recurrir a pruebas de imagen como primer paso en la evaluación personalizada.
Although we currently have clinical equations for predicting cardiovascular risk, such as SCORE2,1 the prevalence of atherosclerosis in people classified as low cardiovascular risk is high, reaching up to 20%.2 The presence of subclinical atherosclerosis is strongly associated with future myocardial infarction and has a significantly higher diagnostic value than SCORE2.3 In fact, more than 50% of first cardiovascular events occur in a population classified as low or intermediate risk by risk equations.4 This highlights the need to improve the reclassification of people classified as low/medium risk by clinical equations according to their degree of atheromatosis. According to the SEA 2024 standards, the presence of subclinical vascular disease is a modulator that increases the risk by one step, so that subjects classified as low/medium risk in SCORE2 would be directly reclassified as high risk. Therefore, early detection of subclinical atherosclerosis is essential to reduce cardiovascular risk and delay the progression of atherosclerosis and cardiovascular events. However, detecting atheromatosis is expensive and often uncomfortable.
Recently, the integration of polygenic risk into clinical equations has been proposed to improve the accuracy of cardiovascular risk estimation.5,6 Therefore, the aim of this study was to evaluate whether polygenic risk estimation, independently or together with clinical risk equations, is associated with the presence, severity, and extent of subclinical atherosclerosis and thus with improving the prediction of true cardiovascular risk at the individual level.
Material and methodsThis is a substudy within a larger study aimed at finding predictive variables for atherosclerosis beyond the classical cardiovascular risk factors (included in clinical risk equations such as SCORE2) in participants of the ILERVAS cohort (ClinicalTrials.gov identifier: NCT03228459). Therefore, a total of 109 participants with subclinical atherosclerosis were selected from the ILERVAS cohort and matched 1:1 with participants of the same age, sex, and SCORE2 risk category without atherosclerosis (final number 218). Individuals with subclinical atherosclerotic disease (defined as focal invasion of the arterial lumen ≥ 1.5 mm) in at least one of the 12 examined territories were selected, and individuals with abdominal aortic aneurysm were excluded. The presence of atherosclerosis in the carotid and femoral arteries was determined by vascular ultrasound of the arterial wall in 12 areas, as described.2 More specifically, it was measured in both carotid arteries (common, bifurcation, internal, and external) and femoral arteries (common and superficial).7
SCORE2 was calculated according to the algorithm proposed by the European Society of Cardiology.1
Samples of genomic DNA extracted from blood samples from the same individuals were analysed for the presence/absence of 12 genetic variants using TaqMan® (Life Technologies, Thermo Fisher Scientific Inc., MA, USA) with the Fluidigm. phenotyping platform. Data were analysed using Fluidigm SNP Genotyping Analysis software (Standard BioTools Inc., CA, USA). The Cardio inCode Score ® (GenInCode, Barcelona, Spain; https://www.genincode.com/es/cardio-incode-test-genetico-prevencion-corazon/), a patented genetic test validated in more than 80,000 patients that analyses the major genetic variants associated with cardiovascular risk, was used to calculate the polygenic risk score in these participants.
Participants were recruited between January 2015 and December 2018 from 32 primary healthcare areas in the province of Lleida (Catalonia, Spain).2 All participants signed an informed consent form prior to enrolment. The ILERVAS study was conducted in accordance with the tenets of the Declaration of Helsinki and was approved by the Ethics Committee of the Arnau de Vilanova University Hospital in Lleida (CEIC-1410). In addition, the current sub-study was approved by the Hospital Clínic de Barcelona (HCB/2021/0258).
Statistical analysis was performed using SPSS v. 29 (IBM Corp., Armonk, NY, USA). Descriptive data are presented as means ± standard deviation (SD) for continuous variables, and frequencies or proportions (%) for categorical variables. The normality of the values of the continuous variables was checked before the analyses using the Shapiro-Wilk test. Differences between groups were assessed using the χ2 test for categorical variables and the t-test or Mann-Whitney test for parametric and non-parametric numerical variables, respectively. The potential of the polygenic risk scores to predict the presence of subclinical atherosclerosis was analysed using receiver operating characteristic (ROC) curves (area under the curve [AUC], 95% CI). The correlation between the extent and severity of atherosclerosis, and polygenic risk scores and SCORE2 was analysed using Pearson's correlation coefficient and linear or binary regression, adjusting for potential confounders.
ResultsCharacteristics of the study populationAs shown in Table 1, of the 218 participants included in the study, half had atherosclerosis due to the study design. Among those with atheromatosis, 16.5% had atherosclerosis in one carotid territory, 20.2% in two territories, 20.2% in three territories, and 37.6% in four or more carotid territories. Whereas 21.1% had atherosclerosis in one femoral territory, 45.9% in 2 territories, 10.1% in 3 territories, and 13.8% in 4 femoral territories. Atheromatous plaques were found in 3 or more territories in 87% of participants with atherosclerosis.
Characteristics of the study subjects according to presence of atherosclerosis and clinical risk.
| Presence of atherosclerosis | |||
|---|---|---|---|
| No (n = 109) | Yes (n = 109) | p | |
| Age, years | 57.5 ± 6.5 | 57.9 ± 6.2 | .632 |
| Women, n (%) | 58 (53.2) | 56 (51.4) | .786 |
| Tabacco use, n (%) | 32 (37.6) | 36 (33.0) | .559 |
| Body mass index (kg/m2) | 29.8 ± 4.6 | 29.1 ± 4.6 | .285 |
| Systolic blood pressure (mmHg) | 136.8 ± 20.0 | 141.0 ± 19.1 | .115 |
| Diastolic blood pressure (mmHg) | 86.3 ± 12.7 | 85.5 ± 10.3 | .602 |
| Glycosylated haemoglobin (%) | 5.5 ± .4 | 5.5 ± .4 | .368 |
| Uric acid (mg/dl) | 5.6 ± 1.5 | 5.7 ± 1.7 | .673 |
| Total cholesterol (mg/dl) | 229.8 ± 33.7 | 237.2 ± 38.1 | .129 |
| HDL cholesterol (mg/dl) | 52.0 ± 14.4 | 52.8 ± 16.0 | .724 |
| LDL cholesterol (mg/dl) | 146.4 ± 27.2 | 150.0 ± 31.4 | .410 |
| Triglycerides (mg/dl) | 168.5 ± 74.7 | 165.6 ± 82.1 | .804 |
| SCORE2 (%) | 5.5 ± 2.4 | 4.9 ± 2.0 | .114 |
| SCORE2 risk category | .045 | ||
| Low risk (<5%), n (%) | 44 (40.4) | 33 (30.3) | |
| Moderated risk (<10%), n (%) | 36 (33.0) | 32 (29.3) | |
| High risk (<15%), n (%) | 14 (12.8) | 17 (15.6) | |
| Very high risk (>15%), n (%) | 1 (.9) | 13 (11.9) | |
| Polygenic risk (arbitrary units)a | .916 ± .335 | .945±.335 | .525 |
| Carotid territories with atherosclerosis (n) | .0 ± .0 | 3.0 ± 1.7 | <.0001 |
| Femoral territories with atherosclerosis (n) | .0 ± .0 | 2.0 ± 1.1 | <.0001 |
| Total territories with atherosclerosis (n) | .0 ± .0 | 5.0 ± 2.2 | <.0001 |
| Medication, n (%) | |||
| Statins | 14 (12.8) | 12 (11.0) | .676 |
| Fibrates | 1 (.9) | 0 (.0) | .316 |
| Ezetimibe | 0 (.0) | 2 (1.8) | .155 |
| Angiotensin-converting enzyme inhibitors | 12 (11.0) | 20 (18.3) | .126 |
| Angiotensin II receptor antagonists | 12 (11.0) | 7 (6.4) | .230 |
| Beta-blockers | 3 (2.8) | 3 (2.8) | .999 |
Results expressed as mean ± SD or n (%).
p-value of the comparison between participants with and without the presence of atherosclerosis in the quantified areas (t-test or Mann-Whitney, or χ2 test for quantitative and categorical variables respectively).
Clinical and anthropometric characteristics were similar between those with and without atheromatous plaques (Table 1).
Clinical risk versus polygenic risk for detecting subclinical atherosclerosisThe polygenic risk score was similar between people with and without atherosclerosis (Table 1). As shown in Table 2, the presence/absence of atherosclerosis in general or in the carotid or femoral arteries was similar in the different quartiles of the polygenic risk score (p = .577, .886, and .926, respectively).
Frequency of subclinical atherosclerosis according to quartiles of polygenic risk score.
| Polygenic risk (arbitrary units) | Presence of atherosclerosis | Carotid atherosclerosis | Femoral atherosclerosis | ||
|---|---|---|---|---|---|
| No (n = 109) | Yes (n = 109) | n (%) | n (%) | ||
| n (%) | n (%) | ||||
| Q1 | .545 ± .107 | 27 (24.8) | 26 (23.9) | 23 (21.1) | 24 (22.0) |
| Q2 | .784 ± .071 | 29 (26.6) | 27 (24.8) | 26 (23.8) | 24 (22.0) |
| Q3 | 1.011 ± .060 | 28 (25.7) | 26 (23.9) | 26 (23.8) | 24 (22.0) |
| Q4 | 1.371 ± .240 | 25 (22.9) | 30 (27.5) | 28 (25.7) | 27 (24.8) |
Polygenic risk is calculated with the Cardio inCode Score® and expressed as mean ± standard deviation.
Q1–Q4 are the quartiles of the Cardio inCode Score®.
Polygenic risk, evaluated as a continuous or categorical variable, was not able to predict the presence of atherosclerosis in the study population (AUC [95% CI] = .523 [.446, .600], p = .563). The combination of SCORE2 and the polygenic risk score on the curve did not increase the ability to predict the presence of atherosclerosis (AUC [95% CI] = .566 [.477, .654], p = .148), although the values of the two equations did not correlate with each other (Pearson correlation factor = −.29, p = .709) (Fig. 1).
Association between extent and severity of atherosclerosis and polygenic risk levels and SCORE2The extent of atherosclerosis was calculated as the sum of plaque area in the 12 territories analysed. A weak but significant correlation was observed between SCORE2 and the extent of atherosclerosis (Pearson’s correlation coefficient = .551, p < .001), but not with polygenic risk (p = .709), in both men and women. Similarly, a significant correlation was observed between SCORE2 and the number of affected areas (Pearson = .292, <.001), but not with polygenic risk (p = .202). However, this association between SCORE2 and the number of territories affected was only maintained in men (Pearson = .361, <.001) when we analysed men and women separately.
The severity of atherosclerosis was determined by the degree of stenosis. Stenosis was defined as a 50% reduction in the diameter of the artery. Of the 109 people with atherosclerosis, 27 had stenosis. The people with stenosis had a higher SCORE2 than the people with atherosclerosis without stenosis (7.37 ± 3.17 vs. 5.18 ± 2.11, p = .009), but a similar polygenic risk (.939 ± .316 vs. .960 ± .392, p = .989). No differences in SCORE2 or polygenic risk were observed between the men and the women with stenosis.
DiscussionThe population in this study belonged to the ILERVAS cohort at the time of enrolment, in which more than 70% of the population was found to have subclinical atherosclerosis, regardless of their clinical risk.2 In this study, we selected people with or without atherosclerosis matched by clinical risk level, so SCORE2 obviously does not predict the presence of plaque in this subpopulation. However, within the group of people with atherosclerosis, SCORE2 is associated with the extent and severity of atherosclerosis (presence of stenosis), confirming that clinical equations classify high-risk individuals much better than individuals at low or moderate risk.8
In this small project, no association was observed between the presence, extent, or severity of atherosclerosis and polygenic risk, independently or together with clinical equations. In a middle-aged European population (n = 7237), adding polygenic risk to clinical risk did not improve the prediction of a cardiovascular event.9 However, in other studies, polygenic risk has increased the predictive power of an event. In a study of 352,660 people from the UK Biobank, including polygenic risk in clinical equations modestly but significantly improved the ability to predict a long-term cardiovascular event.10 In a study of 63,070 people from the multi-ethnic Genes, Environment, and Health (GERA) cohort, using the same polygenic risk equation as in the present study, the inclusion of polygenic risk improved the prediction of coronary heart disease.11 In fact, a recent study using the Framingham Heart (FH) and Atherosclerosis Risk in Communities (ARIC) cohorts proposed multiplying clinical risk by polygenic risk to improve cardiovascular risk prediction,12 which did not improve the prediction of plaque presence in our study population (data not shown). The discrepancies observed between studies may be due to several factors. First, our small cohort is selected by risk category and presence of atherosclerosis, with the prevalence of subclinical atherosclerosis being lower in low clinical risk categories than in the general population.2 Second, the polymorphisms included in the polygenic risk equation may differ between ethnic groups and between studies.
Atherosclerosis is a complex disease with a strong genetic influence, but the effects of individual genetic polymorphisms may be small. It is possible that polygenic risk equations, which are based on the sum of multiple genetic variants, do not fully capture the complex genetic architecture of the disease, suggesting that their additional contribution to the risk of cardiovascular events is mediated by mechanisms independent of the development of atherosclerosis. In fact, there is currently no consensus on which genes and their polymorphisms should be considered in relation to atherosclerosis. Although polygenic risk equations have shown some potential for improving the prediction of atherosclerotic disease risk in primary prevention, their predictive accuracy is still relatively low. Further research in both sexes and different ethnic groups is needed to better understand their clinical usefulness.13 For all these reasons, the inclusion of polygenic risk to improve cardiovascular risk reclassification is still controversial and has not yet been included in clinical guidelines.8,14
This study is not without limitations. Firstly, it has a cross-sectional design in which the presence of atherosclerosis was determined and not the incidence of cardiovascular events, and therefore the potential prognosis may be different for atherosclerosis and for cardiovascular events. Moreover, the sample size for the analysis of specific minority polymorphisms is relatively small, and therefore only the polygenic risk equation was included in the analysis, not the specific polymorphisms. However, the aim of this study is to analyse the usefulness of including this algorithm, which has been validated at the population level11 for use at the individual level.
ConclusionsThe inclusion of polygenic risk in the calculation of clinical cardiovascular risk does not improve the ability to predict the presence of atherosclerosis in individuals classified as low or intermediate risk in a small cohort, as polygenic risk is not associated with the presence of subclinical atherosclerosis. The inclusion of additional biomarkers is necessary to improve the prediction of the presence of subclinical atherosclerosis and to calculate the risk of cardiovascular events with much greater precision and reliability than the equations currently available in clinical practice, and without the need for imaging tests as a first step in personalised assessment.
CRediT authorship contribution statementConception and design, EO, AJ, and GCB; data collection SL-R, EC-B, JMV, MB-L; data analysis and interpretation EO, AJ, JMV, MB-L, and GCB; drafting of the text EO and GCB; approval of the final version: all.
FundingThis work was funded by the Instituto de Salud Carlos III (PI21/00637) and by the FEA/SEA Clinical-Epidemiological Research Grant 2021 (both to GC-B).
The authors have no conflict of interests to declare.
We would like to thank everyone who took part in the study for their voluntary participation. CIBEROBN is an initiative of the Instituto de Salud Carlos III, Spain.


