


The Mediterranean diet (MDiet), reduces morbidity and mortality. The lockdown that took place in Spain between the months of March and May 2020 may have led to behavioural changes. The aim of the present study was to assess adherence to the MDiet at the end of the lockdown period and to compare it with the situation prior to it.
MethodsData were obtained by means of two online questionnaires, one at the beginning of lockdown and the other at the end, completed by adults from the Spanish population, who responded anonymously and voluntarily. The assessment of adherence to the MDiet was carried out using two questionnaires: Mediterranean Diet Adherence Screener (MEDAS) and modified PREDIMED, which contained 14 questions each. Other variables included were: age, gender, body mass index (BMI), Autonomous Community of origin, home living conditions, and level of studies achieved. At the end of the lockdown period, the comparison was made using the Student t statistic and the McNemar test.
ResultsA total of 207 people (137 women) participated, with a mean age 51.3 ± 12.4 years, age range: 20−83 years. After lockdown, BMI remained unchanged (initial 24.55 ± 3.7 kg/m2 and final 24.57 ± 3.7 kg/m2, P = .752), as well as fish consumption (initial 51.2%) and 60.9% at the end, P = .003) mainly due to the women and adherence to the Mdiet. The mean total score of MEDAS increased with 10.6 ± 2.0 at the beginning, and 10.57 ± 2.0 at the end; P = .001). This also occurred with the modified PREDIMED (9.47 ± 2.1 at the beginning and 9.93 ± 2.1 at the end, P < .001). Similarly, the proportion of participants that had a score classified as high at the beginning increased at the end of lockdown: from 80.7% initially in MEDAS to 87.9% at the end, P = .021, and from 68.6% initially in modified PREDIMED to 75.8% at the end, P = .037.
ConclusionsIn the study sample, during lockdown there were no changes in BMI, but there were increases in fish consumption and adherence to the MDiet.
La dieta mediterránea (DMed) reduce la morbimortalidad. El confinamiento ocurrido en España entre los meses de marzo y mayo de 2020 podría generar cambios conductuales, entre ellos la adherencia a la DMed. El objetivo del presente estudio ha sido valorar la citada adherencia al concluir dicho confinamiento y compararla con la situación previa al mismo.
MétodosLos datos se obtuvieron mediante dos cuestionarios en línea uno al comienzo del confinamiento y otro al final, en personas adultas procedentes de población española, las cuales respondieron de forma anónima y voluntaria. La valoración de la adherencia a la DMed se realizó a través de dos cuestionarios: Mediterranean Diet Adherence Screener (MEDAS) y PREDIMED modificado, los cuales contenían 14 cuestiones cada uno. Otras variables incluidas fueron: edad, género, índice de masa corporal (IMC), Comunidad Autónoma de procedencia, tipo de convivencia en domicilio y nivel de estudios alcanzado. Al concluir el confinamiento la comparación entre los cambios se realizó con el estadístico t de Student y la prueba de McNemar.
ResultadosParticiparon 207 personas (137 mujeres), edad media de 51,3 ± 12,4 años, intervalo de edad: 20−83 años. Transcurrido el confinamiento el IMC permaneció sin cambios (24,55 ± 3,7 kg/m2 inicial y 24,57 ± 3,7 kg/m2 final, p = 0,752), y sí el consumo de pescado (51,2% inicial y 60,9% al final, p = 0,003) a expensas fundamentalmente de las mujeres y la adherencia a la DMed, aumentando la puntuación total por término medio tanto en MEDAS (10,6 ± 2,0) al inicio y 10,57 ± 2,0 al final; p = 0,001) como en PREDIMED modificado (9,47 ± 2,1 al inicio y 9,93 ± 2,1 al final, p < 0,001). Igualmente, la proporción de los participantes que tenían una puntuación clasificada como alta al principio, aumentó al final del confinamiento: de 80,7% inicial en MEDAS a 87,9% al final, p = 0,021 y de 68,6% inicial en PREDIMED modificado a 75,8% al final, p = 0,037.
ConclusionesEn la muestra de nuestro estudio, durante el confinamiento no se apreciaron cambios en el IMC y sí aumentos en el consumo de pescado y en la adherencia a la DMed.
It is well known that the Mediterranean diet (Mdiet) is an essential element of a healthy lifestyle that reduces overall mortality, neurodegenerative diseases, diabetes, cancer incidence and cardiovascular diseases (CVD).1 The latter cause more than 4 million deaths per year in Europe (2.2 million women and 1.8 million men).2 Interest in the Mdiet started some time ago, when in February 1952 Ancel Keys, on crossing the Simplon tunnel and leaving Switzerland in winter weather (snow and cold) to enter northern Italy, noticed a remarkable change in the climate to spring weather, blue skies, flowers and birds singing. This made him realise that diet and lifestyle in this region might be important for health,3 and resulted in the landmark Seven Countries Study.4 Willett5 later described the Mediterranean dietary pattern, already known as appetising and to have health-giving effects, as a pyramid. In the same publication, he made positive mention of the “siesta”, which he translated as afternoon nap. The popularity of this lifestyle, observed in the northern Mediterranean countries, led UNESCO in 2010 to declare the Mdiet Intangible Cultural Heritage of Humanity. All that was left was to conduct a clinical, controlled, and randomised trial to provide maximum evidence of its benefits. This came in 2013 with the publication of the PREDIMED (PREvención con DIeta MEDiterránea) study.6 This study showed that the Mdiet enriched with extra virgin olive oil or nuts reduced the frequency of CVD and CVD-related mortality by 30% compared to the control group that followed a low-fat diet. Adherence to this diet can be measured. This is of great interest, especially as we know that acute behavioural changes occur in people when faced with unexpected and stressful situations such as illness, accidents, etc., which could change their dietary habits in terms of quantity (hypophagia or hyperphagia)7 or quality (of both foods and their preparation).8,9 Between March and May 2020, the Spanish population was put into lockdown to combat contagion and the high morbidity and mortality that the SARS-CoV-2 virus was causing in our country and around the world. This lockdown as an exceptional situation that required sudden adaptation to a new way of life, could therefore generate behavioural change and affect adherence to the Mdiet. The aim of the present study was to assess the degree of adherence to the Mdiet immediately before and after lockdown in a Spanish population.
Material and methodsAn observational, analytical, longitudinal, and prospective study that assessed adherence to the Mdiet immediately before and after the lockdown imposed in Spain due to the SARS-CoV-2 pandemic (between March and May 2020).
Instruments, participants, and variables included in the studyThe data were obtained through 2 online questionnaires that monitored adherence to the Mdiet in real time during the SARS-CoV-2 pandemic from the start of lockdown in March 2020 until one week after it had ended. The initial survey was available from 17 March, very shortly after the start of lockdown (15 March), and referred to habits before lockdown. The survey explained to each participant the purpose of the study and how the data would be used. The easy-to-read questionnaires consisted of closed, exhaustive, and mutually exclusive questions. It explained how to answer each question, ensuring they were clear and straightforward, and grouped them by related areas to facilitate the flow of the instrument. The final survey was completed between 11 and 17 May and gathered data from the last week of lockdown.
We used non-probabilistic, convenience sampling to select participants from the adult Spanish population who were able to complete the self-administered questionnaires. Thus, we were able to obtain the desired number of participants in the shortest possible time (an essential condition), and they completed the questionnaires voluntarily and anonymously.
The variables included in the questionnaire that was distributed, self-administered, and answered online, were age, sex, height, weight, body mass index (BMI) calculated indirectly (weight in kg/height in metres squared [kg/m2]), autonomous community of origin, home living conditions and level of education. In terms of BMI score, the participants were classified as normal weight (BMI between 18.5 and <25), overweight (BMI: 25–29.9), and obese (BMI ≥ 30).10
Measuring adherence to the Mediterranean dietTwo questionnaires that measure adherence to the Mdiet were assessed, the Mediterranean Diet Adherence Screener (MEDAS),11,12 and the PREDIMED6 questionnaire, which was modified by changing one of the 14 questions referring to the consumption of 7 or more glasses of wine per week. This question was not included in the terms defined by PREDIMED on the understanding that, as the study sample was in lockdown, the question might encourage greater alcohol consumption in general and wine in particular, and this was considered unethical. The question about drinking 3 or more glasses of wine per week, as proposed in MEDAS, was retained as a question in both questionnaires. The maximum score would be 14 points if the answers to the questions were affirmative. A cut-off point <9 points would indicate low adherence and ≥9, high adherence.13
Ethical aspectsThe participants completed the questionnaire anonymously and therefore their written informed consent was not required. Before they began the questionnaire, the aim of the study was explained to those who decided to participate, and their permission was requested to publish the results. The study was conducted in accordance with the Declaration of Helsinki and the guidelines of the Spanish Personal Data Protection Act (LOPD) 15/1999 were followed to collect the data.
Sample sizeFrom previous observations,14 we know that the change in adherence to the Mdiet monitored for 13.6 months was .9 and its standard deviation (SD) was 2.0. With these data, we estimated the standardised effect size by dividing the expected observed change (.9) by the corresponding SD (2.0), i.e., .45. Assuming an accepted risk of making a 5% α error (bilateral α of .05), a β error of 1% (β of .01) and, therefore a power for the study of 99%, the minimum number of participants required was 181.15,16
Statistical analysisSPSS version 24, licensed by the University of Castilla-La Mancha, was used for the data analysis. The data were collected on a computer platform. The necessary variables had to be sorted, coded, and cleansed to be analysed. Two questionnaires were assessed, the Mediterranean Diet Adherence Screener (MEDAS) and the modified PREDIMED questionnaire. Qualitative variables are presented as absolute numbers and percentages. Quantitative variables are presented as means and SD. The relationship between qualitative variables was found using the χ2 or Fisher’s exact test, if more than 20% of the boxes had an expected frequency of less than 5. Comparison between the means of quantitative variables, when they had 2 categories, was made both for independent groups (Student’s t or Mann–Whitney U test if the variable’s behaviour was not normal) and related groups (paired Student’s t or Wilcoxon test, if the variable’s behaviour was not normal). If the groups had more than 2 categories, one-way analysis of variance or the non-parametric Kruskal–Wallis test was used if conditions of normality were not met. If there were significant results, an a posteriori Bonferroni test was applied to establish the groups between which significant differences were found. The participants completed the final survey after 6 weeks. The McNemar test was used to compare between the initial and final results in dichotomous variables. A p-value less than or equal to .05 was considered significant.
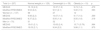
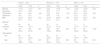
ResultsA total of 490 respondents completed the initial questionnaire, of whom less than half (42.2%) also completed the final questionnaire; 207 participants met this criterion and comprise the sample of the present study. Because those who did not take part in the final questionnaire constituted a high loss (57.8%), all the variables were compared between those who completed both surveys (207 people) and those who only completed the first survey (283 people). No statistically significant differences were found, except that those who dropped out were younger (47.0 ± 12.6 versus 51.3 ± 12.4; p < .001), and consumed more than 3 servings of commercial sweets and pastries per week (31.4% vs. 21.7%; p = .017). Therefore, given that the differences, although significant, were not relevant, we can state that the sample analysed did not differ from the sample that dropped out. Table 1 shows the participants’ level of education, their home living conditions and their autonomous community of origin, in the sample as a whole and with their distribution by sex. The high number of graduates (especially among the women) and those with a doctorate is striking, without there being statistically significant differences. Home living conditions varied greatly, most households comprising couples or couples with children. The origin of the individuals is also broad, as it covered 16 autonomous communities; most of the volunteers came from Catalonia, Castilla-La Mancha, Asturias, Castilla y Leon, Madrid, and the Basque Country. As they are grouped into logical geographical regions (north, centre, and Mediterranean coast), no statistical significance by sex was observed. On the other hand, all the variables shown in Table 2 show significant differences by sex: the men were older, had a higher BMI, were more overweight and obese, and scored higher on adherence to the Mdiet, in the MEDAS questionnaire and in the modified PREDIMED. Comparing the questions of the Mdiet adherence questionnaire (Table 3), we conclude that the men drink significantly more wine per week and consume significantly more pulses than the women. Table 4 shows the relationship between adherence to the Mdiet and the participants being overweight or obese, without showing statistical significance in the comparison of means, in either the total sample or by gender. Table 4B shows the relationship between the Mdiet and educational level and the detailed significant differences, especially in the total sample and in the MEDAS questionnaire in the men, which in general correspond to a higher score the higher the level of education.
The participants’ level of education, home living conditions and autonomous community of origin during lockdown, overall and stratified by sex.
| Variables | Total (n = 207) | Women (n = 137) | Men (n = 70) | p |
|---|---|---|---|---|
| Level of education | ||||
| Primary, secondary, or vocational training | 31 (15.0) | 19 (13.9) | 12 (17.1) | |
| Diploma or degree | 135 (65.2) | 96 (70.1) | 39 (55.7) | .097 |
| Doctorate | 41 (19.8) | 22 (16.1) | 19 (27.1) | |
| Home living conditions | ||||
| Living alone | 31 (15.0) | 21 (15.3) | 10 (14.3) | |
| With a partner | 81 (39.1) | 50 (36.5) | 31 (44.3) | .786 |
| With children | 26 (12.6) | 17 (12.4) | 9 (12.9) | |
| With parents or in-laws | 9 (4.3) | 7 (5.1) | 2 (2.9) | |
| With flatmates | 1 (.5) | 1 (.7) | 0 (.0) | |
| Partner + children | 53 (25.6) | 37 (27.0) | 16 (22.9) | |
| Partner + children + parents or in-laws | 1 (.5) | 0 (.0) | 1 (1.4) | |
| Partner + parents or in-laws | 4 (1.9) | 3 (2.2) | 1 (1.4) | |
| Parents or in-laws + flatmates | 1 (.5) | 1 (.7) | 0 (.0) | |
| Home living conditions grouped | ||||
| Living alone | 31 (15.0) | 21 (15.3) | 10 (14.3) | |
| In a couple | 81 (39.1) | 50 (36.5) | 31 (44.3) | .749 |
| Partner + children | 53 (25.6) | 37 (27.0) | 16 (22.9) | |
| Other | 42 (20.3) | 29 (21.2) | 13 (18.6) | |
| Autonomous Communities | ||||
| Andalusia | 7 (3.4) | 3 (2.2) | 4 (5.7) | |
| Aragon | 9 (4.3) | 3 (2.2) | 6 (8.6) | 0.024 |
| Canary Islands | 2 (1.0) | 2 (1.5) | 0 (.0) | |
| Cantabria | 1 (.5) | 1 (.7) | 0 (.0) | |
| Castilla-La Mancha | 54 (26.1) | 33 (24.1) | 21 (30.0) | |
| Castilla y León | 14 (6.8) | 7 (5.1) | 7 (10.0) | |
| Catalonia | 64 (30.9) | 49 (35.8) | 15 (21.4) | |
| Madrid | 14 (6.8) | 11 (8.0) | 3 (4.3) | |
| Navarra | 1 (.5) | 1 (.7) | 0 (.0) | |
| Valencian Community | 7 (3.4) | 4 (2.9) | 3 (4.3) | |
| Basque Country | 14 (6.8) | 13 (9.5) | 1 (1.4) | |
| Extremadura | 1 (.5) | 0 (.0) | 1 (1.4) | |
| Galicia | 1 (.5) | 1 (.7) | 0 (.0) | |
| Balearic Islands | 1 (.5) | 0 (.0) | 1 (1.4) | |
| Principality of Asturias | 15 (7.2) | 9 (6.6) | 6 (8.6) | |
| Region of Murcia | 2 (1.0) | 0 (.0) | 2 (2.9) | |
| Autonomous Communities grouped | ||||
| North | 41 (19.8) | 28 (20.4) | 13 (18.6) | |
| Centre | 83 (40.1) | 51 (37.2) | 32 (45.7) | .492 |
| Mediterranean coast | 83 (40.1) | 58 (42.3) | 25 (35.7) |
The data are shown as exact number and (percentage). The χ2 test was used to compare proportions between women and men.
The northern area comprises the following Autonomous Communities: Galicia; Principality of Asturias; Cantabria; Basque Country; Community of Navarra and Aragon. The central area: Extremadura; Castilla y León; Community of Madrid and Castilla-La Mancha. The Mediterranean coastal area: Catalonia; Valencian Community; Region of Murcia; Balearic Islands; Andalusia and Canary Islands.
n: number of participants; p: level of significance.
A p-value of ≤.05 was considered significant.
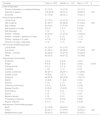
Characteristics of the main variables obtained in the initial sample stratified by sex. Comparison between the women and the men.
| Total (n = 207) | Women (n = 137) | Men (n = 70) | p | |
|---|---|---|---|---|
| Age in years [range] | 51.3 (12.4) [20−83] | 49.3 (12.3) [20−77] | 55.2 (11.5) [26−83] | .001 |
| Weight in kg | 68.6 (13.3) | 63.6 (11.9) | 78.5 (10.1) | <.001 |
| Height in cm | 166.8 (8.6) | 162.8 (6.6) | 174.5 (6.5) | <.001 |
| BMI (kg/m2) | 24.6 (3.7) | 23.9 (4.0) | 25.7 (2.9) | <.001 |
| Classification according to BMI: n (%) | ||||
| Normal weight | 129 (62.3) | 98 (71.5) | 31 (44.3) | |
| Overweight | 59 (28.5) | 27 (19.7) | 32 (45.7) | .001 |
| Obesity | 19 (9.2) | 12 (8.8) | 7 (10.0) | |
| Adherence to the Mediterranean diet (MEDAS) | 10.16 (2.0) | 9.93 (2.0) | 10.63 (2.1) | .019 |
| Adherence to the Mediterranean diet (modified PREDIMED) | 9.47 (2.1) | 9.22 (2.0) | 9.97 (2.2) | .015 |
The data are shown as means and (standard deviation), except for obesity, which is shown as frequencies and percentages. The Student’s t-test for independent groups was used to compare between means, after applying Levene’s test for Equality of Variances. The obesity variable was compared using the χ2 test.
BMI: body mass index; cm: centimetres; kg: kilograms; MEDAS: Mediterranean Diet Adherence Screener; m: meters; n: number of participants; p: level of significance; PREDIMED: Prevention with the Mediterranean diet.
A p-value ≤.05 was considered significant.
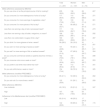
Questions and affirmative answers required to calculate adherence to the Mediterranean diet. Qualitative comparison of adherence between the men and the women.
| Total | Women | Men | p | |
|---|---|---|---|---|
| (n = 207) | (n = 137) | (n = 70) | ||
| Mdiet adherence (assessed by MEDAS) | ||||
| Do you use olive oil as the principal source of fat for cooking? | 205 (99.0) | 136 (99.3) | 69 (98.6) | .627 |
| Do you consume 2 or more tablespoons of olive oil a day? | 177 (85.5) | 115 (83.9) | 62 (88.6) | .371 |
| Do you consume 2 or more servings of vegetables a day? | 153 (73.9) | 103 (75.2) | 50 (71.4) | .561 |
| Do you consume 3 or more pieces of fruit a day? | 109 (52.7) | 66 (48.2) | 43 (61.4) | .071 |
| Less than one serving a day of red or processed meat? | 171 (82.6) | 116 (84.7) | 55 (78.6) | .273 |
| Less than one serving a day of butter, margarine, or cream? | 186 (89.9) | 122 (89.1) | 64 (91.4) | .592 |
| Less than one carbonated or sugary drink a day? | 183 (88.4) | 123 (89.8) | 60 (85.7) | .387 |
| Do you drink 3 or more glasses of wine a week? | 58 (28.0) | 26 (19.0) | 32 (45.7) | < .001 |
| Do you eat 3 or more servings of pulses a week? | 101 (48.8) | 55 (40.1) | 46 (65.7) | < .001 |
| Do you eat 3 or more servings of fish or seafood a week? | 106 (51.2) | 67 (48.9) | 39 (55.7) | .354 |
| Do you consume commercial sweets or pastries less than 3 times a week? | 162 (78.3) | 107 (78.1) | 55 (78.6) | .938 |
| Do you consume nuts once a week or more? | 173 (83.6) | 113 (82.5) | 60 (85.7) | .553 |
| Do you prefer to eat white meat rather than red? | 166 (80.2) | 112 (81.8) | 54 (77.1) | .431 |
| Do you eat sofrito twice a week or more? | 154 (74.4) | 99 (72.3) | 55 (78.6) | .325 |
| Mdiet adherence (modified PREDIMED) | ||||
| Do you consume 4 or more tablespoons of olive oil a day? | 85 (41.1) | 50 (36.5) | 35 (50.0) | .062 |
| Do you eat nuts 3 or more times a week? | 122 (58.9) | 81 (59.1) | 41 (58.6) | .939 |
| Mdiet adherence (MEDAS) | ||||
| Low-moderate | 40 (19.3) | 29 (21.2) | 11 (12.9) | .347 |
| High | 167 (80.7) | 108 (78.8) | 59 (84.3) | |
| Adherence to the Mediterranean diet (modified PREDIMED) | ||||
| Low | 65 (31.4) | 48 (35.0) | 17 (24.3) | |
| High | 142 (68.6) | 89 (65.0) | 53 (75.7) | .115 |
The data are shown as exact number and (percentage). The χ2 test was used to compare proportions between the women and the men.
Mdiet: The Mediterranean diet; MEDAS: Mediterranean Diet Adherence Screener; n: number of participants; p: level of significance; PREDIMED: Prevention with the Mediterranean diet.
A p-value ≤.05 was considered significant.
A. Relationship between adherence to the Mediterranean diet and weight distribution measured by BMI in the initial sample as a whole and differentiated by sex.
| Total (n = 207) | Normal weight (n = 129) | Overweight (n = 59) | Obesity (n = 19) | p |
|---|---|---|---|---|
| MEDAS | 10.13 (2.2) | 10.37 (1.9) | 9.74 (1.4) | .479 |
| Modified PREDIMED | 9.53 (2.2) | 9.51 (2.1) | 9.00 (1.5) | .593 |
| Women (n = 137) | 98 | 27 | 12 | |
| MEDAS | 9.98 (2.2) | 10.07 (1.0) | 9.17 (1.5) | .369 |
| Modified PREDIMED | 9.37 (2.2) | 9.00 (1.4) | 8.50 (1.6) | .318 |
| Men (n = 70) | 31 | 32 | 7 | |
| MEDAS | 10.61 (2.1) | 10.63 (2.4) | 10.71 (0.76) | .994 |
| Modified PREDIMED | 10.03 (2.1) | 9.94 (2.5) | 9.86 (1.1) | .975 |
| B. Relationship between adherence to the Mediterranean diet and level of education in the initial sample as a whole and differentiated by sex | ||||
|---|---|---|---|---|
| Total (n = 207) | Primary, secondary, or vocational training (n = 31) | Diploma or degree (n = 135) | Doctorate (n = 41) | p |
| MEDAS | 9.65 (2.5) | 10.02 (1.9) | 11.02 (1.9) | .006a |
| Modified PREDIMED | 9.00 (2.4) | 9.36 (2.0) | 10.20 (2.1) | .034b |
| Women (n = 137) | 19 | 96 | 22 | |
| MEDAS | 9.79 (2.2) | 9.78 (1.9) | 10.68 (1.9) | .146 |
| Modified PREDIMED | 9.16 (2.2) | 9.09 (2.0) | 9.82 (2.2) | .325 |
| Men (n = 70) | 12 | 39 | 19 | |
| MEDAS | 9.42 (3.0) | 10.62 (1.8) | 11.42 (1.7) | .034c |
| Modified PREDIMED | 8.75 (2.7) | 10.03 (2.0) | 10.63 (2.0) | .060 |
The data are shown as means and standard deviation (SD). One-way analysis of variance was used to compare between means.
MEDAS: Mediterranean Diet Adherence Screener; n: number of participants; p: level of significance; PREDIMED: Prevention with the Mediterranean diet.
A p-value ≤.05 was considered significant.
After applying an a posteriori Bonferroni test, significant differences were found between the means of participants educated to primary level and doctorate level, on the one hand (p = .013) and between those with a diploma and doctorate (p = .016) on the other.
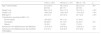
Table 5 shows the data obtained after the Spanish lockdown had come to an end. No changes in weight were observed in the total sample, as on average it remained within the weight considered normal (BMI < 25 kg/m2). There were significant changes in the women (p = .048), whose mean BMI increased by a very small amount, remaining within normal ranges at the beginning as well as at the end of the study. The same table shows that high adherence to the Mdiet increased significantly in the sample as a whole (MEDAS in the women), tending towards statistical significance in the case of the modified PREDIMED (p = .063). To assess whether the changes experienced during lockdown differed between the women and the men in Mdiet adherence score, these increases were compared after the end of the study. They can be seen in Table 6, where an increase in adherence to the Mdiet is observed in all cases, with no significant differences by sex. Fig. 1 clearly illustrates the changes in the Mdiet adherence score. It can be appreciated that in all cases the mean Mdiet adherence scores increase, both in MEDAS and PREDIMED, although statistical significance is reached in the total sample, mainly thanks to the women. The significant changes may be because out of all the PREDIMED questionnaire participants, 103 (49.8%) had an increased score, it remained unchanged in 50 (24.2%), and 54 (26.1%) had a lower score. In the MEDAS questionnaire the changes were similar: 101 (48.8%) improved their score, 50 (24.2%) had no change and 56 (27.1%) had a lower score.
Changes in adherence to the Mediterranean diet and in BMI at the end of lockdown.
| Total (n = 207) | Women (n = 137) | Men (n = 70) | |||||||
|---|---|---|---|---|---|---|---|---|---|
| Initial | Final | p | Initial | Final | p | Initial | Final | p | |
| MEDAS adherence | 10.16 (2.0) | 10.57 (2.0) | .001 | 9.93 (2.0) | 10.46 (1.7) | <.001 | 10.63 (2.1) | 10.80 (2.4) | .472 |
| PREDIMED adherence | 9.47 (2.1) | 9.93 (2.1) | <.001 | 9.22 (2.0) | 9.76 (1.9) | <.001 | 9.97 (2.1) | 10.27 (2.5) | .218 |
| BMIa | 24.55 (3.7) | 24.57 (3.7) | .752 | 23.94 (4.0) | 24.06 (4.1) | .048 | 25.75 (2.9) | 25.57 (2.7) | .093 |
| MEDASb | |||||||||
| Low-moderate | 40 (19.3) | 25 (12.1) | 29 (21.2) | 14 (10.2) | 11 (15.7) | 11 (15.7) | |||
| High | 167 (80.7) | 182 (87.9) | .021 | 108 (78.8) | 123 (89.8) | .003 | 59 (84.3) | 59 (84.3) | 1.000 |
| PREDIMEDb | |||||||||
| Low | 65 (31.4) | 50 (24.2) | 48 (35.0) | 37 (27.0) | 17 (24.3) | 13 (18.6) | |||
| High | 142 (68.6) | 157 (75.8) | .037 | 89 (65.0) | 100 (73.0) | .063 | 53 (75.7) | 57 (81.4) | .454 |
BMI: body mass index; MEDAS: Mediterranean Diet Adherence Screener; n: number of participants; p: level of significance; PREDIMED (modified): Prevention with the Mediterranean diet.
A p-value ≤.05 was considered significant.
Evolution of the increase in the Mediterranean diet adherence score and its comparison between the women and the men at the end of lockdown.
| Increase in adherence to the Mediterranean diet | Total (n = 207) | Women (n = 137) | Men (n = 70) | p |
|---|---|---|---|---|
| Δ final-initial | Δ final-initial | Δ final-initial | ||
| MEDAS | .41 (1.8) | .53 (1.7) | .17 (2.0) | .169 |
| Modified PREDIMED | .46 (1.8) | .54 (1.7) | .30 (2.0) | .369 |
The data are shown as means and (standard deviation). The Student’s t-test for independent groups was used to compare means between the women and the men. Δ: increase.
MEDAS: Mediterranean Diet Adherence Screener.
n: number of participants.
p: level of significance.
PREDIMED: Prevention with the Mediterranean diet.
A p-value ≤.05 was considered significant.
 were women and 70 (33.8%) men. The Student’s t-test for paired groups was used to compare means. Adh: adherence.")
Mean score obtained in adherence to the Mediterranean diet, assessed by both the MEDAS and modified PREDIMED questionnaires. There was a total of 207 participants, of whom 137 (66.2%) were women and 70 (33.8%) men. The Student’s t-test for paired groups was used to compare means.
Adh: adherence.
In terms of the evolution of each of the 14 questions comprising both the MEDAS and the modified PREDIMED questionnaires, Fig. 2 shows how, in general, the positive responses resulting in a higher Mdiet adherence score increase, especially the questions on consuming more than 4 tablespoons of olive oil per day and on the intake of fish and seafood: in both cases, levels of statistical significance were reached, both in the total sample and in the women.
Discussion Total participants. (B) Women. (C) Men.")
The results of the present study show that during lockdown there were no changes in body weight, except for a small increase in the women, and adherence to the Mdiet increased. This is good news as, in addition to lowering the frequency of CVD,1 it also reduces all-cause mortality in patients who have already had a cardiovascular disease.17 Like Konieczna et al.,18 we found no changes in weight. These authors, after a 5-year follow-up, observed a change in BMI from 30.0 ± 3.8 kg/m2 to 29.9 ± 3.9 kg/m2. The differences from our results are (1) that their initial BMI was obese on average and in our case, weight was normal on average and (2) the duration of the study, as in our case this corresponded to the duration of lockdown.
The same explanation could be offered if compared with the PREDIMED6 study itself, whose mean scores (between 29.7 and 30.2 kg/m2) were similar to those of Konieczna et al.18 at the beginning of the study. In contrast, other studies conducted during the pandemic have observed an increase in weight (BMI = 25.0 ± 6.3 kg/m2at the start and 27.0 ± 5.7 kg/m2 at the end), albeit in pregnant women.19
Di Renzo et al.,20 at the end of the Italian lockdown, reported that 37% of the participants stated that their weight had remained stable, and had slightly increased in 40.3%. They do not give BMI scores, which makes comparison difficult, but this could well correspond to the discrete weight gain observed in the women in our study.
With slight differences, Sánchez-Sánchez et al.,21 in their study carried out in Spain during lockdown, found normal weight in 61.3% of the women and 46.6% of the men; our study, in 71.5% of the women and 44.3% of the men; overweight in 22.9% of the women and 41.7% of the men compared to 19.7% of the women and 45.7% of the men in our study, these figures show more similarities than differences, which could well be explained by the origin and characteristics of the sample. Because theirs was a cross-sectional study, it was not possible to assess how weight evolved, although they report that 47.3% of the participants stated that their weight had not changed during lockdown and 37.3% reported a weight gain of between 1 kg and 3 kg.
Regarding the score obtained at the start of the study in Mdiet adherence, Tobías et al.13 observed a mean score of 8.9 ± 2.7 points in patients with ischaemic heart disease, half a point lower than our score (9.47 ± 2.1 points). This difference might be explained by our group’s modification to the PREDIMED questionnaire in the question referring to wine consumption and by the characteristics of the population assessed. The same explanation could be given when comparing the percentage obtained in the patients classified as high-scoring, slightly higher in our study sample (68.6%) compared to the score obtained by the patients with ischaemic heart disease (63%).
In terms of the components of the questions defining adherence to the Mdiet, the data that we obtained for the sample as a whole at the start of the study are higher than those found by Di Renzo et al.,20 except that they report that their population consumes more than 4 tablespoons of olive oil (51.7%) and more pulses (51.7%) than ours (41.1% and 48.8%, respectively). In Spain, Sánchez-Sánchez et al.,21 with a study design similar to ours, also scored higher on the following items: consumption of more than 4 tablespoons of olive oil (47.1%; ours 41.1%), consumption of less than one serving per day of red meat (87.1%; ours 82.6%), consumption of less than one serving per day of butter (96.5%; ours 89.9%) and consumption of more white meat than red meat (81.2%; ours 80.2%). When comparing the questions measuring Mdiet adherence before and after lockdown, we observed the changes shown in Figs. 1 and 2. These changes are favourable in almost all the questions, where the increase stands out significantly in those consuming more than 4 tablespoons of olive per day (p = .005) and those consuming fish or seafood (p = .003), especially the women (p = .031 and p = .008, respectively). Our data agree in terms of evolution, not percentage, with those observed by Sánchez-Sánchez et al.21: in their study, consumption of more than 4 tablespoons of olive oil per day increased to 52.9% (p < .001), very similar to us (51.2%; p = .005). They also observed increases in fish consumption (from 23.9% to 28.4%; p < .001), a lower percentage than we observed in both periods (from 51.2% to 60.9%; p=.003). They observed significant changes in the rest of the questions, we did not.
Similarly, Pérez-Rodrigo et al.,22 although they did not assess adherence to the Mdiet, reported a 20% increase in fish consumption. They also reported that women consumed more healthy foods than men, similar to our group’s finding.
It is also worth mentioning that our study sample significantly increased their fish consumption, as the concept of the pesco-Mediterranean diet (which emphasises the consumption of fish and seafood as the main source of protein) has recently become established as the cardioprotective diet of choice.23 In fact, ethyl eicosapentanoic acid, a highly purified and stable derivative of eicosapentaenoic acid, has been shown to reduce CVD, including cardiovascular mortality.24 The score we obtained both at the beginning and at the end of lockdown, starting from a high score, increased even further on average (Fig. 1). Rodríguez-Pérez et al.25 found an increase in mean score of .8 points (6.5 ± 2.0 before and 7.3 ± 1.9 after lockdown; p < .001), higher than that obtained by us: .46 points (9.47 ± 2.1 initial and 9.93 ± 2.1 final; p < .001), although our mean values were higher. This increase in score is very similar to that observed by Medrano et al.26 (.5 ± 2.2), but admittedly these figures cannot be compared, as they are from the paediatric population (12.1 ± 2.9 years) and use a different Mdiet adherence table (KIDMED). With this last mention, we wanted to show that the results found during lockdown tend to increase the mean Mdiet adherence score in different populations, except in pregnant women, where no changes were found.19
Strengths and limitationsWe believe that the main limitations of the study are its participant sampling type (convenience) and the questionnaire (completed at home), which could lead to errors in completing it as it may encourage bias towards socially accepted responses. On the positive side, however, privacy could increase the validity of responses. However, these limitations are difficult to resolve, as lockdown at home was limiting and therefore interviews were not possible, yet this, again in a positive sense, eliminates interviewer bias. These assumptions are like those of other authors who conducted studies during lockdown. Another limitation was not including physical activity during lockdown in the questionnaire, but we chose this because, on the one hand, our main objective was to assess adherence to the Mdiet and, on the other, we sought a tool that was simple and uncomplicated to complete, since the nature of the study was not cross-sectional but longitudinal and a long or complicated questionnaire could result in many losses. Another strength was how rapidly the design, method and online platform were completed in real time during the height of the pandemic and therefore of lockdown, which minimised any errors that could occur had it been a distant memory.
ConclusionsWe only observed changes in BMI in our study in the women. Adherence to the Mdiet increased in both the MEDAS and the modified PREDIMED questionnaire, as did fish consumption. The proportion classified as high adherence to the Mdiet also increased.
Conflict of interestsThe authors have no conflict of interests to declare.
We would like to thank everyone who collaborated voluntarily in the study, since as well as understanding the importance of their participation, they spent valuable time in filling in the requested information.
Please cite this article as: Carbayo Herencia JA, Rosich N, Panisello Royo JM, Carro A, Allins Presas J, Panisello M, et al. Influencia del confinamiento ocurrido en España debido a la pandemia por el virus SARS-CoV-2 en la adherencia a la dieta mediterránea. Clinica e Investigacion en Arteriosclerosis. 2021;33:235–246.