


Knowledge about the harmful effects of high levels of low-density lipoprotein cholesterol (cLDL) in adults increased after the publication of various guidelines, leading to closer control and more treatment. We hypothesized that these health care changes would result in an overall improvement in the lipid profile of the population.
ObjectiveTo determine the evolution of the lipid profile in the population of Spain from the Diet and Risk of Cardiovascular Disease in Spain cohort.
MethodsA comparison was made between the baseline population-based probabilistically sampled DRECE cohort (DRECE 1 study, 1992–1994, n=4787) and its 13 years later revisit (DRECE 3 study, 2005–2007). A cross-sectional comparison was made of the overall population of DRECE1 and DRECE3, including only individuals aged 20 to 60 years (inter-individual variations). For subjects participating in both DRECE1 and DRECE3 (n=1039), individual variations over time (intra-individual analyses) were examined.
ResultsIn the overall population, the prevalence of lipid-lowering therapy increased from 3.8% in DRECE1 to 10.7% in DRECE3. Comparing the lipid profile of the population aged 20–60 years in DRECE1 with the same age group in DRECE3, an overall decrease is observed in total cholesterol from a mean of 203.31mg/dl (SD 43.51) in 1992–1994 to 196.31mg/dl (SD 38.53) in 2005–2007, and in cLDL from a mean of 125.78mg/dl (SD 38.53) to 121.37mg/dl (SD 34.22). The proportion of the population with total cholesterol >200mg/dl decreased from 51% in DRECE1 to 47% in DRECE3, although this difference did not reach statistical significance (p=0.077). As regards the intra-individual analyses, total cholesterol increased from DRECE1 to DRECE3 in men and women younger than 40 years at baseline, but decreased in those who were older. Index of individuality for total cholesterol, cLDL, cHDL and triglycerides ranged from 0.53 to 0.87.
ConclusionsThe lipid profile of the Spanish population improved between 1992–1994 and 2005–2007. Within individuals, lipid concentrations, especially total cholesterol and cLDL have increased, although the trend is favorable in the middle-age group (40–59 years). These changes seem to be due to several causes, impacted by dietary and lifestyle factors, and also by a greater emphasis in lipid-lowering therapy in middle-aged people. Lipid parameters had a low index of individuality, which limits their usefulness as population reference values.
Los efectos nocivos de los altos niveles de colesterol ligado a lipoproteínas de baja densidad (cLDL) han sido ampliamente difundidos en la literatura científica y popular. Nuestra hipótesis es que estas recomendaciones han influido eficazmente en el perfil lípido de la población española.
ObjetivoDeterminar la evolución del perfil de lípidos en la población de España a partir de la cohorte Dieta y riesgo de enfermedad cardiovascular en España (DRECE).
MétodosSe comparó la cohorte de partida DRECE (estudio DRECE1, 1992-1994, n=4.787), procedente de muestreo probabilístico poblacional, con su reevaluación a los 13 años (estudio DRECE3, 2005-2007). Se compararon de modo transversal las muestras DRECE1 y DRECE3, incluyendo solo sujetos entre 20 y 60 años (variaciones interindividuales). De los sujetos que participaron en ambos estudios (n=1.039) se examinaron las variaciones interindividuales a lo largo del tiempo (análisis intraindividual).
ResultadosEn la población general, la prevalencia de la terapia hipolipidemiante aumentó de 3,8% en DRECE1 a 10,7% en DRECE3. Al comparar el perfil lipídico de la población de 20 a 60 años en DRECE1 con el mismo grupo de edad en DRECE3 disminuye la media del colesterol total de 203,31mg/dl (DS 43,51) en 1992-1994 a 196,31mg/dl (DS 38,53) en 2005-2007, la media del cLDL disminuye de 125,78mg/dl (DS 38,53) a 121,37mg/dl (DS 34,22). La proporción de la población con colesterol total>200mg/dl se redujo de 51% en DRECE1 al 47% en DRECE3, aunque esta diferencia no fue significativa (p=0,077). Respecto del análisis intraindividual el colesterol total aumentó de DRECE1 a DRECE3 en hombres y mujeres menores de 40 años al inicio de la cohorte, y descendió en los mayores de 40. El índice de individualidad del colesterol total, cLDL, cHDL y triglicéridos osciló entre 0,53 y 0,87.
ConclusionesEl perfil lipídico de la población española mejoró entre 1992-1994 y 2005-2007. La concentración intraindividual de lípidos aumentó ligeramente, especialmente el colesterol total y cLDL, pero la tendencia fue más favorable en los sujetos de edad media (40-59 años). Estos cambios parecen ser multicausales, influidos por factores dietéticos y de estilo de vida, y también por un mayor énfasis en la terapia hipolipidemiante en sujetos en edad media. Los parámetros lipídicos tenían un bajo índice de individualidad, lo que limita su utilidad como valores de referencia poblacionales.
Lifestyle changes in industrialized countries resulted in increased incidence of cardiovascular disease during the twentieth century. In the United States, cardiovascular disease became the leading cause of morbidity and mortality by the 1920s; in Spain, this did not happen until the 1950s, and the incidence of cardiovascular disease remains lower than in neighboring countries.1–3
The incidence of cardiovascular disease continued to rise through the 1960s, when epidemiological studies provided evidence about its causes. Improvements in the quality and availability of medical care, together with increased awareness and responsibility among the population due to media campaigns, have helped lower the incidence of cardiovascular events in recent years.4
Population-based studies have shown that lipid concentrations increase with age. However, it is not clear to what extent this increase is due to changes in lifestyle or to other factors associated with aging.5
Furthermore, biological variability in laboratory parameters should be considered to understand lipid concentrations. Analytes vary between subjects (interindividual variability) and within then same subject over time (intraindividual variability).
The DRECE1 (the acronym for “Diet and Risk of Cardiovascular Disease in Spain” in Spanish) study was designed to determine the cardiovascular situation of the Spanish population in the period comprising 1992 through 1994 by considering the prevalence of the main risk factors identified in previous studies and their relation to eating habits.6–8 DRECE1 found a mean prevalence of high cholesterol concentrations (serum cholesterol >200mg/dl) of 51% in the population aged 20–60 years; moreover, there were clear differences in lipid concentrations between different age groups.
However, the publication of various recommendations in the late 1990s raised awareness of the risks posed by low-density lipoproteins (LDL) in the medical community and general population, resulting in closer control and more widespread treatment.9–12 Thus, we hypothesized that this health care changes would result in an overall improvement in the lipid profile of the population.
We aimed to analyze changes in serum lipid profile within and between individuals in a representative sample of the Spanish population followed for 14 years between the DRECE1 (1992–1994) and DRECE3 (2005–2007) studies.
MethodsPopulation studiedSelection: Participants in this population-based cohort, DRECE1 (1992–1994), were randomly selected by a multistage sampling process described elsewere,6 briefly, within the 8 national divisions from Ministry of Agriculture Fisheries and Food, conglomerates were used to recruit the participants, with proportional strata by age and sex. So, sample was considered representative of the entire population of Spain between the ages of 5 and 60 years.
Approximately 14 years later we revisited the DRECE1 cohort for the DRECE3 study, from 2005 to 2007. The DRECE3 cohort (1039 individuals; age range, 15–70 y; follow-up, 12–14 y) was selected based on the viability of their location at the time of the study.13,14
We analyzed possible selection and participation biases by comparing characteristics of individuals included in the DRECE3 cohort with those of individuals who were not included. This analysis included sex, age, and baseline prevalence of risk factors and biologic parameters.
As main analysis we did two types of comparisons: a) longitudinal comparisons (intraindividual: comparing the data obtained in DRECE1 with those obtained in DRECE3 within the same individuals) and b) cross-sectional comparisons (interindividual). In the longitudinal comparison, we included all individuals in DRECE3, and we compared the values of the objective variables with those obtained in DRECE1 (mean follow-up, 13.4 y). In the cross-sectional comparison, we included only individuals aged between 20 and 60 years (the same age groups for each point in time; thus, each group contained different individuals from the same cohort) stratified into two age groups (20–39 y and 40–59 y), and we compared the mean values of the objective variables obtained within each age and sex group in DRECE1 with those obtained in DRECE3.
Analytical methodsTotal cholesterol (CT), triglycerides, and high-density lipoprotein cholesterol (cHDL) were determined using the same methods as in DRECE1,6 and LDL cholesterol (cLDL) was estimated using the Friedewald formula.6 Lipid determinations were centralized in the Fundación Jiménez Díaz laboratory All procedures fulfilled the requirements for laboratory practicability (total error <13%) and passed external quality control.
Statistical analysesWe used SPSS v12 for all analyses. For descriptive analyses, data were stratified by sex and age. For the intraindividual analyses, we used Student's t-test for paired samples for the entire population and for populations stratified by sex and age to compare data obtained in DRECE3 with those obtained from the same individuals in DRECE1. For the interindividual analyses, we used ANOVA for independent samples to compare the data for the entire population and for populations stratified by sex and age (20–39 and 40–59 y) in DRECE3 versus DRECE1. Due to the asymmetric distribution of the triglycerides, logarithmic transformation was used for their analysis, although the results were then retransformed into conventional units.
We used the Clinical and Laboratory Standards Institute's EP-5A protocol to analyze the variability in each magnitude measured.
To calculate the components of biological variability15,16 from the total variance (S2tw), we used the following formulas: S2bB=S2t−S2bw−S2a, where S2tw represents the total intraindividual variance equivalent to the means of the differences (S2) observed for each individual and S2t the total variation corresponding to all the individuals in the study. From these data, we obtained the intraindividual and interindividual coefficients of variation and the index of individuality (I.I.=CVbw/CVbB).17,18
To define the differences between successive measurements that might indicate a change in an individual's health status, we calculated the magnitude of the least significant change, reference change value (RCV), according to the following formula: for a 90% confidence interval or for a 95% confidence interval, where CVbw2 represents the intraindividual variability and CVa the analytical variability.
Anlaytes with low individuality (defined as an I.I. higher than 1.4) allow the use of population reference values, as intraindividual variability would span only a small part of them. In contrast, high individuality (I.I.<0.6) makes population reference values of little utility for detecting unusual results in most individuals.19,20 If index of individuality is low (which means high individuality), stratification can increase it, improving its utility, or measures like RCV should be used.
ResultsDRECE3 included only 1039 of the 4787 individuals that participated in DRECE1; this low participation was due to problems in locating many of the individuals or in the availability of the initial collaborating centers. Nevertheless, the analysis of biases demonstrated that the individuals that participated were comparable, so DRECE cohort remained representative of Spanish population 13 years later (DRECE3).
In the DRECE1 study, 3.8% of the total population were undergoing lipid-lowering therapy (intention to treat), whereas in DRECE3 this proportion had increased to 10.7%, being concentrated in the group of individuals older than 40 years (13.7% and 10.2% in men and women, respectively) and especially in those older than 60 years of age (20.1% and 24.6% in men and women, respectively). Nevertheless, only 21.4% of the individuals undergoing lipid-lowering therapy in DRECE1 were undergoing lipid-lowering therapy in DRECE3. Among those who had not stopped lipid-lowering therapy, the lipid profile remained unchanged despite aging; however, in those who stopped lipid-lowering therapy, both total cholesterol and triglycerides had decreased significantly.
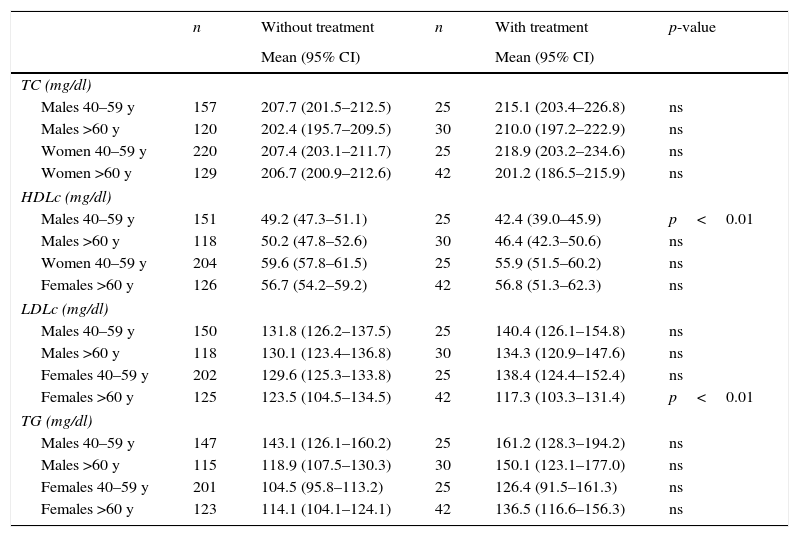
In DRECE3, in the entire group there were no significant differences in the lipid parameters between the subgroups with and without lipid-lowering therapy (Table 1). For this reason, the entire population was used for the above-mentioned comparisons.
Comparison of lipid profiles in individuals with lipid-lowering treatment and those without.
| n | Without treatment | n | With treatment | p-value | |
|---|---|---|---|---|---|
| Mean (95% CI) | Mean (95% CI) | ||||
| TC (mg/dl) | |||||
| Males 40–59 y | 157 | 207.7 (201.5–212.5) | 25 | 215.1 (203.4–226.8) | ns |
| Males >60 y | 120 | 202.4 (195.7–209.5) | 30 | 210.0 (197.2–222.9) | ns |
| Women 40–59 y | 220 | 207.4 (203.1–211.7) | 25 | 218.9 (203.2–234.6) | ns |
| Women >60 y | 129 | 206.7 (200.9–212.6) | 42 | 201.2 (186.5–215.9) | ns |
| HDLc (mg/dl) | |||||
| Males 40–59 y | 151 | 49.2 (47.3–51.1) | 25 | 42.4 (39.0–45.9) | p<0.01 |
| Males >60 y | 118 | 50.2 (47.8–52.6) | 30 | 46.4 (42.3–50.6) | ns |
| Women 40–59 y | 204 | 59.6 (57.8–61.5) | 25 | 55.9 (51.5–60.2) | ns |
| Females >60 y | 126 | 56.7 (54.2–59.2) | 42 | 56.8 (51.3–62.3) | ns |
| LDLc (mg/dl) | |||||
| Males 40–59 y | 150 | 131.8 (126.2–137.5) | 25 | 140.4 (126.1–154.8) | ns |
| Males >60 y | 118 | 130.1 (123.4–136.8) | 30 | 134.3 (120.9–147.6) | ns |
| Females 40–59 y | 202 | 129.6 (125.3–133.8) | 25 | 138.4 (124.4–152.4) | ns |
| Females >60 y | 125 | 123.5 (104.5–134.5) | 42 | 117.3 (103.3–131.4) | p<0.01 |
| TG (mg/dl) | |||||
| Males 40–59 y | 147 | 143.1 (126.1–160.2) | 25 | 161.2 (128.3–194.2) | ns |
| Males >60 y | 115 | 118.9 (107.5–130.3) | 30 | 150.1 (123.1–177.0) | ns |
| Females 40–59 y | 201 | 104.5 (95.8–113.2) | 25 | 126.4 (91.5–161.3) | ns |
| Females >60 y | 123 | 114.1 (104.1–124.1) | 42 | 136.5 (116.6–156.3) | ns |
Concentrations in mg/dl [mean (IC 95%)]. TC: total cholesterol; TG: triglycerides; y: years old.
When we compared the lipid profile of the population aged 20–60 years in DRECE1 with that of the same age group in DRECE3 to estimate the differences between individuals of the same sex and age group, we observed decreases in total cholesterol from a mean of 203.31mg/dl (sd 43.51) in 1992–1994 to 196.31mg/dl (sd 38.53) in 2005–2007 and in cLDL from a mean of 125.78mg/dl (sd 38.53) to 121.37mg/dl (sd 34.22)without significant changes in triglycerides or cHDL. The reduction in the proportion of individuals with total cholesterol greater than 200mg/dl decreased from 51.7% in DRECE1 to 47% in DRECE3 (p=0.0771).
These trends were no longer significant when the cohort was broken down into subgroups of individuals aged 20–39 and 40–59 years of age (Table 2). Nevertheless, with the exception of cHDL, the lipid parameters increased in magnitude with age until 60 years, after which they stabilized (data not shown in tables).
Total interindividual changes on the lipid profile in DRECE cohort (20–60 years).
| Drece 1 (1992–1994) | Drece 3 (2005–2007) | |
|---|---|---|
| Population 20–39 years | ||
| n | (834 men, 884 woman) | (141 men, 171 woman) |
| Total colesterol (mg/dl) | ||
| Men | 196.6 (193.6–199.6)* | 183.7 (178.1–189.3)** |
| Women | 183.4 (181.0–185.8)* | 184.4 (179.1–189.9) |
| Triglycerides (mg/dl) | ||
| Men | 139.3 (130.3–148.3)* | 129.6 (109.7–149.6)* |
| Women | 84.7 (81.8–87.6)* | 88.5 (82.2–94.7)* |
| LDL c (mg/dl) | ||
| Men | 121.5 (118.9–124.0)* | 112.0 (107.1–116.9)** |
| Women | 108.7 (106.6–110.8)* | 110.5 (106.1–114.8) |
| HDLc (mg/dl) | ||
| Men | 48.8 (47.8–49.6)* | 48.3 (46.1–50.8) |
| Women | 58.6 (57.8–59.5)* | 60.3 (58.1–62.4) |
| Population 40–59 years | ||
| n | (705 men, 768 women) | (167 men, 228 women) |
| Total colesterol (mg/dl) | ||
| Men | 216.2 (211.5–220.9) | 207.7 (201.5–212.5)** |
| Women | 218.2 (215.3–221.2) | 207.4 (203.1–211.7)** |
| Triglycerides (mg/dl) | ||
| Men | 158.1 (149.7–166.5)* | 143.1 (126.1–160.2)* |
| Women | 108.9 (104.4–113.3)* | 104.5 (95.8–113.2)* |
| LDL c (mg/dl) | ||
| Men | 139.5 (136.8–142.2) | 131.8 (126.2–137.5) |
| Women | 137.4 (134.7–140.1) | 129.6 (125.3–133.8) |
| HDLc (mg/dl) | ||
| Men | 49.5 (48.5–50.5)* | 49.2 (47.3–51.1)* |
| Women | 59.5 (58.5–60.5)* | 59.6 (57.8–61.5)* |
Mean values (95%CI).
The prevalence of hypoalphalipoproteinemia (cHDL<40mg/dl) in this age group (20–60 years) was 11.5% (18.6% in men and 5.7% in women) in DRECE1 and 14.5% (22.8% in men and 7.8% in women) in DRECE3, although these differences were not significant.
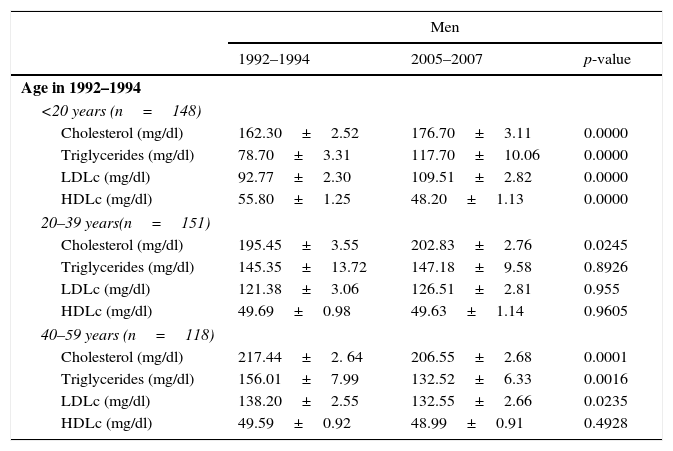
Table 3 shows the intraindividual variation in the lipid profile in the longitudinal study. Total cholesterol increased in men and women who were younger than 40 years old in DRECE1 but decreased in those who were older than 40 at that time. Similarly, with the exception of men aged 20–39 in DRECE1, cLDL increased in men and women who were younger than 40 years old in DRECE1 but decreased in those who were older than 40 at that time.
Intraindividual variation in lipid profile (mean±SD).
| Men | |||
|---|---|---|---|
| 1992–1994 | 2005–2007 | p-value | |
| Age in 1992–1994 | |||
| <20 years (n=148) | |||
| Cholesterol (mg/dl) | 162.30±2.52 | 176.70±3.11 | 0.0000 |
| Triglycerides (mg/dl) | 78.70±3.31 | 117.70±10.06 | 0.0000 |
| LDLc (mg/dl) | 92.77±2.30 | 109.51±2.82 | 0.0000 |
| HDLc (mg/dl) | 55.80±1.25 | 48.20±1.13 | 0.0000 |
| 20–39 years(n=151) | |||
| Cholesterol (mg/dl) | 195.45±3.55 | 202.83±2.76 | 0.0245 |
| Triglycerides (mg/dl) | 145.35±13.72 | 147.18±9.58 | 0.8926 |
| LDLc (mg/dl) | 121.38±3.06 | 126.51±2.81 | 0.955 |
| HDLc (mg/dl) | 49.69±0.98 | 49.63±1.14 | 0.9605 |
| 40–59 years (n=118) | |||
| Cholesterol (mg/dl) | 217.44±2. 64 | 206.55±2.68 | 0.0001 |
| Triglycerides (mg/dl) | 156.01±7.99 | 132.52±6.33 | 0.0016 |
| LDLc (mg/dl) | 138.20±2.55 | 132.55±2.66 | 0.0235 |
| HDLc (mg/dl) | 49.59±0.92 | 48.99±0.91 | 0.4928 |
| Women | |||
|---|---|---|---|
| 1992–1994 | 2005–2007 | p-value | |
| Age in 1992–1994 | |||
| <20 years (n=192) | |||
| Cholesterol (mg/dl) | 168.74±2.69 | 182.66±3.49 | 0.0000 |
| Triglycerides (mg/dl) | 79.93±2.67 | 93.92±4.28 | 0.0021 |
| LDLc (mg/dl) | 97.94±2.59 | 108.06±2.66 | 0.0002 |
| HDLc (mg/dl) | 57.57±1.05 | 60.61±1.21 | 0.0269 |
| 20–39 years (n=204) | |||
| Cholesterol (mg/dl) | 180.82±2.17 | 197.29±2.13 | 0.0000 |
| Triglycerides (mg/dl) | 86.67±2.17 | 91.11±3.53 | 0.2385 |
| LDLc (mg/dl) | 107.59±2.02 | 123.41±2.14 | 0.0000 |
| HDLc (mg/dl) | 58.84±0.92 | 59.27±1.06 | 0.6919 |
| 40–59 years (n=126) | |||
| Cholesterol (mg/dl) | 217.19±2.79 | 210.36±2.41 | 0.0281 |
| Triglycerides (mg/dl) | 112.55±4.49 | 122.26±4.44 | 0.0493 |
| LDLc (mg/dl) | 136.23±2.46 | 129.03±2.31 | 0.0137 |
| HDLc (mg/dl) | 59.19±0.84 | 58.10±0.95 | 0.2032 |
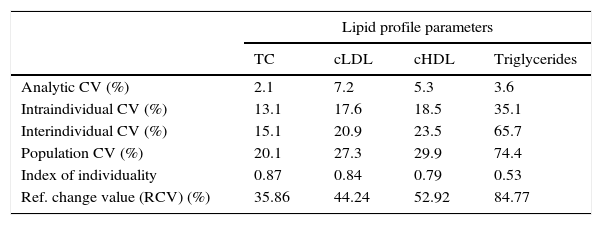
Table 4 shows the results of the variability study for the entire population, including RCV. The index of individuality values, with the exception of the value for cHDL for men <20 years old (I.I.=2.89) (data not shown), are only slightly over 0.5, which means that population reference values have limited use at individual level.
Variability in the lipid profile. Variation coefficients, index of individuality and reference change value (RCV) (for a 90% confidence interval).
| Lipid profile parameters | ||||
|---|---|---|---|---|
| TC | cLDL | cHDL | Triglycerides | |
| Analytic CV (%) | 2.1 | 7.2 | 5.3 | 3.6 |
| Intraindividual CV (%) | 13.1 | 17.6 | 18.5 | 35.1 |
| Interindividual CV (%) | 15.1 | 20.9 | 23.5 | 65.7 |
| Population CV (%) | 20.1 | 27.3 | 29.9 | 74.4 |
| Index of individuality | 0.87 | 0.84 | 0.79 | 0.53 |
| Ref. change value (RCV) (%) | 35.86 | 44.24 | 52.92 | 84.77 |
From 1992–1994 to 2005–2007, an increase in prevalence of lipid-lowering therapy has been shown, prevalence which increases as population ages. We have also found an overall decrease in 7mg/dl (3.44%) of total cholesterol and in 4.41mg/dl (3.51%) of cLDL.
Most data about age-related changes in the lipid profile come from cross-sectional studies or from studies of trends in independent population samples.
Observational longitudinal cohort studies are useful for identifying changes in biological and lifestyle parameters associated with cardiovascular risk. Nevertheless, few studies have focused on long-term follow-up of biological parameters related to lipid metabolism and their relationship with age.3
Data from cross-sectional studies allow us to suspect that cholesterol levels have decreased slightly in the population since the end of the 1950s and that these decreases have helped prevent cardiovascular disease.21–23 Although the relation of both lipid profiles and cardiovascular disease with age makes it difficult to interpret the results of population-based studies, strong evidence from both intensive interventional studies and lifestyle studies suggests that the gradual improvement in the population's lipid profile has improved the overall cardiovascular prognosis.21–23 We found an overall improvement of lipid profile, and that the proportion of individuals with total cholesterol >200mg/dl in the population aged 20–60 years, decreased from 51% to 47% between DRECE1 and DRECE3, although the later was not significant (p=0.07). These results are difficult to compare with those of the DARIO study,24 which pooled the results of 11 studies conducted in different regions of Spain between 2000 and 2010 and reported a 41% prevalence of cholesterol >250mg/dl, and the differences are likely related differences in the analytical methods used.
Despite the relatively low cardiovascular risk in the Spanish population, in DRECE3 nearly 10% were undergoing lipid-lowering therapy; however, we did not record the continuity of treatment or adherence to therapy: some individuals likely follow continuous treatment whereas others likely follow intermittent treatment. In fact, when we compared the lipid profiles of individuals in treatment versus those not in treatment, we detected only small differences and only in some age/sex groups. These results differ from those obtained in France, where the lipid profile of the untreated population is similar but a slightly higher proportion of the population (12%) is treated with lipid-lowering drugs.25
When we compared the lipid profile of the DRECE1 cohort (overall and broken down by sex) with that of the DRECE3 cohort, we observed significant differences not only in total cholesterol, but also in the other components. Concentrations of cLDL and triglycerides were higher in men, but cHDL concentrations were similar in both sexes. These cross-sectional data for DRECE3 are in line with those obtained in the ENRICA26 and Framingham27 studies, but differ slightly from those obtained done in one region of Spain (Albacete),28 in which cHDL concentrations were lower. These differences might be explained by the regional differences observed in DRECE (data not shown) or by differences in the methods of measuring cHDL: some direct methods differ more than 10% compared with precipitation methods or other direct methods29; cLDL concentrations calculated with the Friedewald formula can also differ from those calculated with other methods.30
DRECE3 assessed the diet, risk factors, and lipid profile 14 years after DRECE1, enabling us to observe changes caused not only by aging but also by changes in lifestyle. One important finding was that sex-related differences in total cholesterol and cLDL decreased in middle age and were no longer significant. Subgroup analyses lead us to conclude that intraindividual changes identified in the longitudinal study are smaller than changes in the entire population detected in the cross-sectional study. Intraindividual changes follow an age-related pattern toward slightly lower lipid concentrations, reflecting a positive change in the cardiovascular risk profile, mainly due to healthier lifestyles.
The cross-sectional comparison between DRECE1 and DRECE3 showed a general decline in lipid concentrations in both men and women, regardless of age. Differences in total cholesterol were statistically significant in men aged 20–39 years and in both men and women aged 40–59 years. Differences in cLDL were statistically significant only in men aged 20–39 years. The population decreased cardiovascular risk by adopting healthier cardiovascular diets and lifestyles. This decrease is most evident in the group of men aged 20–39 years, although women's lipid profile remained unchanged despite aging; lifestyle changes probably counterbalanced the effect of aging.
When we analyzed intraindividual variation (longitudinal comparison), we found an increase in total cholesterol and cLDL in the subgroups of men and women aged <20 years in DRECE1; however, whereas cHDL decreased in the men, it increased in the women. In the subgroups of men and women aged 20–39 years old in DRECE1, total cholesterol levels increased in both, cLDL increased only in women, and cHDL remained unchanged in men and women. These differences may be related to greater changes in lifestyle among men in this age group. In the subgroups of men and women aged >40 years in 1991, all lipid parameters decreased significantly except cHDL, which did not change. In women, there is a trend toward increasing values for all lipid parameters with increasing age group.
In the cross-sectional study, all lipid parameters increased from DRECE1 to DRECE3 except in the group of individuals aged >40 years, in which all lipid parameters except cHDL decreased. The values obtained in DRECE3 are very similar to those reported in the Monica SPA-CAT study,4 slightly below (3mg/dl) those reported in the 1988–1994 National Health and Nutrition Examination Survey (NAHNES), but indistinguishable from those of the 2007–2010 NAHNES.31,32
Our results also reveal a cohort effect, indicating that each generation undergoes gradual lifestyle changes that affect cardiovascular health. Analyzing the trends in the alimentary habits of the Spanish population by tracking the DRECE cohort over 20 years,33–35 we can see that dietary habits have changed little between 1992 and 2007: the nutrient composition of the diet has remained largely unchanged and only slight changes in the consumption of certain food groups are evident.35 The consumption of carbohydrates is 50%, below the level recommended by the Spanish Atherosclerosis Society (SEA), whereas total fat and protein consumption are 35% and 15%, higher than recommended, respectively. Thus, it seems the Spanish diet is drifting away from the traditional Mediterranean diet, which has a protective effect against cardiovascular disease. These changes are more evident in younger age groups.
With regards to evolution of diet across the DRECE studies, as the population becomes older, individuals tend to adopt habits that promote cardiovascular health. In the group of individuals aged 50–74, consumption of vegetables, fruit, cereals, and fish increases and the consumption of meat and eggs decreases. However, the DRECE3 cohort also had a higher consumption of dairy products and a lower consumption of legumes. Oil and fat consumption decreased from 51.3g/bw/d in DRECE1 to 44.1g/bw/d in DRECE3; olive oil accounted for most fat consumption and was the only fat consumed by 70% of individuals.36 These qualitative changes probably contribute to the favorable trends in total cholesterol and cLDL, although decreased consumption of trans fatty acids or other lifestyle changes might also play a role, as reported in the population of the USA.36
Between DRECE1 and DRECE3, the proportion of overweight individuals remained unchanged (38.1% in DRECE1 vs. 37.3% in DRECE3), although sedentary lifestyles became more common and the prevalence of obesity increased from 17.8% to 21.2%.36 These data are very similar to those reported in the 2008–2010 ENRICA study, a cross-sectional study in Spain with more than 12000 participants with similar range of ages.26 This increase is particularly remarkable in younger age groups (<20 and 20–39 years old), where obesity rates have increased by 2-fold and 1.5-fold, respectively; these effects are likely to be dragged into older age groups over time.37
So, changes in lipid profile seem to be multifactorial. The trend to divert from the traditional Mediterranean diet, and sedentary lifestyles can play a key role in the rise of total cholesterol and cLDL seen in the youngers, both men and women. While the trend to adopt healthier lifestyles and the more intensive lipid-lowering therapy can play a role in the improvement of lipid profile, specially observed in people older than 40 years.
If Spanish population is to endure as a low cardiovascular risk one, a multifactorial approach is needed, which should focus on: to affirm traditional Mediterranean diet, specially in the younger; promote healthy lifestyles; and lipid-lower therapy when clinically indicated.
We found relatively high individuality for total cholesterol (I.I.=0.87), cLDL (I.I.=0.84), and triglycerides (I.I.=0.53), that means that the biological variability of this lipids is wider between subjects than within subjects. As originally demonstrated by Harris,19,20 low individuality (index of individuality higher than 1.4) allows use of population reference values, while in presence of high individuality (index of individuality lower than 0.6) population reference values are not useful to evaluate patient health, as relatively large changes in lipid parameters within an individual may go unnoticed falling between reference limits. Our findings support the preferential use of RCVs rather than reference intervals in most sex/age groups in our population when several consecutive results for one subject are available (serial testing), although our RCVs are higher than in other studies, probably owing to the large interval between the two measurements (mean 14 years).
In conclusion, the Spanish population's lipid profile is determined by age and lifestyle, most likely due to dietary habits. Lipid concentrations, especially total cholesterol and cLDL, have increased within individuals, although the trend is more favorable in the middle age groups (40–59 years). Interindividual analysis also shows increasing concentrations with age in both men and women as well as a trend toward lower levels over time. Furthermore, low scores on the index of individuality (<1.4) recommend using the corresponding RCV instead of population reference values.
In summary, between 1992–1994 and 2005–2007, there was trend toward better serum lipid levels in the Spanish population. Further work is needed to simultaneously assess the effects of diet and healthy lifestyle factors on total cholesterol, cHDL, cLDL, and triglycerides
Ethical disclosuresProtection of human and animal subjectsThe authors declare that no experiments were performed on humans or animals for this investigation.
Confidentiality of dataThe authors declare that no patient data appears in this article.
Right to privacy and informed consentThe authors declare that no patient data appears in this article.
Conflict of interestsThe authors declare that they have no conflict of interest.
Financed in part by Carlos III Research Institute and the European Regional Development Fund (ERDF). A way of making Europe. Cofinanciado por ISCIII, FEDER.