


Macular oedema is a form of diabetic retinopathy that can be treated with photocoagulation. The expected effect of treatment varies, and may depend on the previous characteristics of retinal thickening.
ObjectiveTo determine whether the change in retinal thickness after focal photocoagulation for diabetic macular oedema varies due to the presence of anatomical features that may justify a separate assessment.
Material and methodsNon-experimental, comparative, retrospective, longitudinal study. The mean percentage change in macular volume was compared in eyes with diabetic macular oedema, 3 weeks after focal photocoagulation. The analysis was stratified according to the presence of central and perifoveal temporal thickening (Mann–Whitney U). A regression analysis was performed to identify the contribution of the anatomical variables before photocoagulation to the change in macular volume.
ResultsA total of 72 eyes were evaluated. The mean change of macular volume in the sample was −0.68±3.84%. In the multiple regression analysis, the changes of perifoveal temporal (beta 0.54, p<0.001) and central field thickness (beta 0.3, p=0.01) contributed to the change of macular volume (R=0.64). Macular volume decreased by a mean of −2.1±4.3% in eyes with temporal perifoveal thickening, and increased by 0.5±2.8% (p =0.007) in eyes with no thickening.
ConclusionPerifoveal temporal thickening before photocoagulation changes the expected effect of this therapy on macular volume in eyes with focal diabetic macular oedema. It is recommended to evaluate the effect separately, and according to the perifoveal temporal thickness.
El edema macular es una forma de retinopatía diabética que puede tratarse con fotocoagulación. El efecto esperado del tratamiento varía, y podría depender de las características previas del engrosamiento retiniano.
ObjetivoDeterminar si la modificación del grosor retiniano después de la fotocoagulación focal en edema macular diabético varía por la presencia de características anatómicas que justifiquen una evaluación por separado.
Material y métodosEstudio observacional, comparativo, retrospectivo y longitudinal. Se comparó el promedio de cambio porcentual de volumen macular, 3 semanas después de la fotocoagulación focal en ojos con edema macular diabético; el análisis se estratificó conforme a la presencia de engrosamiento central y temporal perifoveal (U de Mann-Whitney). Se realizó un análisis de regresión para identificar la contribución de las variables anatómicas al cambio de volumen macular.
ResultadosSe evaluaron 72 ojos. El cambio del volumen macular en la muestra fue −0.68±3.84%. En la regresión múltiple, los cambios del grosor temporal perifoveal (ß 0.54; p<0.001) y del grosor del campo central (ß 0.3; p=0.01) contribuyeron al cambio del volumen macular (R=0.64). El volumen macular disminuyó en promedio −2.1±4.3% en ojos con engrosamiento temporal perifoveal y aumentó 0.5±2.8% (p=0.007) en ojos sin él.
ConclusiónEl engrosamiento temporal perifoveal previo a la fotocoagulación modificó significativamente el efecto esperado de este tratamiento sobre el volumen macular, en ojos con edema macular diabético focal. Se recomienda evaluar el efecto por separado, de acuerdo con el grosor temporal perifoveal.
Diabetic retinopathy is one of the main causes of blindness in people of the productive age group in developing countries. One of its complications is macular oedema,1 which is a thickening of the retina in the macula caused by mechanisms including: thickening of the baseline capillary membrane, loss of pericytes, formation of microaneurisms and the resulting accumulation of intra-retinal fluid.2
Optical coherence tomography is a non-invasive imaging technique which uses low coherence interferometry3 to provide high-resolution cross-sectional images of the microstructure of the retina.4 Optical coherence tomography is used extensively for the follow-up of posterior segment diseases,5 including identification and monitoring of diabetic macular oedema, as it is able to quantitatively and reproducibly measures the thickness of the retina.6
Treatment for diabetic macular oedema with focal angiographic filtration is focal photocoagulation, which has proven to be effective in reducing the risk of moderate visual loss from 8% to 5% after one year, and from 24% to 12% three years after the procedure.7
Although optical coherence tomography quantifies the magnitude of changes after photocoagulation in our sample the anatomical response was not characterised after this treatment. In the North American population, Krzystolik et al.8 identified that changes over 17% in the thickness of the central point, of 11% in the central field and of 3% in macular volume were more likely to represent a real change than variability of measurement.
The reference values of retina thickness in our sample are lower9 than those used by Krzystolik et al.8 To detect atypical responses in patients with macular oedema in our study it was required that the expected anatomical changes were identified after focal photocoagulation.
Even in those studies which have their own sample reference, response to photocoagulation fluctuates. This could be due to the characteristics of the thickening prior to treatment. These characteristics have not been assessed and up until now it has only been determined that macular volume is the most solid variable, since it depends less on the operator.10 One variable which requires assessing is the perifoveal temporal thickening, since the eyes which present with it have a higher macular volume prior to the treatment,11 and greater reduction of macular volume after it.12
A study was conducted to determine the expected effect of focal photocoagulation on the macular volume, 3 weeks after the procedure in patients with diabetic macular oedema and to determine whether the change in several anatomic variables prior to treatment significantly modified this effect.
Material and methodsAn observational, comparative, retrospective and longitudinal study was conducted. The target population were type 2 diabetic patients with diabetic retinopathy and clinically significant macular oedema, treated with focal photocoagulation, from the federal district and its metropolitan area. The accessible sample were patients treated by the Ophthalmology Service of the general hospital, between 26th March 2008 and 5th November 2013. The study was authorised by the research and ethics in research commissions of the hospital where the study took place.
The eyes of diabetic type 2 patients of any gender and age were included in the study, with any grade of diabetic retinopathy, diagnosed with clinically significant macular oedema, focal angiographic filtration, spongiform retinal thickening, which had been treated with focal photocoagulation and which had been recorded as having had a better corrected visual acuity and a fast macular mapping of optical coherence tomography (Equipo Stratus, Carl Zeiss Meditec, Inc., Dublin, California, U.S.A. software version 4.01), on the day of photocoagulation and 3 weeks afterwards.
The following patients were excluded from the sample: those with any other disease which reduced their vision, or where there was posterior thickening of vitreous humour, those who had received previous macular treatment and who had developed any other retinal disease between the day of photocoagulation and the follow-up consultancy after 3 weeks.
For every patient age, gender, time of evolution and treatment of diabetes was recorded. Tests were carried out to see if they suffered from systemic arterial hypertension, fasting blood sugar, glycated haemoglobin, total serum cholesterol, and serum triglycerides. The visual acuity best corrected under refraction measured in decimal equivalent, as well as the thickness of the central point, the central field, the perifoveal temporal thickening and the macular volume were recorded (measured using fast macular thickness mapping), on the day of treatment and 3 weeks after this. Standard deviation of the thickness of the central point of over 10% was considered to be a measurement error of the fast macular mapping.
The outcome variable was the percentage change of macular volume. To calculate this we divided the difference between the value relating to 3 weeks after treatment and the value of the day of the procedure, and the value of the day of the procedure and multiplied by 100. This was a continuous quantitative variable measured as a percentage.
The following predictors were considered as variables: reduced visual acuity (<0.5),13 thickened central point (thickness of the central point >187.4μm), thickening of the central field (thickness of the central field >212.5μm) perifoveal temporal thickening (thickness of field 7 of the rapid macular mapping >259.4μm),9 before treatment. Secondary variables considered the percentage change averages of visual acuity, of the central field thickness, the central point thickness and the perifoveal temporal thickening.
The sample was stratified in accordance with each one of the predictor variables. In each stratum the average of the percentage change of the macular volume was compared to the secondary variables using the Mann–Whitney U test. In addition to this the contribution of the secondary variables to the percentage change in macular volume was identified using linear regression analysis. The information was stored and analysed with version 21 of the SPSS programme for Windows. P<0.05 was considered to be statistically significant.
Results72 eyes of 47 patients were assessed, with an average age of 57.9 years (standard deviation [SD]±8.9); 37 eyes were female (51.4%), duration of diabetes was on average 15.2 (SD±6.2) years. Twenty six eyes belonged to patients who received insulin (36.1%) and the other patients were treated with oral hypoglycaemic agents; 38 eyes belonged to patients with hypertension (52.8%).
The average fasting blood sugar level was 138.3±41.1mg/dl, glycated haemoglobin 8.4±1.7%, total cholesterol 225.3±70.6mg/dl and triglycerides 220.0±142.8mg/dl. The degree of diabetic retinopathy was mild non proliferative in 13 eyes (18.1%), moderate non proliferative in 35 (48.6%), severe non proliferative in 4 (5.6%), and proliferative in 20 (27.8%); oedema was monofocal in 52 eyes (72.2%).
Visual acuity prior to treatment was 0.03 to 1.00 (average 0.57, SD±0.29), thickness of central point from 107 to 349μm (185.1±43.4), thickness of central field from 146 to 357μm (214.2±37.5), perifoveal temporal thickening from 213 to 485μm (267.6±46.3) and macular volume from 6.24 to 11.17mm3 (7.79±0.85).
Three weeks after treatment, the level of visual acuity was between 0.01 and 1 (0.58±0.3), thickness of central point between 119 and 489μm (188.5±53.1), thickness of central field between 153 and 445μm (216.7±41.0), perifoveal temporal thickening between 211 and 360μm (259.2±0.2) and macular volume between 6.39 and 10.48mm3 (7.72±0.75).
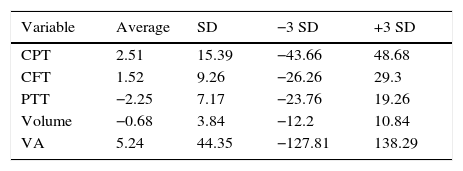
The averages of percentage change of the variables is shown in Table 1.
Averages of percentage change in the sample (n=72).
| Variable | Average | SD | −3 SD | +3 SD |
|---|---|---|---|---|
| CPT | 2.51 | 15.39 | −43.66 | 48.68 |
| CFT | 1.52 | 9.26 | −26.26 | 29.3 |
| PTT | −2.25 | 7.17 | −23.76 | 19.26 |
| Volume | −0.68 | 3.84 | −12.2 | 10.84 |
| VA | 5.24 | 44.35 | −127.81 | 138.29 |
VA: visual acuity; CFT: Central field thickness; CPT: central point thickness; PTT: perifoveal temporal thickening.
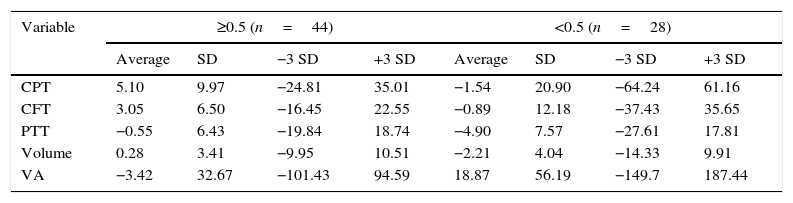
Visual acuity was <0.5 in 28 eyes (38.9%) and ≥ 0.5 in 44 (61.1%). The eyes with visual acuity <0.5 had higher change averages in visual acuity (18.87 vs. −3.42%; P=0.03), perifoveal temporal thickening (−4.90 vs. −0.55%; P=0.01) and macular volume (−2.21 vs. 0.28%; P=0.01, Table 2). The remaining variables showed no differences.
Averages of percentage change, stratified by initial visual acuity.
| Variable | ≥0.5 (n=44) | <0.5 (n=28) | ||||||
|---|---|---|---|---|---|---|---|---|
| Average | SD | −3 SD | +3 SD | Average | SD | −3 SD | +3 SD | |
| CPT | 5.10 | 9.97 | −24.81 | 35.01 | −1.54 | 20.90 | −64.24 | 61.16 |
| CFT | 3.05 | 6.50 | −16.45 | 22.55 | −0.89 | 12.18 | −37.43 | 35.65 |
| PTT | −0.55 | 6.43 | −19.84 | 18.74 | −4.90 | 7.57 | −27.61 | 17.81 |
| Volume | 0.28 | 3.41 | −9.95 | 10.51 | −2.21 | 4.04 | −14.33 | 9.91 |
| VA | −3.42 | 32.67 | −101.43 | 94.59 | 18.87 | 56.19 | −149.7 | 187.44 |
VA: visual acuity; CFT: Central field thickness; CPT: central point thickness; PTT: perifoveal temporal thickening.
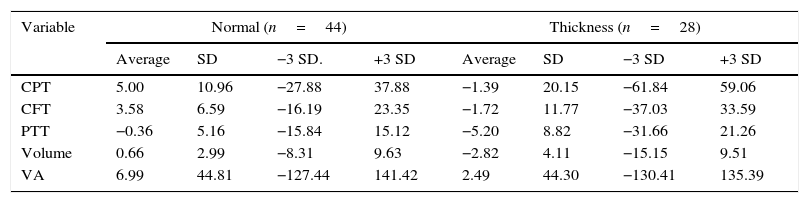
The central point had thickened in 28 eyes (38.9%) and not in 44 (61.1%). The central point thickness and macular volume averages rose in the eyes with a thickened central point, and fell in the eyes without it (P=0.01 and 0.001 respectively); the average reduction of the perifoveal temporal thickening was greater in the eyes with a thickened central point (−5.2 vs. −0.36; P=0.02) (Table 3).
Averages of percentage change, stratified by initial central point thickness.
| Variable | Normal (n=44) | Thickness (n=28) | ||||||
|---|---|---|---|---|---|---|---|---|
| Average | SD | −3 SD. | +3 SD | Average | SD | −3 SD | +3 SD | |
| CPT | 5.00 | 10.96 | −27.88 | 37.88 | −1.39 | 20.15 | −61.84 | 59.06 |
| CFT | 3.58 | 6.59 | −16.19 | 23.35 | −1.72 | 11.77 | −37.03 | 33.59 |
| PTT | −0.36 | 5.16 | −15.84 | 15.12 | −5.20 | 8.82 | −31.66 | 21.26 |
| Volume | 0.66 | 2.99 | −8.31 | 9.63 | −2.82 | 4.11 | −15.15 | 9.51 |
| VA | 6.99 | 44.81 | −127.44 | 141.42 | 2.49 | 44.30 | −130.41 | 135.39 |
VA: visual acuity; CFT: Central field thickness; CPT: central point thickness; PTT: perifoveal temporal thickening.
Twenty eight eyes presented with thickening of the central field (38.9%) and 44 did not (61.1%). The average reduction of the perifoveal temporal thickening was greater in eyes with a thickening of the central field (−5.3±8.9% vs. −0.3±5.0%; P=0.004); the macular volume fell in the eyes with thickening of the central field (−2.3±4.5%), and increased in the eyes without it (0.4±2.9%; P=0.008).
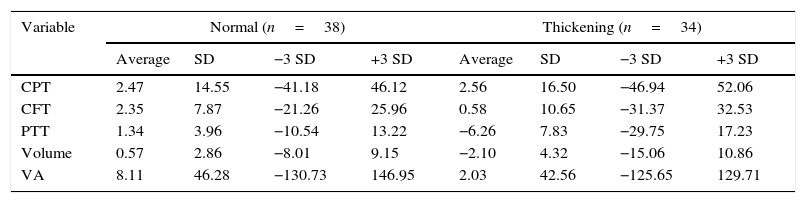
Temporal perifoveal thicknessA total of 34 eyes presented with perifoveal temporal thickening (47.2%) and 38 did not (52.8%). The eyes with con perifoveal temporal thickening had higher averages of change in perofoveal temporal thickening (−6.26 vs. 1.34%; P<0.001) and macular volume (−2.10 vs. 0.57%; P=0.007) (Table 4).
Averages of percentage change, stratified by perifoveal temporal sector thickness.
| Variable | Normal (n=38) | Thickening (n=34) | ||||||
|---|---|---|---|---|---|---|---|---|
| Average | SD | −3 SD | +3 SD | Average | SD | −3 SD | +3 SD | |
| CPT | 2.47 | 14.55 | −41.18 | 46.12 | 2.56 | 16.50 | −46.94 | 52.06 |
| CFT | 2.35 | 7.87 | −21.26 | 25.96 | 0.58 | 10.65 | −31.37 | 32.53 |
| PTT | 1.34 | 3.96 | −10.54 | 13.22 | −6.26 | 7.83 | −29.75 | 17.23 |
| Volume | 0.57 | 2.86 | −8.01 | 9.15 | −2.10 | 4.32 | −15.06 | 10.86 |
| VA | 8.11 | 46.28 | −130.73 | 146.95 | 2.03 | 42.56 | −125.65 | 129.71 |
VA: visual acuity; CFT: Central field thickness; CPT: central point thickness; PTT: perifoveal temporal thickening.
In the multiple regression analysis the variables which contributed to the percentage changes of the macular volume (R=0.64) were the percentage change in the perifoveal temporal thickening (ß 0.54; P<0.001) and the percentage change of the thickness of the central field (ß 0.3; P=0.01). Stratification consistent with the perifoveal temporal thickening identified the most significant difference of volume, and was therefore considered for the regression analysis.
In patients with perifoveal temporal thickening the variables which contributed to the percentage changes of the macular volume (R=0.60) were the percentage change of the perifoveal temporal thickening (ß 0.44; P=0.009) and the percentage changes of the thickness of the central field (ß 0.32; P=0.04). In patients without perifoveal temporal thickening the variables which contributed to the percentage modification of the macular volume (R=0.49) were also the percentage change of the perifoveal temporal thickening (ß 0.55; P<0.001) and the percentage changes of the thickness of the central field (ß 0.42; P=0.003).
The expected effect of focal photocoagulation on macular volume in eyes with no perifoveal temporal thickening was an increase of 0.57%, whilst in that of eyes with perifoveal temporal thickening it was a reduction of −2.11% (P=0.003). The range of percentage change of the macular volume was −8.01 to 9.1% in eyes without perifoveal temporal thickening and of −15 to 10.8% in eyes with it (Fig. 1).
Discussion
The expected effect of the percentage changes for anatomical variables was highly disperse because elements from difference types of people overlapped in the sample. The variables which changed the expected effect when they were found to have changed prior to treatment were perifoveal temporal thickening and thickening of the central field.
The average percentage change of macular volume was almost 6 times lower in eyes with thickening of the central field than in eyes without it. Furthermore, this corresponded to a reduction in eyes with this thickening and an increase in eyes without it. The same pattern was identified in eyes with perifoveal temporal thickening where the average percentage change of macular volume was 4 times higher than in eyes without it.
When there was thickening in either of the 2 fields (central or temporal perifoveal) the average of the percentage change in macular volume was statistically lower than that of the eyes which did not present it. Regression analysis showed that both variables significantly contributed to the percentage change of the macular volume, primarily the change in perifoveal temporal thickening. Even when stratification by other variables also modified the expected effect of photocoagulation over volume, regression analysis showed that these changes were mainly linked to the perifoveal temporal thickening.
Regarding the standard published by Krzystolik et al.8 it was noted that only 15.3% of the sample had a change >17% in central point thickness after treatment and only 11.1% had a central field change >11%. With regards to macular volume, there was a reduction above 3% in 27.8% of the eyes and an increase above 3% in 15.3%.
Macular volume is the most solid variable among those measured by fast macular mapping; it does not depend on the operator,10 and was therefore selected to carry out the regression analysis. The results of the study indicate that the expected effect of focal photocoagulation should be separately assessed, in patients and with and without thickening of the perifoveal temporal sector.
It was not expected that the change in the perifoveal temporal thickening would contribute more to the change in macular volume than the change in the thickness of the central field, to which a prognostic value was assigned in longitudinal studies.14 It is notable that this greater contribution will also present in the eyes without perifoveal temporal thickening prior to treatment.
Holm et al.15 put forward that the perifoveal temporal sector had greater electric activity than the nasal sector. These characteristics could explain the better response to the photocoagulation in eyes without thickening in this area, but up until that time it is unknown why the reduction in the thickness in this field contributes to that of the macular volume.
In a study on diffuse macular oedema treated with grid laser photocoagulation, Vemala et al.16 identified that response was better when treatment was applied in the lower sector, and was worse when it was applied in the upper and nasal parafoveal sectors and the perifoveal temporal sector. This study showed that the best anatomical response to photocoagulation could be due to not having treated the papillary-macular beam, to different regional characteristics of the haematorretinian barrier or to variations in microcirculation. The first explanation could justify a poorer result in the eyes with nasal compromise, but not in the eyes with perifoveal temporal thickening which does not form part of the papillary- macular beam.
Sander et al.17 described that, in diffuse oedema, hydrostatic pressure, osmotic pressure and the aquaporins affect retinal thickness and with the additional tissue damage could be the explanation for the lack of regularisation of retinal thickness following treatment. These conditions do not present in focal oedema, where when the flow is interrupted, the interstitial fluid is removed through the competent capillary vessels and pigment epithelium pumping.18 These 2 mechanisms should be assessed specifically to identify why the change of perifoveal temporal thickening significantly contributes to the change in macular volume.
The findings from this study could not be applied in eyes with diffuse, cystoids or ischaemic oedema. The study was not designed to determine the impact of the reduction in volume regarding visual function, which requires additional assessment.
Due to the modification of the expected effect associated with perifoveal temporal thickening, it was recommended that separate evaluation be made of response to photocoagulation in eyes with and without these characteristics, to reduce the changeability of the outcome.
ConclusionPerifoveal temporal thickening prior to photocoagulation significantly modified the expected effect of this treatment on macular volume, in eyes with focal diabetic macular oedema.
Ethical disclosuresProtection of human and animal subjectsThe authors declare that no experiments were performed on humans or animals for this study.
Confidentiality of dataThe authors declare that they have followed the protocols of their work center on the publication of patient data.
Right to privacy and informed consentThe authors declare that no patient data appear in this article.
Conflict of interestsThe authors have no conflict of interests to declare.
Please cite this article as: Garcia-Rubio YZ, Razo Blanco-Hernández DM, Lima-Gómez V. Efecto esperado del grosor retiniano después de fotocoagulación focal en edema macular diabético. Cir Cir. 2016;84:356–362.