


This paper explores the relationship between productivity and sourcing strategies using a sample of Spanish manufacturing firms. In this analysis we use different measures of productivity and alternative ways of grouping firms. Our results indicate that productivity differs systematically across groups of firms with different sourcing strategies. The ranking of productivities we observe is not fully consistent with the predictions of Antràs and Helpman's (2004) model but we confirm many partial aspects of the proposed ranking. In our preferred specifications, the productivity advantage is highest for firms that import inputs from foreign subsidiaries. Moreover, the group of firms that outsource in the domestic market is, in general, at the bottom of the productivity distribution, with firms that outsource abroad having an intermediate productivity advantage. When analysing the direction of causality between productivity and sourcing strategies, we find weak evidence of self-selection of firms into offshoring and no influence of relocation on firm productivity.
Foreign sourcing has grown in prominence in recent decades as a major international firm activity. Underlying this phenomenon is the growing fragmentation of production processes across firms and countries, which has led to steadily increasing shares of intermediate inputs in total trade.
The choices faced by a firm which needs an intermediate input can be represented by four different sourcing options. First, the firm can decide to keep the process within its boundaries or to contract it externally to a non-related party. Second, the firm can decide to locate the process either in the domestic market or abroad. The combination of these choices yields four options. The intermediate input can be subcontracted at home (domestic outsourcing), subcontracted to an external supplier abroad (foreign outsourcing), integrated within the boundaries of the firm at home (domestic integration) and integrated abroad (foreign integration). This classification has been proposed by Feenstra (2010) and Helpman (2011), among many others, and extensively used to describe the sourcing strategies of firms at home and abroad.
Several theoretical models have been suggested to investigate the organizational choices of firms. An approach based on the theory of property rights to the firm with incomplete contracts has been proposed by Grossman and Helpman (2002), Antràs (2003) and Antràs and Helpman (2004) (see a recent review of this literature by Antràs, 2014). In this setting, companies make two endogenous organizational choices, an integration decision and a location decision, and the model shows how a firm's decisions to integrate or to outsource are a consequence of the level of firm technology. The prevalence of one way over the other to organize the production (integrate vs. outsource; outsource in the domestic market vs. outsource abroad) depends on the distribution of productivity across firms within an industry. A second approach, proposed by Grossman and Helpman (2004), who model input sourcing in a principal-agent framework, suggests a different relationship between organizational mode and productivity at the firm level.
There is an empirical literature using firm-level data that have explored the relationship between input sourcing and productivity. Our paper is related to this literature. Tomiura (2007) analyses the choices between foreign outsourcing and FDI for Japanese manufacturing firms. Choices of organizational form follow a productivity ordering which is consistent with Antràs and Helpman (2004). Most productive firms engage in FDI and less productive firms choose foreign outsourcing. Federico (2010) estimates sourcing premia for Italian manufacturing firms. There is a productivity ordering by which firms integrating abroad are the most productive ones, and domestic outsourcing firms are the least productive ones. However, in contrast to the assumptions of Antràs and Helpman's (2004) model, foreign outsourcing firms are less productive than firms that integrate at home. Kohler and Smolka (2011) estimate the productivity premia for every organizational form relative to domestic outsourcing for a sample of Spanish manufacturing firms. The productivity advantage is highest for firms that import inputs from foreign subsidiaries and lowest for firms outsourcing at home. The productivity difference between firms that integrate at home and firms performing outsourcing abroad are not statistically significant. Defever and Toubal (2013) examine French multinationals. They find that the least productive firms are multinationals that produce their intermediate inputs in foreign subsidiaries while the most productive outsource abroad.
This paper explores the relationship between a firm's sourcing decisions and productivity. This issue is addressed empirically using a sample of Spanish manufacturing firms. Our dataset provides detailed firm-level information based on a survey where firms report how they acquire intermediate inputs in each of the four theoretical modes. A second characteristic of the dataset is that the information the firm provides refers to intermediate inputs that are acquired within a bilateral relationship that implies specific investments in such a way that the goods and services produced are tailored to the needs of the firm. Therefore, our measure of sourcing does not refer to a simple purchase of intermediate inputs consisting of raw materials and standardized goods. It rather refers to inputs that are produced within a “subcontracting” relationship. The third characteristic of the dataset used is that it is an unbalanced panel of firms from 1990 to 2005. This structure allows us to observe the transition firms make between different sourcing strategies. For example, we are able to observe cohorts of firms establishing a stable relationship with a foreign supplier (offshoring) for the first time.
The paper contributes to the literature, first, by providing a number of stylized facts related to the heterogeneity of sourcing decisions by Spanish manufacturing firms. Second, we estimate productivity premia for groups of firms with different sourcing strategies. The estimation of productivity premia permits us to check whether they conform to the sorting of productivities predicted by models of global sourcing. We pay particular attention to the predictions of Grossman and Helpman (2004) and Antràs and Helpman (2004). Third, the pattern of correlation between firm productivity and sourcing decisions does not imply any kind of causality running from sourcing to the productivity level of the firm. However, the panel-structure of our dataset permits us to perform some basic descriptive regressions that can be interpreted in terms of alternative hypotheses concerning the direction of causality between sourcing strategies and firm productivity. In particular, we test for the selection hypothesis (i.e., whether firms self-select into their sourcing strategy as the theoretical models suggests) and for the relocation hypothesis (i.e., firms’ decisions to relocate some stages of their production process to external suppliers result in a positive impact on the productivity level of these firms).
The paper is organized as follows. Section ‘Theoretical framework and related literature’ provides a review of the main characteristics of the theoretical literature of global sourcing. Section ‘Data and descriptive evidence’ describes the characteristics of the data set used in the analysis and presents some basic descriptive evidence on the magnitude and evolution of sourcing. Section ‘Sourcing strategies and the pattern of firm productivities’ introduces the empirical approach, presents the sorting of productivities across groups of firms with different patterns in their sourcing activity and offers some robustness checks of the main results. Section ‘Offshoring and firm productivity: selection vs. relocation’ takes firms with different transition patterns in their sourcing strategies as a reference to test for two alternative hypotheses of the superior performance of offshoring (foreign integration and/or foreign outsourcing). Finally, Section ‘Conclusions’ summarizes the main conclusions.
Theoretical framework and related literatureTo organize our empirical work, this section briefly summarizes the predictions of theories on the choice between integration and outsourcing.
Most models of global sourcing assume the existence of two forms of organizational choice: vertical integration, or the provision of inputs within the boundaries of the firm, and outsourcing or provision through an independent supplier. There is a basic trade-off between integration and outsourcing. Integration has the advantage of a greater control over the supply of inputs, but might have negative consequences by weakening the incentive to work hard in producing high-quality inputs. Therefore, when the costs of internalization are significant, outsourcing may be a better strategy for the final goods producer. The theoretical literature suggests that this choice between vertical integration and outsourcing is influenced by the level of firm productivity.
We first refer to two papers, Antràs (2003) and Antràs and Helpman (2004), which are based on the property right approach with incomplete contracts developed by Grossman and Hart (1986). Both focus on a holdup-problem arising with incomplete contracts and a relationship that involves specific inputs.
Antràs (2003) considers two agents engaged in production: a final good producer who supplies headquarter services and produces the final good, and a manufacturing firm which supplies an intermediate input that is required for the production of the final good. Both inputs – headquarter services and intermediate inputs – are tailored specifically to the production of the final good. From the point of view of the decision to integrate or to outsource intermediate inputs, the basic result of the model is the existence of a unique threshold such that when the production of the final good is intensive in headquarter services, integration dominates outsourcing, while for a situation where the production of the final good is more intensive in intermediate inputs, outsourcing does a better job.
Antràs and Helpman (2004) integrate the previous framework in a world of two countries, where the production of the final good combines intermediate inputs and headquarter services, sectors differ in relative input intensity and firms within sectors differ in their productivity level. In this setting, firms make two endogenous organizational choices. The first one concerns the ownership structure of the firm, which can decide to integrate the activity within its boundaries or not. The second one refers to the location decision for firms producing intermediate inputs, which can be located at home or abroad. The production of the final good only takes place in the domestic market. Therefore, concerning the supply decisions of intermediate inputs for firms producing final goods, they have four different strategies: domestic integration (DI), domestic outsourcing (DO), foreign integration (FI) and foreign outsourcing (FO).
Firms located in a foreign market benefit from lower relative variable costs but they face higher fixed organizational costs of search, monitoring and communication. Concerning the decision to integrate or to outsource, the result of Antràs (2003) applies: integration does a better job for efficiency when the relative intensity of headquarter services is high.
Fixed organizational costs are ranked as follows: f(FI)>f(FO)>f(DI)>f(DO), which says that regardless of the ownership structure of the firms, fixed costs are higher in the foreign market. The fixed costs of integrating or outsourcing abroad, f(FI) and f(FO), respectively, are higher than the costs of integrating or outsourcing at home, f(DI) and f(DO), respectively. Furthermore, for a given location, fixed costs of a firm integrating the production of intermediate inputs are higher than the fixed costs of an outsourcing firm. With respect to this latter assumption, on one hand the integration of the production of components implies additional supervision costs, and on the other hand integration might benefit from managerial economies of scope. Antràs and Helpman (2004) assume that additional supervision costs associated with integration are higher than potential economies of scope that may reduce the costs of integration relative to outsourcing. Overall, the ranking of fixed costs is as in the expression above.
The industry equilibrium predictions coming out of the model indicate that the location and integration decisions will depend on both the level of firm productivity (λ) and the relative input intensity of the industry. The pattern of results can be summarized as follows for headquarter-intensive industries. Firms decide to integrate or not and to locate abroad or not according to the following criteria: λ(DO)<λ(DI)<λ(FO)<(FI). Firms with the highest level of productivity, λ(FI), integrate the production of intermediate inputs in a foreign country (intra-firm trade). The next group corresponds to firms with a lower productivity level, λ(FO), which outsource in the foreign market (arm's length trade). Firms with a lower intermediate level of productivity integrate at home λ(DI). Finally, the group with the lowest level of productivity corresponds to domestic outsourcing firms λ(DO).
The model by Grossman and Helpman (2004) represents a second and different strand of this literature concerned with the international organization of production. In this setting, there is a different and more complex relationship between organizational form and productivity. The approach in this model is slightly different from the property rights approach of Antràs and Helpman (2004). Grossman and Helpman (2004) put forth a managerial incentives model of international organization of production. The model finds that foreign outsourcing is chosen by the most productive and the least productive firms, while intermediate productivity firms choose to integrate.
Given the extent to which the various assumptions and models put forth by the theory of international organization of production differ in their predictions, empirical evidence is an obvious strategy for discriminating between them. The rest of the paper is devoted to this objective.
Data and descriptive evidenceThis section describes the main characteristics of the dataset used in the analysis and presents some basic descriptive evidence on the magnitude and evolution of sourcing strategies by firms. This information is completed in the next section with a more in-depth analysis of the differences in performance between firms that are classified according to the choice of sourcing strategies they make.
We employ a longitudinal set of Spanish manufacturing firms taken from the Encuesta sobre Estrategias Empresariales (ESEE). The database contains a longitudinal sample of firms from 1990 to 2005. The sample of firms used in this section is a panel of firms that contains 20,113 observations corresponding to an average number of 1,359 firms per year. The final sample is an unbalanced panel of firms that is representative of the population of Spanish manufacturing firms (see Fariñas and Jaumandreu (1999) for more details on the characteristics of this data set; Delgado et al. (2002), Fariñas and Martín-Marcos (2007, 2010), and Merino and Rodríguez (2007) are examples of applications using the ESEE).
The measures of domestic and foreign sourcing are based on information reported directly by the firm in the survey. This information indicates whether or not the firm subcontracts some parts of its production process to external suppliers. In particular, firms report the value of their purchases of products and customized components subcontracted to external suppliers. To avoid ambiguity, we list the question to which firms were responding in the questionnaire. Firms should provide the “value of purchased products and components subcontracted to external suppliers and tailored to the needs of the firm (the firm can indicate whether it also provides some materials to the supplier)”.
The survey provides information on the total amount of subcontracted purchases of intermediate inputs as well as information which permit to estimate the value of these purchases that comes from suppliers located in the domestic market and the value that comes from purchases from suppliers located abroad. Furthermore, the survey provides additional information to compute the extent to which the amount of intermediate inputs subcontracted abroad comes from a related party or an unrelated party.
As we mention in the introduction, one characteristic of the dataset used is that the information the firm provides refers to intermediate inputs acquired within a bilateral relationship. These inputs are tailored to the needs of the firm. Our analysis does not simply refer to how firms acquire their intermediate inputs but to how firms acquire their customized intermediate inputs. The rest of the paper deals with this kind of transactions, which fits quite well with the theoretical literature on global sourcing summarized in ‘Theoretical framework and related literature’ section.
Although there is not a commonly accepted terminology (see Crinò, 2009), we use the term “domestic outsourcing” (DO) to refer to the activity of firms which subcontract some stages of their production process to external suppliers which are located in the domestic market. The term “foreign outsourcing” (FO) refers to firms that subcontract to external unaffiliated suppliers that are located in a foreign market. And, finally, we assign the term “foreign integration” (FI) to those firms that subcontract abroad with an affiliated company. Antràs and Helpman (2004) and Helpman (2006) use the term “intra-firm trade” to refer to FI and the term “arm's-length trade” to refer to FO. A similar use of the three terms (DO, FO and FI) can be found in Olsen (2006) and Feenstra (2010). The term “offshoring” is frequently used to refer to the sourcing of a good or service in a foreign country, either from an affiliated (FI) or an unaffiliated supplier (FO); see Helpman (2011).
According to previous information, we are able to classify firms into the following groups from the point of view of their outsourcing activities:
- (1)
Firms that outsource at home (DO)
- (2)
Firms that outsource abroad from unaffiliated suppliers (FO)
- (3)
Firms that outsource abroad from affiliated suppliers (FI)
As a matter of fact, a fourth organizational form emerges from our dataset, i.e., the group of firms that neither outsources at home nor offshores abroad. We can classify this group of firms as non-sourcing firms or, alternatively, consider that they integrate in the domestic market given that all transactions occur within the firm in the domestic market. For the moment, we think it is preferable to consider them a fourth organizational form. However, in the next section, as a robust test for the comparisons of different groups of firms, we consider these firms a special group of non-sourcing units. Therefore, we define a fourth group:
- (4)
Firms that integrate at home (DI)
After the definition of groups of firms to be considered, we begin by presenting some basic empirical regularities concerning both the level and the evolution of sourcing strategies over the period 1990–2005. We are able to identify eight different strategies. Table 1 reports the percentage share of firms performing these strategies. Four of them are single mode strategies (by slight abuse of notation, we denote these strategies by DO, FO, FI, and DI), and the rest corresponds to mixed combinations of the single mode strategies involving outsourcing at home and/or abroad (denoted by DOFO, DOFI, FOFI, and DOFOFI). In what follows we establish some stylized facts that can be drawn from our data set.
Extensive margin of sourcing strategies (average percentages of firms).
| Sourcing strategies | Firms with ≤200 employees | Firms with >200 employees | All firms |
|---|---|---|---|
| DO | 16.6 | 2.2 | 12.4 |
| FO | 0.0 | 0.0 | 0.0 |
| FI | 0.0 | 0.0 | 0.0 |
| DOFO | 17.9 | 34.5 | 22.8 |
| DOFI | 0.5 | 1.7 | 0.8 |
| FOFI | 0.0 | 0.0 | 0.0 |
| DOFOFI | 2.0 | 12.4 | 5.1 |
| DI | 63.0 | 49.2 | 58.9 |
| Number of observations | 14,197 | 5,939 | 20,136 |
Note: Sourcing strategies are represented as DO (domestic outsourcing), FO (foreign outsourcing), FI (foreign integration) as well as the combination of these strategies. DI corresponds to domestic integration, i.e. firms that do not perform any of the three previous strategies.
First, pure integration at home (DI) is quite common. About 58.9% of the firms do not report subcontracting any intermediate input to external suppliers, either in the domestic market (DO) or abroad (FO and FI). Such firms appear to be pursuing a deep vertical integration strategy in the home market. This integration at home is more intensive for small-medium firms relative to large ones, which rely more on outsourcing and integration in foreign markets.
Second, excluding DI firms, for the rest of the firms, combined strategies are more prevalent than single organizational forms. About 28.7% of the firms follow a combined strategy while only 12.4% of them follow a pure strategy. This regularity is more pronounced for the group of large firms where 48.6% follow a combined strategy against a small fraction, 2.2%, which follow a pure strategy.
Third, excluding DI firms and considering that the rest of sourcing strategies are not mutually exclusive, domestic outsourcing is more common than foreign sourcing independently of firm size. However, the gap between both strategies is larger for small-medium firms. Thirty-seven percent of small-medium firms perform domestic outsourcing (sometimes in combination with foreign sourcing), while only 19.9% of them perform foreign sourcing (sometimes in combination with domestic outsourcing). For large firms, these percentages are 50.8% and 46.9, respectively.
Fourth, concerning the size of the firm, there is a positive relationship between the probability of performing outsourcing either at home or abroad and the size of the firm. Similarly, there is a positive relationship between foreign integration and size. In general terms, the association is stronger for foreign outsourcing/integration than for domestic outsourcing. This suggests that performing this activity involves significant fixed costs for the firm and, consequently, larger ones are in better conditions to outsource/integrate abroad. Furthermore, after conditioning on both strategies, there is no significant relationship between the intensity of these activities and the size of the firm.
Fifth, Table 2 reports the magnitude of the intensive margins for the seven groups of firms considered. These margins show the magnitude of domestic outsourcing, foreign outsourcing and foreign integration in terms of the total value of intermediate inputs. When they are aggregated for the same group of firms, they give the proportion of subcontracted customized intermediate inputs relative to the value of intermediate inputs purchased by the firm. Two regularities emerge from the data: (1) domestic outsourcing has always the highest intensity for all groups of firms and (2) the average value of these intensive margins is quite similar across firms of different size classes.
Average intensity of sourcing strategies.
| Firms with ≤ 200 employees | Firms with >200 employees | All firms | |||||||
|---|---|---|---|---|---|---|---|---|---|
| DO intensity | FO intensity | FI intensity | DO intensity | FO intensity | FI intensity | DO intensity | FO intensity | FI intensity | |
| DO | 18.6 | 0 | 0 | 18.8 | 0 | 0 | 18.6 | 0 | 0 |
| FO | 0 | 0 | 0 | 0 | 0 | 0 | 0 | 0 | 0 |
| FI | 0 | 0 | 0 | 0 | 0 | 0 | 0 | 0 | 0 |
| DOFO | 14.3 | 2.5 | 0 | 11.6 | 3.4 | 0.0 | 13.1 | 2.9 | 0.0 |
| DOFI | 8.2 | 0 | 8.6 | 7.2 | 0 | 5.2 | 7.6 | 0 | 6.6 |
| FOFI | 0 | 0 | 0 | 0 | 0 | 0 | 0 | 0 | 0 |
| DOFOFI | 11.2 | 1.9 | 3.5 | 8.3 | 2.5 | 2.8 | 9.1 | 2.3 | 3.0 |
Note: Sourcing strategies are represented as DO (domestic outsourcing), FO (foreign outsourcing), FI (foreign integration) as well as the combination of these strategies. DI corresponds to domestic integration, i.e. firms that do not perform any of the three previous strategies.
The evolution of sourcing strategies is reported in Figs. 1 and 2. There is no clear and explicit tendency over the period for both the extensive and the intensive margins of domestic outsourcing. The extensive margin, i.e., the proportion of firms performing this activity, fluctuates around 40%. The intensive margin, conditional on the group of firms performing this activity, shows the magnitude of domestic outsourcing relative to the value of intermediate inputs. It fluctuates around 14% over the years with a slight reduction at the end of the period.
.")
.")
Furthermore, Fig. 1 shows a slight increase in the proportion of firms that perform foreign outsourcing over the period 1990–2005. Although there is a reduction in the years 2003 and 2004, the extensive margin increases from 25.2% in 1990 to 28.9% in 2005. A similar pattern can be found for the intensity of foreign outsourcing (see Fig. 2): at the beginning of the period, intermediate inputs subcontracted from abroad represented 2.9% of the total purchase of intermediate inputs, and at the end of the period, the magnitude reached the level of 5.9%. Therefore, foreign outsourcing has expanded through two channels: the participation rate has increased and so has the intensity of this activity within the group of firms that outsource abroad.
Distinguishing between the group of firms that perform offshoring with a related party and firms that use channels external to the firm, we observe a large difference in the magnitude of the extensive margin between both groups of firms. At the end of the period, only 6% of the firms perform offshoring via intra-firm trade, i.e., foreign integration, while 28.9% of the firms in the sample perform offshoring via transactions with non-related parties. In addition, the extensive margin of offshoring via affiliated parties diminishes slightly over the period, whereas offshoring with non-affiliated suppliers has increased significantly over the period. The intensive margins of offshoring performed with either non-affiliated or affiliated suppliers show a continuous and systematic increase throughout the period.
Sourcing strategies and the pattern of firm productivitiesIn this section we present an econometric analysis of the relationship between a firm's productivity and its sourcing behaviour. The aim of this analysis is to determine whether there are systematic productivity differences among firms according to their sourcing strategy. Therefore, the results in this section should be interpreted as correlations rather than causal relationships. Section ‘Offshoring and firm productivity: selection vs. relocation’ presents two attempts at identifying the direction of causality.
We follow the methodology proposed by Bernard and Jensen (1999) and many subsequent papers to estimate exporter premia. A similar methodology has been applied by Federico (2010) and Kohler and Smolka (2011) to estimate sourcing premia. Such premia are suggested by models summarized in ‘Theoretical framework and related literature’ section. According to these models, a firm's productivity level is an important determinant of sourcing decisions by firms. Therefore, we should expect that sourcing organizational forms follow a productivity ordering which may differ according to different models of sourcing behaviour by firms.
Before presenting our results, it is worthy of explaining in detail what are the main differences between our analysis and Kohler and Smolka (2011). This is helpful to further make clear the contributions of our paper.
First, both papers use the same dataset: the ESEE. However, our analysis is based on a question to which firms were responding in the ESEE questionnaire during the period 1990–2005. This question disappears from the questionnaire in 2006. Kohler and Smolka (2011) use two different questions that were introduced from 2006 to 2008, which is the time period they consider. Therefore, the information used in both articles is different.
Second, Section ‘Data and descriptive evidence’ includes the question that is used in this paper. It refers to the amount of purchases of goods “subcontracted to external suppliers and tailored to the needs of the firm” The questions that are used by Kohler and Smolka (2011) read quite differently: it refers to the “purchase of goods and services that the firm incorporates to the production process”, coming either from the domestic market or from foreign markets. Both questions are different from the one we use. As we mention in the introduction, our measure of sourcing refers to a bilateral relationship that requires specific investments by the supplier as he has to tailor the good supplied to the needs of the firm. In general terms, we think that our measure fits better to the models we take as reference to explore the relationship between firm's sourcing decisions and productivity.
This section is organized as follows. First, we define the productivity measures that we use. Second, we introduce the empirical approach to determine whether there are systematic productivity differences between firms according to their outsourcing strategy. Third, we present the main results of this analysis. Finally, we present some robustness checks.
Measures of firm productivityWith respect to the measurement of productivity, we consider three alternative definitions. The objective of looking at alternative measures of productivity is to be able to check the robustness of our results to different methods and assumptions.
Our first measure is labour productivity, which is defined as the ratio of value of gross production of goods and services expressed in real terms to the number of yearly effective hours of work.
The second measure refers to TFP and follows the framework developed by Aw et al. (2001). In particular, it is an extension of the multilateral total factor productivity index proposed by Caves et al. (1982), and has been used previously by Delgado et al. (2002). The expression used to estimate total factor productivity for firm i, at time t, in a given industry is:
where yit is the log of output, xitr is the log of input r, and ωitr is the cost share of input r. Firms are classified in two size groups of small and large firms⋅ A bar over a variable indicates the arithmetic mean of the variable. The average value of variables with index τ, refers to a given size group of firms; otherwise, the average refers to the entire sample of small and large firms. The estimation of this index considers three inputs: labour, intermediate inputs and capital input. Input cost shares, ωitr, are defined as the fraction of the cost of each input in total input costs. Total input costs are defined by the sum of labour costs, intermediate input costs and the cost of capital. The cost of labour is measured by the sum of wages, social security contributions, and other labour costs paid by the firm. The cost of intermediate inputs is measured by the sum of costs of raw materials purchases, energy and fuel costs and other services paid for by the firm. Intermediate inputs are expressed in real terms using individual price indexes of intermediate inputs reported by the firms. The user cost of capital is measured for each firm by the cost of the long-term external debt of each firm as reported by the ESEE plus the depreciation rate, dit, minus the variation of the aggregate price index for capital goods. Details of the definition of output and inputs can be found in the appendix.
The index takes a hypothetical firm as a reference and measures productivity in each year relative to this reference firm. In particular, the index uses the average firm of the industry and the size group the firm belongs to as the reference point, and then chain-links the average firm for both size groups to preserve transitiveness between firms of different size groups within the same industry. Reference firms are defined in terms of industry and size in order to take advantage of the characteristics of the data set. One of the advantages of this measure of productivity is that it is consistent with the assumption of firm heterogeneity, which plays a crucial role in the choice of organizational form according to the literature we take as a reference to organize our empirical work. This heterogeneity is reflected in the fact that input costs used in the estimation of TFP are different across firms within the same industry.
Our third measure is based on the estimation of production functions. As it is well known, this procedure results in an endogeneity bias due to the fact that productivity is known to the firms when they choose their input. As a consequence, the estimation and the resulting TFP residual are biased. A solution to this issue has been the use of estimators that model the unobserved productivity by using the semiparametric estimator introduced by Olley and Pakes (1996). They address the simultaneity issue by developing a two-step estimator of the production function where the level of investment spending by the firm is used to proxy for its unobserved productivity. We implement the Olley and Pakes (OP) routine with our dataset for industries defined at the two-digit level. The level of firms’ equipment investment as well as capital, labour and intermediate inputs as they have been defined for the calculation of λit were used to estimate TFP.
The estimation algorithm of OP additionally provides a solution to the selection problem associated with the use of a panel of firms to estimate TFP. Therefore, we take into account the survival probability of the firm. As exit decisions by firms are reported in the dataset, we can distinguish between firms exiting from the market and firms exiting the panel due to attrition.
The dataset used is particularly attractive for the estimation of TFP and for the estimation of production functions. Firms directly report their output price index as well as the price variation of their intermediate inputs. This dataset has been used extensively in the literature to address the various econometric issues related to the estimation of production functions (see, for example, Mairesse and Jaumandreu, 2005; Ornaghi and Van Beveren, 2011).
Empirical methodologyThe aim of this analysis is to determine whether there are systematic productivity differences between firms according to their outsourcing strategy. The estimation of these differences across groups of firms is made controlling for other firm characteristics. We follow the methodology proposed by Bernard and Jensen (1999) for the estimation of the so-called exporter productivity premia, defined as the ceteris paribus percentage difference of productivity between exporters and non-exporters. A similar approach was previously applied by Tomiura (2007) to estimate productivity premia for FO and FDI firms as well as Federico (2010) and Kohler and Smolka (2011) for the estimation of more general sourcing premia.
In particular, sourcing premia is estimated from a regression of log productivity on the current sourcing status of the firm (defined by a set of dummy variables) and a set of control variables. In particular, we estimate the following equation:
where i is the index of the firm and t is the index of the year. The variable productivity corresponds to one of the three alternative definitions of productivity as explained above. FI, FO and DO are dummy variables that capture the current sourcing status of the firm (one if the firm is included in any of the groups of firms that are considered, and 0 otherwise). We shall return to the criteria used for classifying firms in different sourcing groups below. Control is a vector of control variables that include size, age and the export status of the firm. The size of the firm is introduced as the log of the number of employees and its squared value. We follow the empirical literature on productivity premia for exporting in considering the set of control variables (see ISGEP, 2008).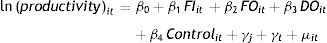
Since the sample includes firms operating in several industries, a set of industry dummies is included to take into account industry fixed effects, γj. Similarly, as firms are affected by common shocks over time, γt, a set of time dummies is included to control year-specific productivity shocks. Finally, μit=σi+εit is a composite error term including an unobserved firm-specific effect (σi) and an idiosyncratic error term (¿it).
In Eq. (1), DI is the baseline sourcing category against which the productivity premiums of the rest of the categories (FI, FO and DO) are measured. The sourcing productivity premiums computed from the coefficients β1, β2 and β3 are estimated as 100((exp(β))−1), and they show the average percentage difference in productivity between two group of firms after controlling for industry, year, size, age and export status of the firm.
Now, we turn to explain the criteria used for classifying firms in the different sourcing groups studied. In much of the theoretical literature on global sourcing, firms make a discrete choice according to which there is a unique profit maximizing strategy. Firms choose either FI, or FO, or DI, or DO. However, as reported in the previous section, a high percentage of firms follows a mixed sourcing strategy, and they subcontract intermediate inputs from various sources at the same time. This behaviour can easily be explained by assuming that firms need several intermediate inputs, they choose the optimal organization for each input and, as a consequence, we might observe firms using mixed strategies in their sourcing behaviour.
Given the existence of mixed strategies, we need some classification criteria for assigning firms to the four sourcing groups. We define sourcing dummies in three alternative ways. First, we start by assigning firms to a given organizational group according to the ranking of productivities suggested by Antràs and Helpman (2004). In this case, we apply a strict sourcing ranking that states that when a firm is active in more than one sourcing mode, we classify it in one exclusive category according to the following ranking, FI>FO>DI>DO. Therefore, firms that buy at least some intermediate inputs through foreign integration are assigned to the group FI. The group of firms that perform some foreign outsourcing but not foreign integration is assigned the dummy FO. Firms that subcontract intermediate inputs in the domestic market but do not outsource or integrate abroad are considered DO firms. Finally, as the group of firms that integrate in the domestic market forms a residual group of firms which does not simultaneously perform any other sourcing strategy, we assign them to the group DI.
Second, an alternative classification method is to assign firms according to the intensity of their sourcing activity. With this criterion, we assign each firm to the group with the highest proportion of subcontracted inputs relative to the value of intermediate inputs.
Third, an alternative way to construct sourcing dummies is what can be called non-mutually exclusive classification (Federico (2010) and Kohler and Smolka (2011) both apply a similar procedure). With non-mutually exclusive coding, each firm is classified in more than one dummy variable if pursuing multiple sourcing strategies. Firms can belong to more than one group. For example, for a firm that engages in both domestic outsourcing and foreign outsourcing, the dummies FO and DO both take on a value of one.
The use of the first two classifications, one based on the sourcing decision itself and the other on the intensity of sourcing, have the advantage of being in line with theoretical models in which firms adopt a unique sourcing strategy. An additional advantage of both classifications is that it allows for a more clear-cut identification of each organizational form. This is especially true in the case of FI and FO firms for which the incidence of mixed strategies is rather large. Table 3 reports how firms in our data set are classified according to the application of the three previous criteria. According to the first classification based on a “sourcing ranking,” DO is less prevalent than FO: 14.4% of the firms perform DO against 22.8% that perform FO. However, according to the classification based on a “not-mutually exclusive coding”, DO is the most prevalent sourcing mode with 41.1% of the firms adopting this organizational form. An important advantage of the use of a classification based on a not-mutually exclusive coding is that it fully exploits the information contained in the dataset. One of the objectives of using three alternative classifications is to check if our results are robust to alternative classification methods.
Classification of firms according to their sourcing strategy: alternative methods (percentages relative to the total number of firms).
| Classifications | Firms with ≤200 employees | Firms with >200 employees | All firms |
|---|---|---|---|
| 1. Ranking FI>FO>DI>DO | |||
| Domestic outsourcing (DO) | 16.6 | 2.2 | 12.4 |
| Foreign outsourcing (FO) | 17.9 | 34.6 | 22.8 |
| Foreign integration (FI) | 2.5 | 14.1 | 5.9 |
| 2. Intensity of sourcing | |||
| Domestic outsourcing (DO) | 34.8 | 42.9 | 37.1 |
| Foreign outsourcing (FO) | 1.5 | 5.0 | 2.6 |
| Foreign integration (FI) | 0.7 | 3.0 | 1.4 |
| 3. Not mutually exclusive coding | |||
| Domestic outsourcing (DO) | 37.0 | 49.2 | 41.1 |
| Foreign outsourcing (FO) | 19.9 | 47.0 | 27.9 |
| Foreign integration (FI) | 2.5 | 14.1 | 5.9 |
| Domestic integration (DI) | 63.0 | 49.1 | 58.9 |
| Number of observations | 14,197 | 5,939 | 20,136 |
Table 4 presents the main results on sourcing premia for the three classifications of the sourcing groups, and for each of the productivity measures. The first set of results in Table 4 (columns 1–3) is based on the ranking FI>FO>DI>DO. A first result to note is that, independently of the productivity measure used, the coefficients for FI are the largest. Moreover, these differences are statistically significant. This result, which is consistent with the models of global sourcing, means that firms that rely on international vertical integration (FI) perform better than firms that outsource by a different strategy. The magnitude of the productivity premia for FI is much larger for labour productivity (23.48%) than for TFP measures (3.40% and 1.95%, respectively).
Estimation of sourcing premia: main results.
| Dummy variables based on the ranking FI>FO>DI>DO | Dummy variables based on the level of sourcing intensity | Dummy variables based on a not-mutually exclusive classification | |||||||
|---|---|---|---|---|---|---|---|---|---|
| Labour productivity | TFP (Index) | TFP (OP) | Labour productivity | TFP (index) | TFP (OP) | Labour productivity | TFP (index) | TFP (OP) | |
| Sourcing dummies: | |||||||||
| DO | −1.74 | −1.79*** | −1.27** | 6.79*** | −0.61* | −1.76*** | 0.34 | −1.44*** | −0.97*** |
| (1.43) | (0.55) | (0.63) | (1.04) | (0.36) | (0.42) | (1.42) | (0.54) | (0.61) | |
| FO | 14.07*** | 0.07 | −2.02*** | 35.84*** | 4.19*** | 2.69** | 12.47*** | 1.36** | −1.20* |
| (1.34) | (0.43) | (0.49) | (3.82) | (1.15) | (1.33) | (1.81) | (0.61) | (0.67) | |
| FI | 23.48*** | 3.40*** | 1.95** | 54.62*** | 5.90*** | 7.64*** | 10.91*** | 3.65*** | 3.98*** |
| (2.27) | (0.69) | (0.82) | (5.93) | (1.37) | (1.76) | (2.05) | (0.70) | (0.84) | |
| Other variables: | |||||||||
| Size | 0.033 | 0.032*** | 0.007 | 0.042* | 0.033*** | 0.006 | 0.036 | 0.032*** | 0.007 |
| (0.023) | (0.008) | (0.009) | (0.023) | (0.008) | (0.009) | (0.023) | (0.008) | (0.009) | |
| (Size)2 | 0.009*** | −0.002*** | −0.000 | 0.008*** | −0.002*** | 0.000 | 0.009*** | −0.002*** | −0.000 |
| (0.002) | (0.001) | (0.000) | (0.002) | (0.001) | (0.001) | (0.002) | (0.001) | (0.001) | |
| Age | 0.030*** | 0.028*** | 0.007** | 0.032*** | 0.028*** | 0.006** | 0.030*** | 0.028*** | 0.007** |
| (0.006) | (0.002) | (0.002) | (0.006) | (0.002) | (0.003) | (0.006) | (0.002) | (0.003) | |
| Export | 0.358*** | 0.040*** | 0.002 | 0.372*** | 0.042*** | 0.001 | 0.362*** | 0.040*** | 0.002 |
| (0.012) | (0.004) | (0.005) | (0.012) | (0.004) | (0.005) | (0.012) | (0.004) | (0.005) | |
| Equality tests (p-values): | |||||||||
| DO vs. FO | 0.000 | 0.003 | 0.282 | 0.000 | 0.000 | 0.000 | 0.000 | 0.008 | 0.846 |
| DO vs. FI | 0.000 | 0.000 | 0.001 | 0.000 | 0.000 | 0.000 | 0.000 | 0.000 | 0.000 |
| FO vs. FI | 0.000 | 0.000 | 0.000 | 0.005 | 0.321 | 0.019 | 0.587 | 0.012 | 0.000 |
| Observations | 20,135 | 20,030 | 20,135 | 20,135 | 20,030 | 20,135 | 20,135 | 20,030 | 20,135 |
| R2 | 0.361 | 0.138 | 0.526 | 0.362 | 0.138 | 0.526 | 0.360 | 0.138 | 0.526 |
Note: Estimated coefficients from OLS-regressions of productivity on dummy variables that capture the current sourcing status of the firm (DO, domestic outsourcing; FO, foreign outsourcing; FI, foreign integration), a full set of year dummies, a full set of industry dummies and a set of control variables. Numbers in parentheses are standard errors robust to heteroskedasticity of estimated coefficients. In order to facilitate the interpretation, the estimated coefficients for the sourcing status dummies have been transformed by 100(exp(βj)−1) where βj are the estimated coefficients. The three rows grouped under the name Equality tests give p-values of tests for equality of coefficients.
With respect to FO, DO and DI firms, estimates identify a ranking of coefficients quite consistent to the theory when using labour productivity and a TFP index. For both measures, the coefficients for DO are the lowest (although this coefficient is not significant when using labour productivity), and firms that outsource in the foreign market (FO) and integrate in the domestic market (DI) are at intermediate positions in the ranking of productivities. Moreover, the average productivity is higher for FO firms relative to DI firms (although FO coefficient is not significant when using an index of TFP). Again, differences between coefficients reported in the table are statistically significant. Overall, these differences are consistent with the ranking of productivities suggested by models summarized in ‘Theoretical framework and related literature’ section.
Using the TFP estimated by the OP procedure, estimates for FO, DO and DI are no longer consistent to the theory prediction. However, in this case, differences on sourcing premia seem to be estimated more imprecisely. In particular, differences between DO and FO firms are not statistically significant.
Now, we focus on the results for sourcing premia when firms are assigned to a sourcing group depending exclusively on their level of sourcing intensity (see columns 4–6 in Table 4). Again, results show a ranking of coefficients quite consistent to the theory. First, firms using FI as the main channel for their sourcing behaviour continue at the top of the ranking of productivities. Second, FO firms are, for all three types of productivity measures, in the second position of the ranking of productivities. Finally, for two of the three productivity measures, the average productivity is higher for DI firms relative to DO firms. This is not the result when using labour productivity. A possible explanation for this result is that, using this classification criteria some firms previously classified as FI or FO firms are now assigned to the group of DO firms. This reassignment of firms between groups may raise the average level of productivity of DO firms and, as a consequence of this feature, DI firms appear at the bottom of the ranking when using labour productivity.
The last set of results in Table 4 (columns 7–9) explicitly addresses the incidence of mixed sourcing strategies. This feature of the data is captured by coding sourcing dummies in a non-mutually exclusive way. In this case, evidence on the relationship between sourcing strategies and productivity is not as conclusive as before. First, for two of the three productivity measures, the coefficients for FI are the largest, and the differences with respect to the second category (FO) are statistically significant. However, this result no longer holds when labour productivity is used. In this case, estimated coefficient of FO is larger than the FI one, although they are not statistically different. Second, FO firms are in the second position of the ranking of productivities only when the index of TFP is used. Finally, DO firms only clearly appear at the bottom of the ranking when using the TFP estimated by the OP procedure. However, it is important to notice that a high percentage of firms follows a mixed sourcing strategy. Therefore, when using this classification method, a large fraction of firms is classified in more than one dummy variable, and this makes identification of productivity premia associated to global sourcing difficult. For this reason we prefer not giving the same weight to the results obtained with this classification as to the others.
We summarize our results in Table 5, which combines the three classifications and the three alternative definitions of productivity. Overall, in two out of the nine possibilities the sorting of firm productivities is fully consistent with the ranking proposed by Antràs and Helpman (2004). However, we also confirm many partial aspects of the ranking:
- -
FI firms are always at the top of the distributions of firm productivity. In two out of the nine comparisons FI firms share the highest level of productivity with FO firms although differences are not statistically significant.
- -
The lowest level of productivity corresponds, almost always, to DO firms. Only for labour productivity and the classification based on source intensity, DO firms have higher productivity than DI firms. In four other comparisons DO is at the bottom of the distribution but the difference is not statistically significant with respect to some other group.
- -
In seven out of the nine comparisons FI and FO firms dominate the productivity of firms following a domestic sourcing strategy.
- -
With a few exceptions, the general pattern of productivity differentials indicates that FI firms perform among the best and DO firms perform among the worst.
Summary of results.
| Measure of productivity | Type of classification | ||
|---|---|---|---|
| Based on the ranking FI>FO>DI>DO | Based on the level of sourcing intensity | Not-mutually exclusive | |
| Labour productivity | FI>FO>DI=DO | FI>FO>DO>DI | FI=FO>DI=DO |
| TFP (index) | FI>FO=DI>DO | FI=FO>DI>DO | FI>FO>DI>DO |
| TFP (OP) | FI>DI>FO=DO | FI>FO>DI>DO | FI>DI>FO=DO |
We assess three robustness checks of our findings. The two first robustness checks are related to the definition of the sample, while the third one is related to the estimation method. The first robustness check concerns the classification of “non-sourcing” firms as firms that fully integrate in the domestic market (DI). The second robustness check refers to the distinction between headquarter firms and affiliate firms. As Kohler and Smolka (2011) suggest, predictions of models of global sourcing should refer to true headquarter firms. Given the importance of inward FDI in the Spanish manufacturing sector, we control for this fact restricting the sample of firms used to true headquarter firms. The third robustness check presents fixed effects estimation results. In doing these robustness checks, we restrict the analysis to the classification of firms based on the ranking FI>FO>DI>DO. Therefore, the comparison should be made with the results shown in columns 1–3 in Table 4.
The first robustness check is presented in columns 1–3 in Table 6. In this case, we test the robustness of our findings to the consideration of “non-sourcing” firms as DI firms. In previous tables, when the incidence of subcontracting is zero, we interpret this as a form of domestic integration in which all intermediate inputs occur within the same firm. An alternative decision would have been to drop these “non-sourcing” firms from the estimation sample considering that we are only able to fully observe three groups of sourcing firms: FI, FO and DO.
Estimation of sourcing premia: robustness checks (dummy variables based on the ranking FI>FO>DI>DO).
| Excluding firms that integrate at home (DI) | Excluding local affiliates which are majority owned by a foreign firm | Fixed effects results | |||||||
|---|---|---|---|---|---|---|---|---|---|
| Labour productivity | TFP (index) | TFP (OP) | Labour productivity | TFP (index) | TFP (OP) | Labour productivity | TFP (index) | TFP (OP) | |
| Sourcing dummies: | |||||||||
| DO | – | – | – | 1.24 | −1.41** | −1.54** | 0.22 | −0.32 | −0.35 |
| (1.46) | (0.57) | (0.65) | (1.09) | (0.58) | (0.69) | ||||
| FO | 38.76*** | 3.81*** | 0.96 | 23.29*** | 1.01** | −2.20*** | 2.62*** | −0.05 | −0.55 |
| (2.67) | (0.74) | (0.80) | (1.59) | (0.49) | (0.55) | (1.03) | (0.54) | (0.55) | |
| FI | 64.37*** | 7.98*** | 5.63*** | 27.36*** | 5.18*** | 2.62* | 1.73 | 0.37 | −0.34 |
| (4.20) | (1.04) | (1.19) | (3.46) | (1.26) | (1.35) | (1.70) | (1.05) | (1.07) | |
| Other variables: | |||||||||
| Size | −0.186*** | 0.009 | −0.035*** | 0.058** | 0.013 | 0.002 | −0.371*** | −0.087*** | −0.049 |
| (0.034) | (0.011) | (0.013) | (0.027) | (0.009) | (0.011) | (0.070) | (0.030) | (0.034) | |
| (Size)2 | 0.026*** | −0.001 | 0.003** | 0.003 | −0.001 | 0.000 | 0.018** | 0.009** | 0.008** |
| (0.004) | (0.001) | (0.001) | (0.003) | (0.001) | (0.001) | (0.008) | (0.004) | (0.004) | |
| Age | −0.011 | 0.015*** | −0.002 | 0.053*** | 0.030*** | 0.008*** | 0.007 | 0.024* | −0.002 |
| (0.009) | (0.003) | (0.004) | (0.007) | (0.003) | (0.003) | (0.024) | (0.014) | (0.016) | |
| Export | 0.231*** | 0.033*** | 0.020 | 0.332*** | 0.033*** | −0.001 | 0.055*** | 0.014 | 0.013 |
| (0.018) | (0.007) | (0.008) | (0.012) | (0.004) | (0.005) | (0.015) | (0.009) | (0.009) | |
| Equality tests (p-values): | |||||||||
| DO vs. FO | – | – | – | 0.000 | 0.000 | 0.370 | 0.065 | 0.712 | 0.801 |
| DO vs. FI | – | – | – | 0.000 | 0.000 | 0.004 | 0.438 | 0.554 | 0.992 |
| FO vs. FI | 0.000 | 0.000 | 0.000 | 0.235 | 0.001 | 0.000 | 0.595 | 0.681 | 0.842 |
| Observations | 8,273 | 8,241 | 8,273 | 16,979 | 16,885 | 16,979 | 20,135 | 20,030 | 20,135 |
| R2 | 0.580 | 0.137 | 0.580 | 0.327 | 0.125 | 0.523 | 0.221 | 0.141 | 0.069 |
Note: Estimated coefficients from OLS-regressions of productivity on dummy variables that capture the current sourcing status of the firm (DO, domestic outsourcing; FO, foreign outsourcing; FI, foreign integration), a full set of year dummies, a full set of industry dummies and a set of control variables. Numbers in parentheses are standard errors robust to heteroskedasticity of estimated coefficients. In order to facilitate the interpretation, the estimated coefficients for the sourcing status dummies have been transformed by 100(exp(βj)−1) where βj are the estimated coefficients. The three rows grouped under the name Equality tests give p-values of tests for equality of coefficients.
The first set of results in Table 6 (columns 1–3) reports the results of the estimates when the group of DI firms is dropped from the sample. In this case, DO is the baseline sourcing category against which the productivity premiums of the rest of the categories (FI and FO) are measured. We find that the magnitude of the coefficient is highest for FI, lowest for DO, and it is at an intermediate level for FO firms. These results are similar to those presented in Table 4. The main difference is found when TFP is estimated using the Olley–Pakes procedure. In this case, the difference between FO and DO is as expected according to Antràs and Helpman (2004), but it is not statistically significant. Therefore, we can conclude that the main results are robust to excluding the group of “non-sourcing” firms.
The second robustness check is presented in columns 4–6 in Table 6, which reports regression results obtained excluding non-true headquarter firms. Models of global sourcing consider the sourcing decisions of true-headquarter firms. The sample of Spanish manufacturing firms we are using to test the ranking of productivities includes foreign-owned firms. They are subsidiaries of multinational firms that have an SIC manufacturing code as their principal business activity. In these companies, the parent firm might decide about the sourcing strategy of the subsidiary. The presence of such firms in the sample can be the source of a potential bias. This is especially true in the case of subsidiaries performing FI as they could be sourcing from their parent companies.
In the second set of results in Table 6 (columns 4–6), the sample of firms is restricted to true headquarter firms. This means the exclusion of local subsidiaries that are majority-owned by foreign capital (more than 50% of the total stockholders’ equity of the firm is subject to foreign ownership). The application of this criterion excludes 15.7% of the total number of observations in the original sample. Results are similar to those presented in columns 1–3 in Table 4, and the ranking of productivities is exactly the same with both samples (including and excluding non-true headquarter firms). Again, we can conclude that our main results are robust to this check.
The third robustness check presents fixed effects results. In principle, this is one possible way to account for unobserved heterogeneity associated with time-invariant firm characteristics which may lead to a biased estimate of the sourcing productivity premia. However, in a context with more than two categories (such as ours is), the interpretation of fixed effects results is not clear, and as a consequence estimated coefficients may not be interpreted as indicating the presence of a sourcing premia (see Kohler and Smolka (2011) for a discussion about this problem). Furthermore, although dummy variables representing the sourcing strategies of the firms (FI, FO, DI, and DO) are time-varying variables, the low within variation of these variables casts doubts on the identification of their effects using a fixed effects approach.
Fixed effects results are shown in columns 7–9 in Table 6. In this case, we do not observe statistically significant productivity differences between firms with different sourcing strategies. Therefore, productivity premia associated with sourcing are not robust to the inclusion of fixed effects. However, as we explained before, this result should be viewed with some caveats.
Offshoring and firm productivity: selection vs. relocationThe results of the previous section reveal a quite robust pattern of correlation between firm productivity and sourcing decisions. As we said at the beginning of ‘Sourcing strategies and the pattern of firm productivities’ section, this pattern does not establish any kind of causality running from a firm's sourcing behaviour to its productivity level nor in the other direction. However, the panel structure of our dataset permits us to perform two basic descriptive regressions that can be interpreted in terms of an alternative hypothesis concerning the relationship between offshoring and firm productivity. In what follows, we present two analyses that offer additional empirical evidence on the relationship between productivity and input sourcing.
Selection hypothesisThe first analysis refers to what can be called the selection hypothesis. An interpretation of models of global sourcing is consistent with the idea that firms self-select in an organizational mode according to their level of productivity. If organizational fixed costs are higher for foreign integration than for the rest of the organizational modes, then profit maximization would imply that only the most productive firms will be able to bear the fixed costs of this sourcing strategy. The implication would be that the most productive firms self-select into foreign integration.
The group of offshoring firms that either source in a foreign country from affiliated suppliers (FI) or form unrelated parties (FO) is, according to the evidence presented in ‘Sourcing strategies and the pattern of firm productivities’ section, the group with the highest average level of productivity. Now, our objective is to test whether this productivity differential is consistent with the selection of the most productive firms into offshoring (note that the term offshoring refers to FI and FO). We implement this test by defining the cohort of firms which start offshoring. A firm is considered to be part of the cohort of entering firms in year t if three conditions hold: (i) there is a transition from non-offshoring to offshoring in year t, (ii) the firm has not performed this activity for at least 3 years before (from t−3 to t−1), and (iii) the firm continues to perform this activity at least three years later (form t+1 to t+3). These conditions restrict our analysis to the period 1993–2002. Self-selection would imply that ex ante, the productivity level of firms belonging to the cohort of offshoring firms at t is higher than the productivity level of non-offshoring firms. Formally, for each cross-section between years 1993 and 2002:

The sample of firms for each year is composed of firms belonging to the cohort of offshoring firms and non-offshoring firms. Productivity(t−1) is the level of productivity of firms at t−1, Entry Cohort(t) is a dummy variable equal to one if the firm belongs to the cohort of firms starting their offshoring activity at time t and zero otherwise, Controli is a set of control variables that includes size, age and exporting, γj is a set of industry dummies and ¿i is an idiosyncratic error. The coefficient β1 measures the ex ante productivity differences between the cohort of firms starting offshoring and non-offshoring firms.
Given that the number of firms for each cohort of entering firms is rather small, Table 7 presents the results from the estimation of equation (2) when all observations are pooled in the same regression. One advantage of pooling data across years is that it increases the sample size, and it allows us to obtain more accurate estimations. On average, the coefficient of interest is positive and statistically significant (at the 5% level) only for labour productivity. Our main conclusion is that, on average, evidence supporting the hypothesis of self-selection is weak.
Ex-ante productivity level differences between offshoring firms (FI and/or FO) and non-offshoring firms (pooling observations over all cohorts of offshoring and non-offshoring firms).
| Dependent variable: Productivity at t−1 | Labour productivity | TFP (index) | TFP (OP) |
|---|---|---|---|
| Dummy variable: Cohorts of offshoring firms entering at t | |||
| 0.11** | 0.01 | −0.02 | |
| (0.04) | (0.02) | (0.02) | |
| Other variables: | |||
| Industry dummies | Included | Included | Included |
| Cohort dummies | Included | Included | Included |
| Other controls | Included | Included | Included |
| Observations | 5,722 | 5,680 | 5,722 |
Note: Each element of this table reproduces the coefficient β1 of Eq. (2) estimated when all observations corresponding to all the entry cohorts are pooled in the same regression. Estimates present the estimated coefficient β1 from OLS-regressions of productivity at year t−1 on a dummy variable equal to one for the cohort of firms starting their offshoring activity at year t and zero otherwise, a full set of industry dummies, cohort dummies, and a set of control variables (log(size), (log(size))2 and log(age)), and a dummy for exporting status. Numbers in parentheses are standard errors robust to heteroskedasticity of estimated coefficients.
The second analysis in this section refers to what can be called the relocation hypothesis. This evidence examines the relationship running from sourcing to productivity focusing the attention on offshoring firms. The literature on offshoring has suggested many channels through which foreign sourcing might influence productivity. For example, it could give access to lower priced inputs or to obtain higher-quality intermediate inputs. It could also be a learning mechanism by which a firm improves its products from contact with new suppliers (a systematic review of all these effects are summarized by Görg et al., 2008). Instead, we concentrate our attention on one particular channel of influence on productivity that can be easily identified. When firms decide to offshore intermediate inputs, they relocate parts of their production stages to other locations. This relocation in the choice of inputs implies a compositional change which may have an immediate and direct impact on firm productivity. We explore the existence of this type of effect on productivity by looking at firms with a transition from the domestic market to the foreign market in their sourcing of intermediate inputs. We compare the productivity growth in the year a firm starts to offshore with the trajectory of productivity before and after this decision takes place. We would expect an increase in the productivity level of the firm immediately after the decision to source in a foreign market. Formally, we estimate the following regression for the sample of entering offshoring firms over the period 1993–2002:

The sample of firms included in the estimation of Eq. (3) is restricted to those firms which start offshoring during the period. As in the estimation of Eq. (2), a firm is considered to be part of the sample of entering offshoring firms if: (i) there is a transition from no-offshoring to offshoring, (ii) the firm has not performed this activity for at least 3 years before, and (iii) the firm continues performing this activity at least three years later. Variable ΔProductivityit is the productivity growth of firm i at time t, EntryYearit is a dummy variable equal to one in the year firm i starts its offshoring activity and zero in the rest of the years (i.e., EntryYearit=1 if firm i starts its offshoring activity at year t, and 0 otherwise), Controlit is a set of control variables that includes size, age and exporting, γj is a set of industry dummies and ¿it is an idiosyncratic error. The coefficient β1 measures the productivity growth difference in the year of entry relative to the rest of the years.
Table 8 summarizes the main results of this analysis. The null hypothesis of relocation would imply a positive and significantly different from zero coefficient of β1 in Eq. (3). However, we cannot reject the null hypothesis in any of the specifications that are presented in Table 8. Therefore, it seems that there is no change in the rate of productivity growth for firms that start their offshoring activity during the period. The last set of results in Table 8 (columns 4–6) reports additional evidence from regressions that include two additional dummy variables (denoted by EntryYearit+1+1 and EntryYearit+2+2) identifying the subsequent years to starting offshoring activity (for example, EntryYearit+1+1=1 if firm i starts its offshoring activity at year t, and 0 otherwise). The objective of the inclusion of these two additional variables is to check whether the effect on productivity is observed with some lag. Again, as these coefficients are not statistically significantly different from zero, we do not find evidence supporting the relocation hypothesis in the sample of offshoring firms.
Productivity growth differences in the transition to an offshoring (FI and/or FO) activity.
| Dependent variable: Productivity growth | Labour productivity | TFP (index) | TFP (OP) | Labour productivity | TFP (index) | TFP (OP) |
|---|---|---|---|---|---|---|
| Dummy variable: | ||||||
| Year of entry | 1.25 | −0.34 | −0.47 | 1.55 | −0.23 | −0.38 |
| (1.54) | (1.04) | (1.07) | (1.56) | (1.05) | (1.08) | |
| Year of entry+1 | 2.00 | 0.25 | 0.08 | |||
| (1.50) | (1.01) | (1.05) | ||||
| Year of entry+2 | 0.79 | 0.72 | 0.77 | |||
| (1.42) | (0.96) | (0.99) | ||||
| Other variables: | ||||||
| Industry dummies | Included | Included | Included | Included | Included | Included |
| Other controls | Included | Included | Included | Included | Included | Included |
| Observations | 2,401 | 2,385 | 2,401 | 2,401 | 2,385 | 2,401 |
Note: Estimates present the coefficient β1 of Eq. (3) estimated from OLS-regressions of productivity growth at year t on a dummy variable equal to one in the year firm i starts its offshoring activity and zero in the rest of the years, a full set of industry dummies, a set of control variables (log(size), (log(size))2 and log(age)), and a dummy for exporting status. The last three columns also include two dummy variables: the first one is equal to one in the year after firm i starts its offshoring activity and zero otherwise (Year of entry+1), and the second variable is equal to one two years after firm i starts its offshoring activity and zero otherwise (Year of entry+2). Numbers in parentheses are standard errors robust to heteroskedasticity of estimated coefficients.
However, the literature has proposed alternative methods for testing the relocation hypothesis. Using a similar sample of firms to that used in this paper, Fariñas et al. (2014) find evidence supporting this hypothesis: firms’ decisions to relocate some stages of their production process to external suppliers result in a positive impact on the productivity level of these firms. However, there are some important differences between both analyses. The first and main difference is methodological. Fariñas et al. (2014) propose testing the relocation hypothesis in the context of the estimation of a production function. In doing this, two dummy variables are included to control the decisions to start and/or stop outsourcing/offshoring. A second difference between both studies is that, in testing the relocation hypothesis, Fariñas et al. (2014), due to identification restrictions, do not distinguish between domestic outsourcing (DO firms in the terminology used in the present paper) and offshoring (FI and/or FO firms in the terminology used in the present paper). Therefore, this paper confirms an increase in the productivity level of the firm immediately after the decision to source either in the domestic market or abroad. Overall, we conclude that the evidence on the relocation hypothesis is not conclusive, so further research is needed.
ConclusionsThis paper uses a sample of Spanish manufacturing firms to provide evidence on the choice between outsourcing and integration at home and abroad. It focuses on the relationship between sourcing strategies and firm productivity.
Sourcing decisions examined in this paper refer to very specific relationships between firms and input suppliers. One characteristic of the dataset used is that the information the firm provide refers to intermediate inputs acquired within a bilateral relationship in such a way that goods are tailored to the needs of the firm. Our analysis does not simply refer to how firms acquire their intermediate inputs but to how firms acquire their customized intermediate inputs. This type of information adapts quite well to the theoretical literature on global sourcing that we take as reference to organize our empirical work.
We perform our analysis along two dimensions. First, we analyse whether there exists a relationship (i.e. correlation) between productivity and sourcing strategies. Second, we present two attempts at identifying the direction of causality. In particular, we test for the selection hypothesis and the relocation hypothesis.
Regarding the correlation analysis, our results indicate that firm productivity differs systematically across groups of firms with different sourcing strategies. In our preferred specifications, the productivity of firms which engage in foreign integration, importing customized intermediate inputs from subsidiaries located abroad, outperforms the rest of the groups. In most of the comparisons, the group of firms that outsource in the domestic market is at the bottom of the productivity distribution. Moreover, the productivity premia of firms which perform foreign outsourcing and integrate at home are, in general, in an intermediate position. In most of the comparisons, foreign outsourcing firms dominate firms that integrate at home. As a main conclusion of this analysis, we find evidence on the relationship between sourcing strategies and productivity which is not fully consistent with the theoretical model of global sourcing suggested by Antràs and Helpman (2004) but we confirm many partial aspects of the ranking proposed by these authors. These results are not robust neither to the consideration of mixed sourcing strategies nor to the inclusion of fixed effects in the estimation. But, we argue that the results in these two cases should be viewed with some caveats.
Regarding the analysis of the direction of causality, first we offer empirical evidence to check whether the advantage of offshoring firms (i.e., firms that outsource their inputs abroad, either from an affiliated or a non-affiliated firm) is consistent with the selection of the most productive firms into offshoring. To do this, we observe ten cohorts of firms in the transition from non-offshoring to offshoring over the period 1993–2002. We find some weak evidence of self-selection of firms into offshoring.
Second, we explore a second type of effect that the literature on offshoring has emphasized: the positive impact of offshoring on future productivity. Taking the sample of firms with a transition from the domestic market to the foreign market in their sourcing strategy as a reference, we do not observe any change in the trajectory of productivity growth after the decision to offshore takes place. However, there exists evidence in the literature supporting the relocation hypothesis. We think that the evidence on the relocation hypothesis is not conclusive, and further research is needed.
We conclude with some final remarks on policy considerations. According to models of global sourcing the productivity distribution of firms has a strong influence on the sorting of firms in their sourcing decisions. As the productivity and the size distributions of firms are positively and intensely associated, the size characteristics of the Spanish manufacturing sectors will also influence the distribution of sourcing strategies. For example, Spain is one of the EU countries with a higher proportion of small and medium-sized enterprises. This implies that the Spanish manufacturing industry should show a preference for domestic outsourcing over offshoring and for international outsourcing over foreign integration compared to other EU countries. Government policies aimed to promote small and medium-sized enterprises should be aware that they might have a significant influence on the sourcing decisions by firms.
In a world of global sourcing, firms require to import from abroad and to offshore some parts of their value chains to remain competitive both in the domestic and international markets. Current industrial policies, as in the EU (see European Commission, 2012) that set out a roadmap for reindustrialization, should take this into account. Industry-specific support policies might have no role to play in a world where firms offshore in a systematic way. Global sourcing challenges the common policy thinking about industrial policy and competitiveness. From this point of view, our results provide valuable insights for understanding the consequences of global production decisions by firms at an aggregate country level.
Finally, our results are interesting for understanding productivity. In this sense, we find a quite systematic relationship between sourcing strategies and productivity at the firm level. Although we are not so successful in explaining this relationship. We find some weak evidence of self-selection and no influence of relocation on firm productivity.
We thank Jordi Jaumandreu and Rosario Crinò for useful comments and suggestions. We are especially grateful to the editor and to two anonymous referees for very helpful suggestions. This research has been funded by the Ministry of Economy and Competitiveness (Spain) projects ECO2010-18947 and ECO2014-52051-R.
The data set is a longitudinal survey of Spanish manufacturing firms that comes from the Encuesta sobre Estrategias Empresariales (ESEE), collected by the Fundación Empresa Pública and sponsored by the Spanish Ministry of Industry. This data set contains a longitudinal sample of firms from 1990 to 2005. The definition of the variables used in the analysis is as follows:
- -
Age: computed as the difference between the calendar year at t and the birth-year reported by the firm.
- -
Capital input: net capital stock at current replacement value calculated from an initial estimate of the capital stock according to the perpetual inventory formula for each firm:

- -
Foreign ownership: dummy variable indicating that foreign ownership is 50% or more of total equity.
- -
Intermediate input: measured by the cost of intermediate inputs, which includes raw materials purchases, energy and fuel costs and other services paid for by the firm. Intermediate inputs are expressed in real terms using individual price indexes of intermediate inputs reported by the firm.
- -
Labour input: measured by the number of effective hours of work per year, which is equal to normal hours plus overtime hours minus non-working hours.
- -
Output: measured by the annual value of gross production of goods and services expressed in real terms using price indexes for each firm reported by the ESEE.
- -
Size: log of employment defined by the average number of workers.
- -
Subcontracted purchases of intermediate inputs: the procedure to calculate the values of domestic outsourcing (DO), foreign outsourcing (FO) and foreign integration (FI) can be summarized as follows: firms report the value of purchases of elaborated products and customized components subcontracted to external suppliers. We consider the value of these purchases to be equal to the three following components: the total amount of intermediate inputs outsourced by the firm in the domestic market (DO), the amount of purchases outsourced abroad (FO) and the quantity integrated abroad (FI).
The firm reports a second piece of information, which is the value of customized intermediate imports coming from affiliated companies located in a foreign market. We identify this amount reported by the firm as the amount of foreign integration (FI).
We still have to split the remaining purchases of elaborated products and customized components into domestic outsourcing (DO) and foreign outsourcing (FO). To this end, we assume that the distribution of subcontracted purchases at the firm level between the domestic market (DO) and the foreign market (FO+FI) is equal to the distribution of total purchases of intermediate inputs between the domestic and the foreign market for each firm. So far, we have identified the amount of domestic outsourcing (DO) and the amount of foreign integration (FI). Now the identification of foreign outsourcing (FO) is straightforward.