


A complex critical decision in marketing and economics is pricing. Finding the right price for a product requires careful assessment of the product attributes. Product efficiency evaluation establishes the relative appeal of a product, when compared with the observable attributes and prices of competing products. The main contribution of this paper is combining hedonic pricing with frontier analysis to estimate product efficiency, which is a novel approach. We apply this method to the running shoes market. We find four attributes as main drivers of price: Stability, Cushioning, Flexibility and Response. The model also identifies overpriced products and predicts the price reductions needed in order to be comparatively competitive, a prerequisite for overall business performance. Our results show the dynamics of price adjustments in the market. Overpriced products adjust prices down quickly gaining comparative appeal. Another interesting finding is that product efficiency strongly correlates with the evaluations made by independent experts.
Understanding consumer decision-making processes is a critical issue for corporate managers in today's highly competitive markets. Firms can only satisfy customer needs as long as they are able to understand them. This is why considerable research effort has been devoted to understand consumer purchasing decision processes (Shamsher, 2014). Within this branch of research, many studies have focused on the role that product attributes play in buying decision making (Olson et al., 1979; Shamsher, 2014).
Kotler et al. (2004) describes product attributes as those characteristics that complement the basic function of the product. Product attributes play an important role from the viewpoint of both sellers and buyers (Akpoyomare et al., 2012). Sellers combine product attributes in order to differentiate their products and brands from competing firms. In turn, buyers focus on product attributes in order to evaluate products for choosing which one to buy (Shamsher, 2014). In this manner, the result of the buying decision will be determined by the attributes of the product and the importance the consumer attaches to each of those attributes.
This paper is related to several streams of research in marketing and economics, particularly those concerned with price setting from an applied viewpoint. The paper aims at determining the main drivers of the going market prices of running shoes. In doing so, we follow Lancaster's (1966) attributes view, which understands a product, as a bundle of attributes. The valuation of the characteristics of the product is a fundamental issue in the development and commercialization of products and services (Allenby et al., 2014). Running shoes are a highly differentiated product selling at prices that vary over an extremely wide range. Runners’ buying decisions are not driven only by prices. In contrast, attributes such as cushioning, lightweight, flexibility, response, grip or stability are increasingly important to guide purchasing decisions. After specifying the main product attributes of running shoes, we will estimate a hedonic price model in order to find the relative impact of the different attributes on the final market price. In other words, we try to find out how the different characteristics combine to determine going prices. The hedonic pricing methodology considers that the difference in the price of the running shoes is due to its underlying characteristics. Thus, the hedonic price of a running shoe indicates the maximum price that the consumer could be willing to pay if he/she wants to enjoy the portfolio of characteristics associated with that pair of running shoes. A larger price would be considered just too high, and would negatively affect demand for the product and, therefore, business performance.
A large body of empirical research has contributed to the estimation of hedonic price functions in analysing price drivers for many different product categories. Hedonic pricing models have been extensively used within the housing literature. These studies provide estimates of consumer valuation of environmental externalities such as air pollution (Palmquist, 1984) and public goods, such as school quality and neighbourhood amenities (Black, 1999; Bayer et al., 2007). Consumer products studied include cars (Griliches, 1961), breakfast cereal (Stanley and Tschirhart, 1991), wine (Nerlove, 1995), and personal computers (Pakes, 2003).
Without the aim of been exhaustive, several authors apply the methodology for some durable goods, like automobiles (Triplett, 1969; Murray and Sarantis, 1999; Dalen and Bode, 2004; Requena-Silvente and Walker, 2006; Matas and Raymond, 2009), computers (Dulberger, 1989; Berndt et al., 1995; Berndt and Rappaport, 2001; Pakes, 2003), PDAs (Chwelos et al., 2008), housing (Berry and Bednarz, 1975; Chinloy, 1977; Goodman, 1978; Harrison and Rubinfeld, 1978; Clapp and Giaccotto, 1998; Kim et al., 2003; Cohen and Coughlin, 2008; Hill and Melser, 2008; Gouriéroux and Laferrère, 2009; McMillen and Redfearn, 2010), mobile phones (Karato et al., 2015) or telecommunication services (Dewentet et al., 2007; Yu and Prud’homme, 2010).
Likewise, other authors also apply the hedonic methodology for nondurable goods (food industry), like breakfast cereals (Morgan et al., 1979; Stanley and Tschirhart, 1991; Shi and Price, 1998), wine (Oczkowski, 1994; Nerlove, 1995; María Angulo et al., 2000; Ortuzar-Gana and Alfranca-Burriel, 2010Oczkowski, 2015), wheat (Ahmadi-Esfahani and Stanmore, 1997), tobacco (Samikwa et al., 1998), peanuts (Moon et al., 1999) or frankfurters (Harris, 1997).
While the applicability of these pricing methods is impressively wide, we are not aware of any study that has applied them to the running shoes market. This may be due to the late development of this product category. While in the past, running shoes were a non-technical undifferentiated product, today running shoes are subject to rapid technological change and there is plenty of choice available. In recent years, there have been a large number of quality improvements in the performance and characteristics of running shoes that have boosted the demand of models targeted to specific running needs. Quality improvements can be observed in different attributes, such as comfort, cushioning, performance or duration, among others.
To the best of our knowledge, this paper is the first attempt to estimate a hedonic price model for the running shoes market. Apart from adding to existing empirical literature, our findings may have implications for different actors in the market. The model may offer a guide to consumers, manufacturers and retailers in determining the right price of the different models. We focus our analysis on the Spanish market although the models covered are identical in other countries. Our paper is also innovative with regards to the methodology employed. As is explained in the methods section, we combine hedonic pricing with frontier analysis. We are not aware of precedents of this combination in the literature. The advantage of this combination is that we are able to consider the possibility of product inefficiency in pricing. Conventional hedonic pricing, considers that prices are right for the merits of the product (apart from randomness). In our case, we explicitly account for the possibility of overpriced (inefficient) products. This combined methodology can also be applied to the study of pricing in many other product categories.
By estimating product efficiency, our results identify overpriced products and we are able to predict the magnitude of required discounts in order to reach the competitive frontier. This is the most practical result that derives from our research, and it can guide the pricing policy of manufacturers when sales are detected to be below expectations. Our results show that indeed, manufacturers are quick in discounting the products that our model identifies as more inefficient. The magnitude of the discounts also fits well with the predictions of our model. Therefore, the methodological framework proposed in this paper can be useful for manufacturers and retailers of consumer products in determining the need for additional discounts.
The remainder of this article is organized as follows. First, we describe the running market in Spain. Then we explore the relevant product attributes of running shoes, from the viewpoint of buying decisions, and propose the hypotheses to be tested. We then present the database and the statistical methodology that will be employed in the analysis. Finally, we discuss the results obtained and provide some concluding remarks.
The running market in SpainIn recent years, running has become a very popular sport in Spain, attracting devotees of different ages. It is an easy to do sport that does not need a large lump initial investment and can be enjoyed at all skill levels. Compared to other sports it is inexpensive and does not need much planning or infrastructure (you can run as you go). And, of course, it has obvious beneficial impacts on health. All these reasons explain the increasing popularity of running as a regular sport. In Spain, the running boom started approximately in 2005, as reflected by the increases in the number of participants in popular races. Running is the sport with the strongest growth rate in Spain, followed by cycling, at considerable distance. The Spanish Consejo Superior de Deportes estimates that about 40% of the Spanish population practices some sport regularly and, according to the Centro de Estudios Sociológicos (CIS), 17.1% of them choose running. The Survey of Sports Habits, elaborated by the Spanish Ministry of Education, Culture and Sports shows a higher figure.
According to the latest Survey on Sport Habits in Spain in 2015, 10.6% of the Spanish population between the age of 15 and 65 who practised some sport in the last year do running. This percentage is slightly higher than the 6.2% and 4.5% registered five and ten years earlier, respectively, and it makes running the second most important sport practised in Spain, after guided physical exercise (gym). Therefore, the growth in recent times has been notable. There are about three million runners in Spain, who practice this sport an average of two days per week. Since 2008 the number of popular races has grown by 50%, with a total of 3000 races in 2013 and more than 3300 in 2014. This is a global trend worldwide. According to the National Sporting Goods Association there were about 51 million runners in the United States at the end of 2013, of which nearly 30 million run more than 50 days a year.
The increasing success of running has had an enormous impact on the rapid development of equipment designed for this activity. Of course, running shoes are the most critical element of equipment for practicing running in a safe and healthy manner. The Spanish Society of Sports Health and the pharmaceutical company CINFA have recently elaborated a report about the habits of Spanish runners (CinfaSalud, 2017). According to this report, 90% of the runners don’t prepare appropriately for running, which explains why 61.8% has suffered muscle injuries as a consequence of improper running. Injury risk can be significantly reduced by using appropriate running shoes adapted to the particular anatomical features, technical level, objectives, and intensity of the activity. The selection of running shoes should be driven primarily by these considerations and not by fashion or aesthetics. For instance, wear patterns, including type of pronation, are important things to consider. There are specific running shoes which account for underpronation or overpronation. Cushioning and sole thickness are additional issues to consider. A heavy runner needs more cushioning than a light one. Thin soles are appropriate for high level competition, but not really for amateur training. Of course, design and price will also be elements that buyers may consider, apart from the technical features.
The economic impact of the running market is huge. More than 44 million pairs of running shoes are sold in the United States annually, about 7.5 million more than in 2010, with annual revenues of over $3040 million. According to NPD Group, the Spanish textile industry of running (which includes shoes and sports equipment) yields some €300 million turnover. Footwear for running has a turnover greater than textile, and the shoes account for most of the revenue in this sport. In 2013 sales of running shoes reached 2,274,074 pairs, which is 840,000 more than back in 1997 (these figures do not include the sales of El Corte Inglés and Decathlon, whose market share is about 16%) and this seems to be an increasing trend. Only 22.8% of them were models for women. The average price of a pair of running shoes is about EUR93.5, and 15% of the models sell at prices above EUR120. In short, running is more than sport, it is a growing market and a profitable business for sportswear manufacturers.
But, what do runners seek in a pair of running shoes? The question is more complex than it may seem at first and is a great concern for three million Spanish runners who exercise a minimum of two days per week. An understanding of the value runners associate to different shoe features is critical for manufacturers and retailers in order to meet demand requirements about product mix and quality. Is it all driven by brand image and reputation? Or do runners focus on technical features versus price relation? The answer is far from trivial. The market is highly differentiated and competitive, and doing all possible product comparisons is a hard task for customers. Furthermore, information is not perfectly available and there are processing costs.
Nelson (1970) established an influential distinction between search and experience goods. Search goods are those dominated by product features or attributes about which the customer has full information when purchasing. In contrast, information about relevant product features of experience goods cannot be learned before purchasing and using the product.1 In durable products, duration is itself an important experience attribute of the product. Running shoes are complex experience products, which quality and fit to expectations can only be assessed after use. As such, runners must seek for indicators of product performance in order to make rational buying decisions. Some relevant indicators in this process are relatively easy to learn from manufacturer's information (for instance, the cushioning, grip and lightweight). Other features are more subjective, for instance, the response, stability, duration or flexibility. In order to make sense of these features, most runners rely on recommendations and analysis from amateur users and experts. Expert evaluation of product features may be helpful and definitely constitute a relevant source of information that guides purchasing decisions in this market.
Technical attributes of running shoesQuality running shoes have become a very specialized product category that is able to keep runners safe and minimize injuries from exercising. Correct choice of footwear helps avoiding many of the potential injuries threatening runners. The need for information and product evaluation has fostered the creation of many web sites specialized in comparing running shoes on multiple features. There are also numerous blogs where professional and amateur runners test and analyze the different models of running shoes commercially available. This information contributes to make informed buying choices, based on the personal needs (physical conditions) and the type of activity to be done (intensity, surface, etc.). Running shoes have evolved over the years. What began as a comfort and a functionality matter has turned into a technological product. Innovation is crucial, since brands are constantly seeking to improve the technical features of their models. A running shoe can be divided into three parts: midsole, sole and upper. Although the running shoe must provide a high performance as a whole, each of these parts has specific functions.
The midsole is the single most important part of the running shoe, as it is the main responsible for cushioning. The sole is in permanent contact with the ground and, therefore, plays a central role in traction and durability. The material for the sole should be the lightest possible, but, at the same time, must be able to withstand the abrasion caused by the friction with the ground and provide grip enough for proper traction.
In turn, the main objectives of the upper are fastening, breathability, lightweight, comfort and stability. If the running shoes have a textile material in form of mesh is because this material is both light and breathable. However, there is a compromise between lightness and breathability on one side and setting on the other. Different manufacturers solve this trade off with different combinations of materials and technologies. The upper also provides comfort and stability, using buttresses around the heel in order to stabilize that area when hitting the ground.
The purchasing decision for experienced runners should consider the different trade-offs between the shoe's attributes, given the selling price. The main features underlying such trade-offs are lightweight, cushioning, flexibility, response, grip, stability, and brand.
Lightweight (midsole, sole and upper): Lightweight trainers are meant to be a desirable option for faster runs. They are usually lighter and sleeker than their “daily trainer” counterparts, and typically have a lower drop. This makes it easier for runners to get up on their toes to go faster, and prevents the heavy or “klutzy” feeling associated with running faster in more robust training shoes. Lightweight shoes may be used for faster paced training and are good for racing. We expect that the lighter the running shoes are the higher will be the price to pay, assuming that the remaining features remain constant. This is, ceteris paribus, lighter shoes are more valuable than heavier shoes.
Cushioning (midsole): This feature refers to the ability of the shoe to absorb shocks over the course of a run and the life cycle of the product. Models with high levels of cushioning would produce a better feeling after a long run, as compared with lower cushioning shoes, but will also tend to weight more. High cushioning may also prevent the risk of some running injuries such as shin splints, tendinitis, heel pain, stress fractures and other injuries associated to running. While some advocate for minimalist running shoes with low cushioning, the great majority of runners appreciate the advantages of good cushioning for health and comfort. Therefore, we expect that the higher the cushioning, the higher the price, all else being equal.
Flexibility (upper): Flexible trainers are more adaptable to the natural shape of the foot, providing greater dynamism and freedom of movement. This, in turn, helps running faster and more comfortably. Therefore, we expect that the greater the flexibility the higher the price, holding other features constant.
Response (midsole): Related with cushioning, the response is the ability of the material to recover its shape after deformations caused by impacting the ground. Shape recovery needs to occur fast, since there is very little time between one strike and the next. If the material is not ready on time (before impacting the ground again), then the runner will be less than full buffered. For these reasons, we expect the response level to increase the price of the shoe, ceteris paribus
Grip (sole): Grip gives runners secure footing on loose soil and rock. It is a very important element to consider in trail running shoes, but it is also relevant for other trainers. Consequently, higher grip should be reflected in a higher price, ceteris paribus
Stability (midsole and upper): Stability shoes are recommended for people who overpronate (runners whose feet tend to roll inward when running). Clearly, this feature increases the price.
Finally, runners’ perceptions about the different brands are also critical to model their willingness to pay. Brand name confers the product an implicit guarantee of quality and incorporates the image that companies build through marketing efforts such as promotion. Furthermore, a brand may be chosen simply because it helps displaying certain status to the buyer, which is known as a recognition effect. In this paper, we use the term “customer-based brand equity” to refer to the combination of these effects on the willingness to pay for branded products. Keller (1993) defines customer-based brand equity as the differential effect of brand knowledge on consumer response to the marketing of the brand. This differential effect exists when the consumer reacts differently to the branded product than to a similar (same technical features) unnamed version of the product. Customer-based brand equity can therefore have a significant effect on the willingness to pay for a product and therefore on its market price, which is independent of technical features. Therefore, it is necessary to control for the effect of brand name when estimating the drivers of product price.
We assume that buyers make purchasing decisions taking into account all the characteristics mentioned above (including brand name), in an effort to find the best quality-price relationship (i.e., product efficiency) for the shoe that best fits his or her particular needs. The idea of a best-buy frontier has been proposed in the empirical literature as a construct that reflects these quality-price relationships and allows identifying overpriced products (see González et al., 2017, for a recent example). Furthermore, most runners also rely on the information obtained from other amateur runners and expert evaluations. As this information is not immediately available, much purchasing occurs some months after the model is released. Product discounts play an important role in adjusting market prices to the competitive situation of every moment. Brands and retailers can modify prices dynamically in order to adjust the price of each product to the offer of competing products as has been documented by González et al. (2015). In this sense, overpriced products (inefficient) must obtain large discounts in order to gain market appeal. From these considerations, we introduce two hypotheses to be tested with our data:
Hypothesis 1. Price discounts will be higher for the least efficient products, ceteris paribus the brand name.
Hypothesis 2. Expert evaluations will be positively correlated with product efficiency.
In the following section we describe the methods and data used to estimate a hedonic pricing model and test Hypotheses 1 and 2.
Hedonic pricing model and dataHedonic pricing models are based on the seminal work of Lancaster (1966), who envisioned products as bundles of attributes on a quality-price space. The features of the product determine the perceived benefit for the customer (Ladd and Suvannunt, 1976) and, therefore, the willingness to pay. In our case, the price of a pair of running shoes should be in accordance with its characteristics (cushioning, lightweight, flexibility, response, grip, stability) and brand name. Hedonic models have been used most often to estimate the implicit value of the environmental amenities that drive the price of residential properties. In the same manner, they can be used to estimate the implicit value of the different attributes of a pair of running shoes. To the best of our knowledge, no previous studies have attempted such estimation.
Objective measurable attributes are the basis of hedonic pricing models. However, the price of a given product may not fully reflect the summed value of its measurable attributes. Each specific product is unique and has some features that cannot be objectively measured. Some customers may be willing to pay a higher price than the price that would be reasonable according to the bundle of objective attributes, simply because the product offers some increased status for the customer or is seen as more reliable or of higher quality (customer-based brand equity). Including brand dummies within the hedonic specification can control these effects. But there is also some random variation that may be associated with the specific design of the products, which cannot be measured and controlled objectively. And finally, some products may also be overpriced with respect to the objective features offered and brand equity simply because the going price is not the right price. Our empirical model contemplates all of these possibilities.
The basic hedonic model implies relating the price of the product to the bundle of objective attributes. A semi-log specification is usually preferred in order to increase model fit and to ease interpretation of coefficients (Bello and Moruf, 2010). The coefficients of the independent variables in a semi-log model can be interpreted as semielasticities (indicating the percentage of variation in the dependent variable per 1 unit of variation in the independent variable). To the basic model, we add the brand dummies in order to account for customer-based brand equity:
where Pik is the price of the ith model of brand k, αk is the brand effect on price of brand k, Xik is the vector of measurable attributes of model ith of brand k, β is a vector of coefficients for these attributes and eik is random error.
This basic model does not account for the possibility of some products being overpriced regardless of their features or brands. The model would only attribute that possibility to random noise. In order to account for pure product overpricing, we propose estimating a price stochastic frontier allowing for varying degrees of product efficiency. The stochastic frontier model was developed originally by Aigner et al. (1977) in the context of production efficiency estimation, but can be easily adapted to the context of product efficiency and hedonic pricing estimation. The stochastic frontier replaces the conventional error term by a composite residual. The composite error includes a random component which is normally distributed (vik) and a one-sided component (uik) which reflects the inefficiency (overprice) of the product.

The stochastic frontier is represented by:
and can be interpreted as the right (optimal) price of a product of brand k with the features Xik. The amount by which the actual price departs from the right price (excluding random error) is captured by the one-sided component uik, which is typically assumed to follow a half-normal or exponential distribution. The product efficiency index (θ) can be then computed as:

This efficiency index takes values within the (0,1] interval. When the actual price of the product is equal to the frontier price, then uik=0 and therefore the efficiency index is equal to 1. In contrast, as the actual price of the product exceeds the (frontier) predicted one, uik takes a larger value and the efficiency index is smaller. According to our hypotheses, the efficiency indexes estimated in this manner can serve to predict the dynamic adjustment in market prices2.
In order to estimate the proposed model we collected information for an exhaustive sample of running shoes commercialized in Spain in 2016. We deeply examined the information contained in the two most important search engines specialized in the analysis and comparison of running shoes: www.runea.com and www.runnics.com. The web site www.runnea.com contains information about more than 900 running shoes belonging to 31 brands.
Data about product features were collected in February 2016. However, prices were observed in two different moments of time (February 2016 and June 2016). From an initial population of nearly 900 models, we were able to complete the data on product attributes for 355 models of running shoes. Since prices are subject to time variation, we collected all the price data on the same day. This is essential in order to use comparable prices. Additionally, there was a second problem in collecting price data. Some models do not always have enough stock and offer only a few sizes, and do so at different prices. To assure comparable prices in the database, we imposed the constraint that at least 3 sizes around size 43 (the most common size) should be offered to take the model into account in the sample. Product features and prices were then collected for the 43 size. Adding these constraints reduced the valid sample to 171 models, which included products of the eight major brands of running shoes commercialized in Spain.
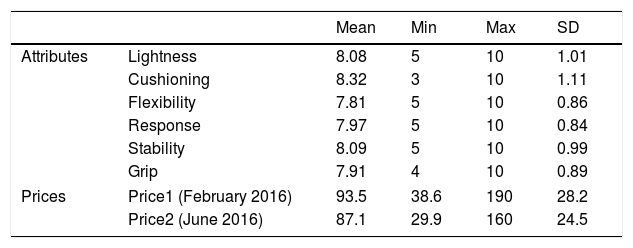
The attributes that characterize each model are Lightness, Cushioning, Flexibility, Response, Stability and Grip. All these attributes are measured in a 1–10 scale. The brands considered are Adidas, Asics, Saucony, Nike, Brooks, Mizuno, New Balance and Reebok. Table 1 shows descriptive statistics of the data:
Descriptive statistics of the data.
| Mean | Min | Max | SD | ||
|---|---|---|---|---|---|
| Attributes | Lightness | 8.08 | 5 | 10 | 1.01 |
| Cushioning | 8.32 | 3 | 10 | 1.11 | |
| Flexibility | 7.81 | 5 | 10 | 0.86 | |
| Response | 7.97 | 5 | 10 | 0.84 | |
| Stability | 8.09 | 5 | 10 | 0.99 | |
| Grip | 7.91 | 4 | 10 | 0.89 | |
| Prices | Price1 (February 2016) | 93.5 | 38.6 | 190 | 28.2 |
| Price2 (June 2016) | 87.1 | 29.9 | 160 | 24.5 | |
| Mean Price1 | Min Price1 | Max Price1 | SD Price1 | ||
|---|---|---|---|---|---|
| Brands | Adidas (28) | 99.7 | 38.6 | 180 | 37.3 |
| Asics (35) | 89.4 | 42.7 | 134.9 | 20.6 | |
| Saucony (15) | 100.7 | 76.5 | 133.9 | 14.3 | |
| Nike (25) | 105.2 | 67.0 | 190 | 33.5 | |
| Brooks (16) | 111.7 | 79.9 | 160 | 21.9 | |
| Mizuno (29) | 76.7 | 51.9 | 112.2 | 20.0 | |
| New Balance (18) | 85.4 | 52.9 | 150 | 26.4 | |
| Reebok (5) | 75.6 | 57.5 | 99 | 16.5 |
The average evaluation of the six product attributes is around 8, with standard deviations of about 1. For all the attributes there are models that obtain the maximum value 10. The minimum evaluation of an attribute is 3 for cushioning. The average price was 93.5 euros in February 2016 and had dropped to 87.1 by June. We also appreciate an important reduction in the standard deviation, which changed from 28.2 to 24.5. The maximum price also dropped from 190 to 160 during the period considered. The decreasing trend in prices was expected, since the models are the same and therefore were subjected to four months ageing. Apart from this decreasing trend in prices, we can say that there is considerable variance in the prices of the models considered, ranging between 38.6 euros to 190 in the starting period. The number of models from each brand is indicated in brackets in Table 1. Reebok is the least represented brand with only 5 models, while Asics is the best represented in the sample with 35 different models. Overall, Brooks seems to be the most expensive brand with an average price in February of 111.7 euros, followed closely by Nike, Saucony and Adidas. In contrast, Reebok is the cheapest brand followed by Mizuno, New Balance and Asics.
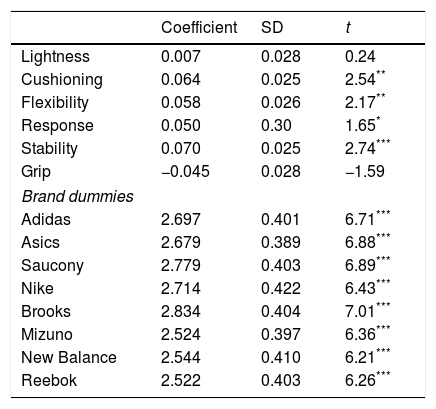
ResultsIn this section, we present the main results of the analysis performed on the data collected.3Table 2 shows the results of the frontier estimation using the prices of February 2016 (Price1).
Hedonic price model estimation.
| Coefficient | SD | t | |
|---|---|---|---|
| Lightness | 0.007 | 0.028 | 0.24 |
| Cushioning | 0.064 | 0.025 | 2.54** |
| Flexibility | 0.058 | 0.026 | 2.17** |
| Response | 0.050 | 0.30 | 1.65* |
| Stability | 0.070 | 0.025 | 2.74*** |
| Grip | −0.045 | 0.028 | −1.59 |
| Brand dummies | |||
| Adidas | 2.697 | 0.401 | 6.71*** |
| Asics | 2.679 | 0.389 | 6.88*** |
| Saucony | 2.779 | 0.403 | 6.89*** |
| Nike | 2.714 | 0.422 | 6.43*** |
| Brooks | 2.834 | 0.404 | 7.01*** |
| Mizuno | 2.524 | 0.397 | 6.36*** |
| New Balance | 2.544 | 0.410 | 6.21*** |
| Reebok | 2.522 | 0.403 | 6.26*** |
Five of the six product attributes have the expected sign (positive) and four of them (Cushioning, Flexibility, Response and Stability) are statistically significant at conventional levels. The only coefficient that is estimated with the wrong sign is for the attribute Grip. However, the coefficients of Lightness and Grip are not statistically significant and, therefore, the regression points to the inexistence of a relationship between these two features and price. As for the Grip variable, this result may be due to the fact that Grip may be relevant only for trailing shoes. As we mentioned above, the coefficients can be interpreted as semielasticities. Therefore, Stability would have the largest impact on price, followed by Cushioning, Flexibility and Response. The coefficients are not too different though (ranging from 0.50-Response to 0.70-Stability), which indicates that a combination of attributes is what drives prices and no single attribute dominates over the rest.
Regarding the brand dummies, no big differences are appreciated in the coefficients estimated. Brooks appears as the most expensive brand (ceteris paribus the shoes attributes), followed by Saucony, Nike and Adidas. Conversely, Reebok, Mizuno and New Balance are the least expensive brands. When entered individually against a common intercept, the coefficients of Brooks, Saucony, Mizuno and New Balance are statistically significant. This is, Brooks and Saucony are found to be significantly more expensive than average, while Mizuno and New Balance are found to be significantly cheaper than average (after controlling for shoes characteristics).
Average product efficiency was estimated at 0.85, which means that (on average) shoe models are 15% overpriced, which is not explained by product attributes or brand name. The largest overprice was registered for the most expensive model included in the sample, a Nike shoe that was priced at 190 euros in February. According to the frontier estimation, the right price of that model (given its characteristics and brand) should be 103.5 euros, a striking difference of 86.5 euros. Interestingly, the price of this model plummeted to 137.9 by June, thus reducing greatly its initial overprice in just four months. Indeed, the most expensive models were also the most highly overpriced. There is a 0.77 correlation coefficient between product efficiency and price.
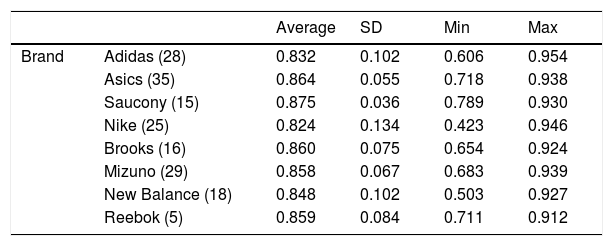
Table 3 shows descriptive statistics about product efficiency in the eight brands considered within the sample. Saucony has the highest average product efficiency, this is, the best average price-attributes relationship. It is closely followed by Asics, Brooks, Reebok and Mizuno. In contrast, Nike and Adidas are the worst brands in terms of product efficiency. Surprisingly though, the highest product efficiency is obtained for an Adidas’ trainer. The worst in terms of product efficiency is for a Nike's one.
Product efficiency per brand.
| Average | SD | Min | Max | ||
|---|---|---|---|---|---|
| Brand | Adidas (28) | 0.832 | 0.102 | 0.606 | 0.954 |
| Asics (35) | 0.864 | 0.055 | 0.718 | 0.938 | |
| Saucony (15) | 0.875 | 0.036 | 0.789 | 0.930 | |
| Nike (25) | 0.824 | 0.134 | 0.423 | 0.946 | |
| Brooks (16) | 0.860 | 0.075 | 0.654 | 0.924 | |
| Mizuno (29) | 0.858 | 0.067 | 0.683 | 0.939 | |
| New Balance (18) | 0.848 | 0.102 | 0.503 | 0.927 | |
| Reebok (5) | 0.859 | 0.084 | 0.711 | 0.912 |
It is reasonable to expect a sharp reduction in June's prices for those models that were found to be more inefficient in February. The example of the 190 euros Nike shoe points in this direction. This model scored only 0.54 in terms of product efficiency and the price had dropped to 137.9 euros by June, which implies a 27% price reduction. The least efficient model (0.423), also a Nike trainer, was priced at 140 in February and had dropped to 96.99 by June (30% reduction). Table 4 shows the results of the regression model estimating the relationship between price drop and product efficiency.
Price drop and product efficiency.
These results provide strong support to Hypothesis 1 and confirm the inverse relationship between product efficiency and price drop. The negative relationship is statistically significant at the 0.01 level. Therefore, the highest the efficiency of the product the lowest the reduction in price by the month of June. The result offers guidance as to how price reductions will unfold in the market given the product efficiency estimate from the initial market comparison. A 1% increase in product overprice (a 1% reduction in product efficiency) would induce some 0.5% reduction in product price within the following four months. With an efficiency index of 0.54, the Nike model that had a price of 190 euros in February should have reduced price by about 23%. The actual price reduction was, as we know, only slightly larger than that figure (27.8%).
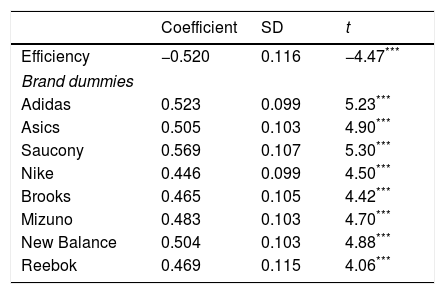
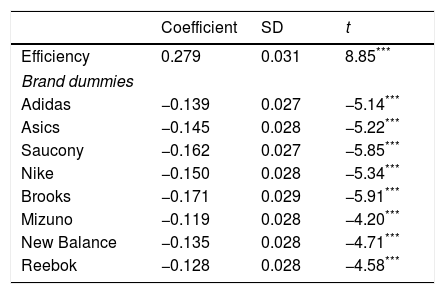
A final issue to consider is how reliable the expert overall evaluation of a running shoe is. Unfortunately, complete evaluations are not available for all the shoes in the sample, but only for a subsample of 65 models. We have regressed the expert overall evaluation against our product efficiency estimates. Results are shown in Table 5.
Expert evaluation and product efficiency.
As shown in Table 5, the results are consistent with Hypothesis 2. We observe that the coefficient of the efficiency score is positive and statistically significant at the 0.01 level. This means that the higher the efficiency of the product (i.e., the lower its overprice) the highest the overall evaluation of the expert. This means that expert evaluations can be taken as reliable indicators of product efficiency, which are based on comparing prices, brands and technical attributes. By combining Hypotheses 1 and 2, we can also expect expert evaluations to be a good predictor of future discounts in online shopping. A good expert evaluation is a credible indicator of a right price for the shoe model and, therefore, buyers should not expect large discounts in the short run. In turn, online shops may be confident that those models will only require modest discounts until more recent and technologically advanced models appear in the market. In contrast, if expert evaluations are not as good, consumers will be right if they expect heavy discounting in the short run, and shops would need to do so in order to get rid of stock of inefficient products.
As for the brands, Mizuno is the best evaluated (given its level of product efficiency) followed by Reebok, New Balance and Adidas. In contrast, experts seem to be tougher with Brooks, Saucony, and Nike. These effects are statistically significant for Brooks and Saucony (in the negative side) and for Mizuno in the positive side.
Concluding remarksThis paper investigated product efficiency in the running shoes online market and price adjustment dynamics as a function of two variables: (a) the initial level of product efficiency and (b) product evaluations made by experts. The running shoes manufacturing industry is forced to renew and improve its models constantly. This is due both to the increasing competition between brands and to the evolving demands of customers. The price that consumers may be willing to accept for a pair of running shoes depends on a set of parameters that configure the product, and by the opinions of experts and other consumers. The hedonic pricing technique is a method that allows relating the price of a good to its specifications and features. The implicit prices estimated in the hedonic function represent the willingness to pay for the different attributes that configure the product. In this paper we have been innovative by combining stochastic frontier analysis with hedonic pricing in a unified empirical model.
This paper is, to our knowledge, the first academic attempt to estimate a hedonic price function for running shoes and the first that estimates the hedonic function as a stochastic frontier. We compiled information on product attributes and market prices for a large sample of models commercialized in Spain during 2016. The main advantage of our specification of the hedonic model is that it accounts for the possibility of product inefficiency (overprice) which is not related to product attributes or randomness. We estimate a stochastic frontier capable of considering the four sources of price variation simultaneously (attributes, brand names, product efficiency and randomness). A semi-log specification was proposed and the sample contemplated some 171 running shoes models manufactured by 8 international brands and sold via online channels in Spain. The results confirm the importance of the most relevant attributes of running shoes in explaining price differentials. Among the features considered for the running shoes, four of them were found to have a strong effect on pricing: Stability, Cushioning, Flexibility and Response. An improvement in any of these attributes has a significant positive effect on price. The coefficients are similar (within the 0.5–0.7 range). Therefore, there is no single attribute dominating pricing. It is indeed the attribute mix what determines final prices. In contrast, there is no significant effect found of Lightness and Grip on prices. As for the brands, Saucony and Asics are the most efficient brands in terms of product-price relation, while Nike and Adidas are the least efficient.
An important finding of this paper is that, as we were able to confirm, the market adjusts dynamically in order to reduce price inefficiency via price adjustments. To confirm this (Hypothesis 1), we compiled price data from two different time moments during the year (February and June). We found that the least efficient trainers are the ones that show the largest reductions in prices from one month to the other. In contrast, the shoes that were closer to the product efficient frontier in February do not need to do such heavy price discounting by June. The model proposed is useful to predict the required adjustments in product prices in order to be comparatively competitive in the market, given what the other brands are offering at every moment. This is the most useful part of our model. It can be used by manufacturers to dynamically assess whether prices are right or just to high to be seen as competitive. The model results indicate the precise magnitude of discounts which are required in order to reach the efficient frontier.
Finally, we found a strong, positive, and statistically significant relationship between expert overall evaluations and our product efficiency estimates. This result validates the reliability of expert evaluations, since they correlate highly with product efficiency. As such, expert evaluations can be considered also a good predictor of short run discounts. In sum, product efficiency and expert evaluations can both be considered reliable predictors of future retail discounts. Therefore, it seems as if both sources of information may produce similar advice to prospective customers. This finding can also be interpreted as additional external support for our hedonic stochastic frontier model as a useful tool to guide consumer purchasing.
The research presented in this paper is innovative in the sense that there is no previous literature on the characteristics that determine the price of running shoes. It also shows how to combine stochastic frontier analysis with hedonic pricing estimation. This methodological extension adds the possibility of considering product inefficiency and studying its implications for product pricing. Of course, as it usually happens with novel research, there is wide margin for improvement in future research. Many interesting research questions remain unanswered. In particular, we have only used online prices. Since an important proportion of sales in this market still occurs within traditional distribution channels, an interesting issue would be to examine pricing dynamics in brick and mortar stores. While there may be important cross channel effects (Kalyanam et al., 2017), such a research can shed light on whether price adjustments are faster in online or traditional channels. A second concern with our research is that we had focus exclusively in one country. It would be interesting to replicate the estimations using global search engines covering a larger number of models, expert evaluations, purchases and consumer opinions from a greater range of countries. Finally, it is clear that this methodology can be applied to many different product categories and not only running shoes. We leave these ideas open for future research.
Disclosure statementThe authors certify that they have NO affiliations with or involvement in any organization or entity with any financial interest (such as honoraria; educational grants; participation in speakers’ bureaus; membership, employment, consultancies, stock ownership, or other equity interest; and expert testimony or patent-licensing arrangements), or non-financial interest (such as personal or professional relationships, affiliations, knowledge or beliefs) in the subject matter or materials discussed in this manuscript.
Darby and Karni (1973) added credence attributes, as those that cannot be verified even after using the product.
We also run the model without the Brand dummies. The resulting product efficiency index under this new specification obviously includes the effect of customer-based brand equity on product price. The correlation between the brand average inefficiency and the coefficients of brand dummies (as estimated in the original model) is 0.77 and may be interpreted as an indirect indicator of the relative importance of customer-based brand equity versus product efficiency. This is, 77% of unexplained overprice in the model that excludes brand dummies would be attributable to customer-based brand equity, while the remaining 23% would be truly unexplainable. Since we are interested in measuring this latter component, we maintain the brand dummies in the specification of the hedonic frontier estimated in this paper. We thank an anonymous Referee for suggesting the interest of this correlation as an indicator of the potential overprice linked to the brand.
We repeated all the estimations without the brand dummies, obtaining (qualitatively) similar results. For space concerns, we do not reproduce these results here but can be obtained from the authors upon request.