


Diverse communities of bacteria inhabit plant tissues and those bacteria play a crucial role for plant health and growth. Tree peony (Paeonia Sect. Moutan) is known for its excellent ornamental and medicinal values as Chinese traditional plant, but little is known about its associated bacterial community under natural conditions. To examine how endophytic bacteria in tree peony vary across tissues and cultivars, PCR-based Illumina was applied to reveal the diversity of endophytic bacteria in tree peony. A total of 149,842 sequences and 21,463 operational taxonomic units (OTUs) were obtained. The OTU abundance of roots was higher than leaves across other three cultivars except for ‘Kinkaku’ and ‘Luoyanghong’. The community was composed of five dominant groups (Proteobacteria, Firmicutes, Bacteroidetes, Acidobacteria and Actinobacteria) in all samples. Endophytic bacteria community structures had changed in leaves and roots. Sequences of Pseudomonas and Enterobacteriaceae were prevalent in root samples, whereas Succinivibrio and Acinetobacter were the dominant genus in leaf samples. Otherwise, the distribution of each dominant genus among the 5 cultivars was either varied. These findings suggested that both plant genotype and tissues contribute to the shaping of the bacterial communities associated with tree peony.
Endophytic bacteria are a class of microbes which resides within the interior tissues of plants without causing harm to host plants.1 They have been isolated from a broad range of plants.2 Endophytic bacteria has many kinds of biological effects, such as plant growth promoting, plant pathogens biocontrol, phytoremediation improving and many more.3–5 Endophytic bacteria have gained more and more research attention for their potential biotechnological applications in recent years.6,7 Thus, it is crucial to understand the community structure and diversity of endophytic bacteria in plant tissues. It could further contribute to understanding the significant roles of plant microbiota in supporting their multiple bioactivities.
In recent years, many researchers have focused on endophytes isolated from medicinal plants because these microbes have huge potential to synthesis of numerous novel secondary metabolic products including antibiotics, anticancer compounds, volatile organic compounds, antifungal, antiviral, insecticidal and immunosuppressant agents.8 Therefore, a better understanding of the endophyte diversity and community structure from medicinal plants may help to elucidate their function and potential role.9 China has over 5000 plants listed in its pharmacopeia at present. The endophytic communities should be studied in the important medicinally plants tissues and these microorganism may represent a relatively untapped source of novel natural products.
Tree peony (Paeonia Sect. Moutan), belonging to the section Moutan in the genus Paeonia, Paeoniaceae, have been referred to as ‘the king of flowers’ of China. Tree peony is believed to have been cultivated as ornamental and medicinal plants for over 1600 years.10 Moutan Cortex, the root bark of tree peony, is widely used in traditional medicine to treat various diseases including atherosclerosis, infection, and inflammation.11 Although interest has increased in the bacterial biodiversity associated with medicinal plants, the diversity and taxonomic composition of endophytic bacteria associated with tree peony remain unclear.
Most studies about endophytic bacterial diversity had made use of culture-dependent approaches in recent years. However, bacteria species isolated with cultivation-dependent methods can be influenced by cultivation media, growth conditions and plant tissue manipulation. Therefore, endophytic bacteria communities were analyzed based on 16S rRNA gene-based techniques such as denaturing gradient gel electrophoresis and 16S rRNA gene cloning and sequencing. Culture-independent techniques can provide a more specific, replicable and detailed description of microbial diversity.12 Our understanding of microbial diversity and function in complex environments has increased significantly, in particular the introduction of next generation sequencing (NGS). Of NGS, both Pyrosequencing and Illumina Miseq are used for characterize soils,13 oceans,14,15 mammalian gut,16 as well as the human microbiome.17 However, Illumina would enable us to perform in depth sequencing of hundreds of samples in one run at a fraction of the costs, making it an excellent tool for microbial diversity studies.
The different parameters can influence endophytic community composition of plant, such as genotype, growth stage, physiological status, tissue, environmental conditions, as well as agricultural practices. Among these factors, plant tissue and genotype may play key roles in the selection of distinct bacterial communities that associate with plants.18 The aim of the current study was to determine the endophytic bacterial community composition of different tissues and cultivars of tree peony. To that end, 10 tree peony samples were collected from Luoyang National Peony Garden, in Luoyang, China, representing root and leaf tissue of five different tree peony cultivar group. Illumina Miseq using 16S rRNA gene as the biomarker was conducted to examine the bacterial diversity of tree peony samples, to get a broader overview of the diversity and community structure of endophytic bacteria in tree peony tissues. To the best of our knowledge, this is the first report of endophytic bacterial community structure in tree peony using cultivation-independent methods.
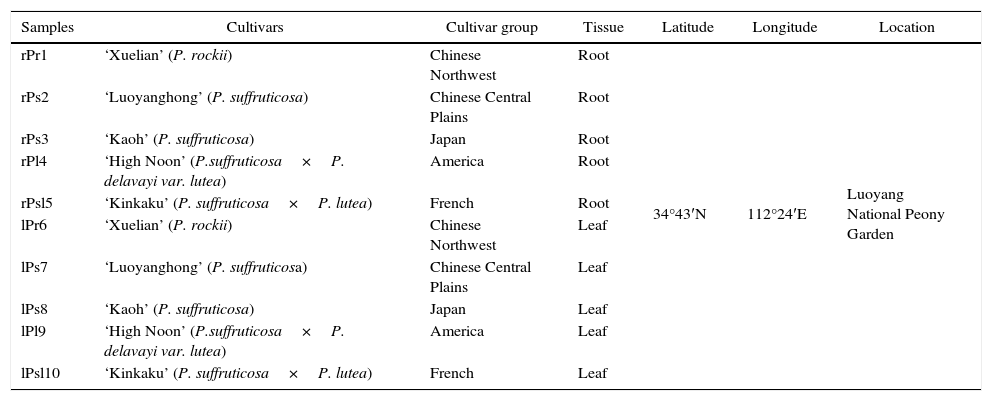
Materials and methodsPlant sampling and plant surface sterilizationTree peony samples were collected from Luoyang National Peony Garden, in Luoyang, China. The plant samples included five cultivars originated from five different tree peony cultivar group (Table 1). The plant tissues were collected randomly for each tree peony cultivar with sterile gloves in August 2014. Altogether, there are 10 samples: plants were collected from 5 cultivars of tree peony, and there are both root and leaves for each cultivar. For each sample, we collected approximately 15 plants with sterile gloves. The plant samples were randomly divided into three groups. The samples in each group (n=5) were placed in one plastic bag. All 30 plant samples were transported to the laboratory at 4°C. Each tree peony tissues were washed with tap water to remove attached clay.Plant surface sterilization included the following steps: tissue pieces were immersed in 75% ethanol for 30 s and in 20% sodium hypochlorite for 5min. After each treatment, samples were rinsed five times in sterile water. Finally, the samples were thoroughly dried in a laminar flow chamber. Efficiency of this sterilization technique was tested by wiping of sterilized tissues of each type across the surface of a trypticase soy agar (TSA) plate, which consistently yielded no bacterial colonies.
Tree peony sample codes and their origin.
| Samples | Cultivars | Cultivar group | Tissue | Latitude | Longitude | Location |
|---|---|---|---|---|---|---|
| rPr1 | ‘Xuelian’ (P. rockii) | Chinese Northwest | Root | 34°43′N | 112°24′E | Luoyang National Peony Garden |
| rPs2 | ‘Luoyanghong’ (P. suffruticosa) | Chinese Central Plains | Root | |||
| rPs3 | ‘Kaoh’ (P. suffruticosa) | Japan | Root | |||
| rPl4 | ‘High Noon’ (P.suffruticosa×P. delavayi var. lutea) | America | Root | |||
| rPsl5 | ‘Kinkaku’ (P. suffruticosa×P. lutea) | French | Root | |||
| lPr6 | ‘Xuelian’ (P. rockii) | Chinese Northwest | Leaf | |||
| lPs7 | ‘Luoyanghong’ (P. suffruticosa) | Chinese Central Plains | Leaf | |||
| lPs8 | ‘Kaoh’ (P. suffruticosa) | Japan | Leaf | |||
| lPl9 | ‘High Noon’ (P.suffruticosa×P. delavayi var. lutea) | America | Leaf | |||
| lPsl10 | ‘Kinkaku’ (P. suffruticosa×P. lutea) | French | Leaf |
About 1.5g of the surface-sterilized plant sample was frozen with liquid nitrogen and ground to a fine powder in a sterilized and precooled mortar. DNA was extracted using a Plant DNA Kit (Omega Bio-Tek, Norcross, USA) and the V3-V4 hypervariable region of the bacterial 16S rRNA gene amplified using Bac 341f (5′-CCTACACGACGCTCTTCCGATCTN-3′) and Univ 805r (5′-GACTGGAGT TCCTTGGCACCCGAGAATTCCA-3′) primers. The 50μl PCR reaction mixture contained 100ng of DNA extract, 1× Taq reaction buffer, 20pmol of each primer, 200μM each dNTP and 1.5U of Taq DNA polymerase (Sangong Biotech, China). DNA aliquots were PCR-amplified with 5min denaturation at 95°C, 30 cycles of 1min at 94°C, 50s at 55°C, and 72°C for 1min, after which a final elongation step at 72°C for 5min was performed. All samples were amplified. Replicate PCR products of the same sample were assembled within a PCR tube. Then they were visualized on agarose gels (2% in TBE buffer) containing ethidium bromide, and purified with a DNA gel extraction kit (Sangong Biotech, China). After purification, the concentration of the PCR products was measured on Qubit®2.0 Fluorometer using the PicoGreen® dsDNA quantitation assay (Invitrogen, Carlsbad, CA). DNA concentration was adjusted to 1ng/ml. The amplicon libraries were prepared by pooling 10ng of each PCR.
Processing of sequencing dataAmplicon sequencing was performed on the Illumina MiSeq platforms at Sangon Biotech (Shanghai) Co., Ltd. Raw sequence data derived from the sequencing process was transferred into FASTA files for each sample, along with sequencing quality files. Files were accessed using the bioinformatics software the Quantitative Insights Into Microbial Ecology (QIIME) where they were processed and analyzed following general procedures recommended by Caporaso.19 Briefly, sequences were denoised, and trimmed to remove barcodes and primers. Sequences representing chloroplast or mitochondrial DNA were eliminated from further analysis. The obtained sequences were assigned into operational taxonomic units (OTUs) using 97% identity clustering, and the most abundant sequence from each OUT was selected as the representative sequence for that OUT. Sequence data have been deposited in the National Center for Biotechnology Information (NCBI) Sequence Read Archive (SRA) under the accession number SRP090142.
Bacterial diversity, richness and taxonomic distribution of taxaBased on the results of OTU, bacterial taxonomy was assigned using the Ribosomal Database Project Classifier at confidence level of 80%.20 OTUs were defined at the species level (3% sequence divergence) using the Complete Linkage Clustering tool of RDP.21Alpha diversity is the analysis of species diversity in a single sample, including chao1, Shannon and the Simpson indices. Rarefaction curves were generated based on these three metrics by QIIME. Venn diagrams were employed to characterize the shared bacterial communities among all samples. For β diversity analysis, dissimilarity of bacterial communities was determined using principal component analysis (PCA) on weighted UniFrac distances among all samples. The PICRUSt software package was used to predict functional and metabolic profiles of the bacterial community based on the 16S rRNA gene sequences from each dataset.22 The taxonomic profiles were normalized by the 16S rRNA gene copy number and the functional reference profiles were computed based on 400bp reads. PICRUSt metagenome predictions were calculated.
Statistical analysisMean and standard deviation for each set of data were calculated. ANOVA was used to test the effect of ‘cultivars’ and ‘organ’ on the relative abundance of the members of the core community. One-way analysis of variance (ANOVA) was performed by SPSS (version 19.0).
ResultsAnalysis of sequencing dataAfter processing, 149,842 high quality sequences remained with an average length of 450 bases across all 10 samples. The number of retained sequences per sample varied from 6405 to 25,166. A total of 21,463 OTUs were generated after clustering at a 97% similarity level. The number of OTUs of per sample was ranging from 1152 to 3452. The rarefaction curves tended to approach the saturation plateau in all the 10 samples (Fig. 1). Rarefaction curves demonstrated that OTU abundance were diverse between different tree peony cultivars. Interesting, cultivars ‘Xuelian’ and ‘Luoyanghong’ originated in China revealed the higher number of OTUs (6602 and 5303), while cultivars ‘Kaoh’, ‘High Noon’ and ‘Kinkaku’ introduced from Japan, American and French showed the lower richness, with 3261, 3726 and 2571 OTUs, respectively (Table 2). The OTU richness assessed from root and leaf tissues of five cultivars showed slightly difference. Except the cultivar ‘Kinkaku’ and ‘Luoyanghong’, the OTU abundance of root tissues was higher than leaf tissues across other three cultivars (Table 2). According to the results of Venn analysis, consistent overlap patterns of OTU clusters among different samples were obtained (Fig. 2). For endophytic bacteria, root samples and leaves samples harbored 1567 and 2658 unique OTUs, respectively, while sharing 3931 OTUs. Moreover, in root samples, rPr1, rPs2, rPs3, rPl4 and rPsl5 harbored 1523, 472, 182, 579 and 54 unique OTUs, respectively, while they shared 276 OTUs. lPr6, lPs7, lPs8, lPl9 and lPsl10 harbored 1162, 1395, 439, 525 and 273 unique OTUs, respectively, while they shared 279 OTUs. The result showed that the number of shared and unique OTUs was different in tree peony samples and the distribution of OTUs was influenced by plant tissues and cultivars.

Number of OUTs and Alpha diversity of endophytic bacteria in tree peony.
| Samples | Number of sequences | Observed OTUs | Alpha diversity | ||
|---|---|---|---|---|---|
| Chao1 | Shannon | Simpson | |||
| rPr1 | 23,571 | 3452 | 3641.34 | 8.79 | 0.98 |
| rPs2 | 10,993 | 1917 | 2549.91 | 7.74 | 0.97 |
| rPs3 | 10,755 | 1721 | 2462.44 | 7.99 | 0.97 |
| rPl4 | 9008 | 2118 | 2961.33 | 8.65 | 0.98 |
| rPsl5 | 9902 | 1152 | 1373.30 | 6.85 | 0.95 |
| lPr6 | 22,517 | 3150 | 3316.65 | 8.12 | 0.96 |
| lPs7 | 25,166 | 3386 | 3378.13 | 8.40 | 0.96 |
| lPs8 | 11,284 | 1540 | 1722.25 | 9.04 | 0.99 |
| lPl9 | 20,241 | 1608 | 1620.18 | 7.50 | 0.97 |
| lPsl10 | 6405 | 1419 | 2215.33 | 7.77 | 0.96 |

The Alpha diversity estimation demonstrated that the diversity of endophytic bacteria is abundant in tree peony (Table 2). Higher Shannon and Chao 1 indices indicated that the bacterial community diversity of tree peony tissues. The results suggested that these libraries detected a large majority of the endophytic bacterial diversity in the samples used in our study.
Taxonomic composition analysisAll sequences were classified from phylum to genus according to the program QIIME using the default setting. The sequences were classified into 32 different phyla, 75 classes, 156 orders, 292 families, and 542 genera. The overall bacterial composition of the different samples was similar, while the distribution of each phylum varied in all samples. Proteobacteria, Firmicutes, Bacteroidetes, Acidobacteria and Actinobacteria were the five most dominant phyla, accounting for 86.00% of the reads, while the remaining 14% involved twenty-seven very low-abundant phyla (Fig. 3). Proteobacteria were the most abundant division, comprising approximately 42.40–64.70% reads across all samples, whereas the members from Firmicutes, Bacteroidetes, Acidobacteria and Actinobacteria made up 17.60%, 6.50%, 5.30% and 4.60% of the whole libraries respectively. In the root endophytic communities, sequences assigned to Proteobacteria (54.20%), Acidobacteria (5.60%) and Actinobacteria (5.30%) were more abundant compared to leaf samples. In the leaf endophytic communities, sequences assigned to Firmicutes (14.30%) and Bacteroidetes (5.90%) were more abundant compared to root samples (Fig. 3). The average reads of NA (No_rank) group accounts for 0.70%, but fluctuates in different samples.
.")
We notice that predominance at the phylum and class level is driven by the high abundance of several OTUs. For example, Gammaproteobacteria were dominant in the root and leaf community due to the large number of sequences of Aeromonadales, Enterobacteriales and Pseudomonadales. Similarly, Firmicutes were mostly represented by the OTUs, Clostridiales and Bacillales. The phylum Bacteroidetes is mainly represented by sequences belonging to 2 OTUs: Bacteroidales and Saprospirales. The Actinobacteria were mostly represented by the OTUs Actinomycetales. Therefore, the dominant orders were Aeromonadales, Enterobacteriales, Pseudomonadales, Clostridiales, Bacteroidales, Bacillales, Lactobacillales, Rhizobiales, Sphingomonadales and Burkholderiales in all the samples. For each dominant order, its distribution among the ten samples was either varied or consistent. For each sample, percentages of these orders were highly diversified (Fig. 4).
Core genera distribution.")
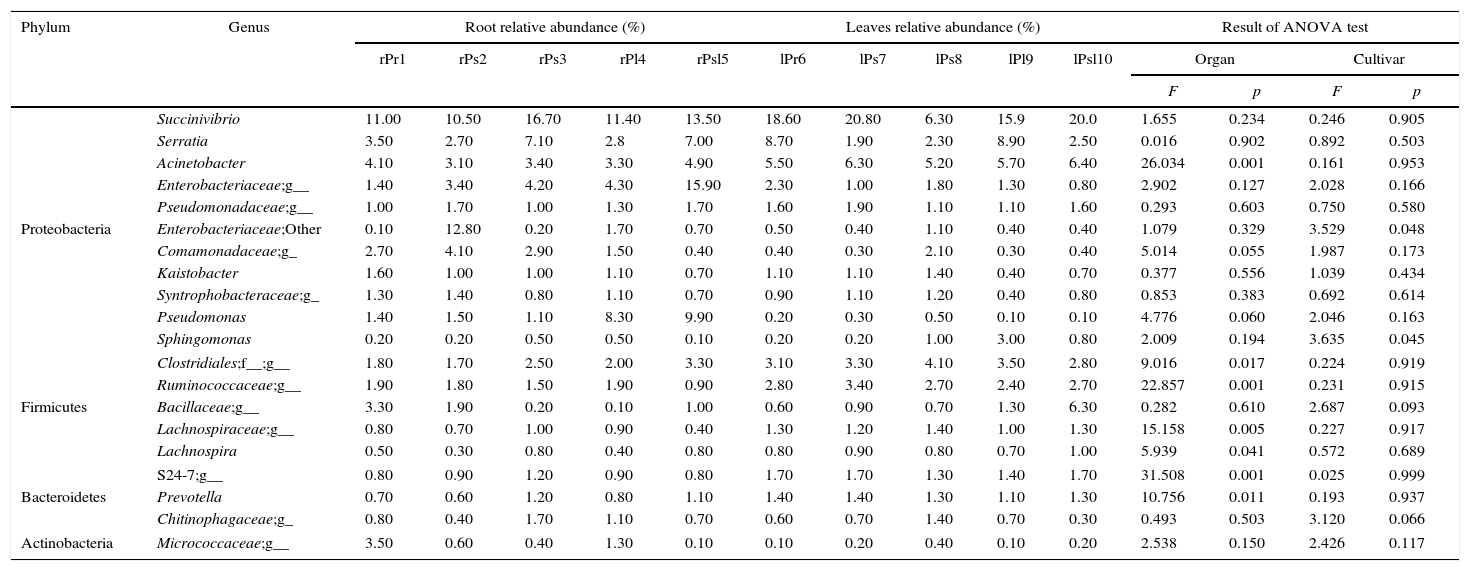
Among the 542 defined OTUs across all the samples at the genus level, a core root and leaf endophytic microbiome was observed. Our data reveals that all 67 (12.36%) detected genera were shared by all the samples, other genera were not detected in all samples. For example, Streptomyces can be detected in root, which was not detected in leaf, while Methylobacterium can be detected in leaf, which was not detected in root. Burkholderia only was detected in cultivars ‘Kaoh’ root and leaf (Supplementary Table S1). The top 20 core genera (with minimum relative abundance 0.2%) contributed the most to community abundance among all ten samples were listed in Table 3. It was worth noting Succinivibrio was the most predominant genus in the leaf and endophytic communities, with relative abundance ranging from 6.30% to 20.80%.
The relative abundance of top 20 core genera in each sample.
| Phylum | Genus | Root relative abundance (%) | Leaves relative abundance (%) | Result of ANOVA test | |||||||||||
|---|---|---|---|---|---|---|---|---|---|---|---|---|---|---|---|
| rPr1 | rPs2 | rPs3 | rPl4 | rPsl5 | lPr6 | lPs7 | lPs8 | lPl9 | lPsl10 | Organ | Cultivar | ||||
| F | p | F | p | ||||||||||||
| Proteobacteria | Succinivibrio | 11.00 | 10.50 | 16.70 | 11.40 | 13.50 | 18.60 | 20.80 | 6.30 | 15.9 | 20.0 | 1.655 | 0.234 | 0.246 | 0.905 |
| Serratia | 3.50 | 2.70 | 7.10 | 2.8 | 7.00 | 8.70 | 1.90 | 2.30 | 8.90 | 2.50 | 0.016 | 0.902 | 0.892 | 0.503 | |
| Acinetobacter | 4.10 | 3.10 | 3.40 | 3.30 | 4.90 | 5.50 | 6.30 | 5.20 | 5.70 | 6.40 | 26.034 | 0.001 | 0.161 | 0.953 | |
| Enterobacteriaceae;g__ | 1.40 | 3.40 | 4.20 | 4.30 | 15.90 | 2.30 | 1.00 | 1.80 | 1.30 | 0.80 | 2.902 | 0.127 | 2.028 | 0.166 | |
| Pseudomonadaceae;g__ | 1.00 | 1.70 | 1.00 | 1.30 | 1.70 | 1.60 | 1.90 | 1.10 | 1.10 | 1.60 | 0.293 | 0.603 | 0.750 | 0.580 | |
| Enterobacteriaceae;Other | 0.10 | 12.80 | 0.20 | 1.70 | 0.70 | 0.50 | 0.40 | 1.10 | 0.40 | 0.40 | 1.079 | 0.329 | 3.529 | 0.048 | |
| Comamonadaceae;g_ | 2.70 | 4.10 | 2.90 | 1.50 | 0.40 | 0.40 | 0.30 | 2.10 | 0.30 | 0.40 | 5.014 | 0.055 | 1.987 | 0.173 | |
| Kaistobacter | 1.60 | 1.00 | 1.00 | 1.10 | 0.70 | 1.10 | 1.10 | 1.40 | 0.40 | 0.70 | 0.377 | 0.556 | 1.039 | 0.434 | |
| Syntrophobacteraceae;g_ | 1.30 | 1.40 | 0.80 | 1.10 | 0.70 | 0.90 | 1.10 | 1.20 | 0.40 | 0.80 | 0.853 | 0.383 | 0.692 | 0.614 | |
| Pseudomonas | 1.40 | 1.50 | 1.10 | 8.30 | 9.90 | 0.20 | 0.30 | 0.50 | 0.10 | 0.10 | 4.776 | 0.060 | 2.046 | 0.163 | |
| Sphingomonas | 0.20 | 0.20 | 0.50 | 0.50 | 0.10 | 0.20 | 0.20 | 1.00 | 3.00 | 0.80 | 2.009 | 0.194 | 3.635 | 0.045 | |
| Firmicutes | Clostridiales;f__;g__ | 1.80 | 1.70 | 2.50 | 2.00 | 3.30 | 3.10 | 3.30 | 4.10 | 3.50 | 2.80 | 9.016 | 0.017 | 0.224 | 0.919 |
| Ruminococcaceae;g__ | 1.90 | 1.80 | 1.50 | 1.90 | 0.90 | 2.80 | 3.40 | 2.70 | 2.40 | 2.70 | 22.857 | 0.001 | 0.231 | 0.915 | |
| Bacillaceae;g__ | 3.30 | 1.90 | 0.20 | 0.10 | 1.00 | 0.60 | 0.90 | 0.70 | 1.30 | 6.30 | 0.282 | 0.610 | 2.687 | 0.093 | |
| Lachnospiraceae;g__ | 0.80 | 0.70 | 1.00 | 0.90 | 0.40 | 1.30 | 1.20 | 1.40 | 1.00 | 1.30 | 15.158 | 0.005 | 0.227 | 0.917 | |
| Lachnospira | 0.50 | 0.30 | 0.80 | 0.40 | 0.80 | 0.80 | 0.90 | 0.80 | 0.70 | 1.00 | 5.939 | 0.041 | 0.572 | 0.689 | |
| Bacteroidetes | S24-7;g__ | 0.80 | 0.90 | 1.20 | 0.90 | 0.80 | 1.70 | 1.70 | 1.30 | 1.40 | 1.70 | 31.508 | 0.001 | 0.025 | 0.999 |
| Prevotella | 0.70 | 0.60 | 1.20 | 0.80 | 1.10 | 1.40 | 1.40 | 1.30 | 1.10 | 1.30 | 10.756 | 0.011 | 0.193 | 0.937 | |
| Chitinophagaceae;g_ | 0.80 | 0.40 | 1.70 | 1.10 | 0.70 | 0.60 | 0.70 | 1.40 | 0.70 | 0.30 | 0.493 | 0.503 | 3.120 | 0.066 | |
| Actinobacteria | Micrococcaceae;g__ | 3.50 | 0.60 | 0.40 | 1.30 | 0.10 | 0.10 | 0.20 | 0.40 | 0.10 | 0.20 | 2.538 | 0.150 | 2.426 | 0.117 |
‘g__’ represents genus not grouped into any known genera within these families/groups; ‘Other’ represents other genus within these families/groups.
Core endophytic microbiome for tissue of host plants was also explored. The relative abundance of core genera strongly differed between the root and leaf tissue of tree peony. The relative abundance of Acinetobacter, unknown genus from Clostridiales, other genus from Ruminococcaceae, unknown genus from Lachnospiraceae, Lachnospira and Prevotella were significantly differences in roots compared with leaves (p=0.001; p=0.017; p=0.001; p=0.005; p=0.041; p=0.011). We also analyzed the core endophytic microbiome for each sample at the genus level. The results showed that the distribution of each dominant genus among the ten samples was either varied or consistent, and percentages of these genera were highly diversified for each sample. Succinivibrio (11.00%) was the most abundant genus followed by Acinetobacter (4.10%) and Serratia (3.5%) in ‘Xuelian’ roots. In ‘Luoyanghong’ roots, Enterobacteriaceae (12.80%), Succinivibrio (10.50%) and while in the culitivar ‘Kinkaku’ roots, Enterobacteriaceae (15.90%), Succinivibrio (13.50%), Pseudomonas (9.90%) and Serratia (7.00%) were the dominant genus or families. The relative abundance of the same genus was significant difference between the samples. For example, Pseudomonas was much more enriched in the ‘Kinkaku’ and ‘High noon’ roots, and the relative abundance reached to 9.90% and 8.30% of the reads, respectively, while the average abundance in the other eight samples was ≤1.5%. The relative abundance of Sphingomonas was 3.00% in ‘High noon’ leaf, while the abundance of the other samples varied from 0.10% to 1.00%. The relative abundance of Enterobacteriaceae and Sphingomonas were significantly differences in different tree peony cultivars (p=0.048; p=0.045).
Organ and cultivars type differentiate communitiesCore genera distribution results indicated the presence of diverse endophytic bacteria in leaf and root of tree peony, and the relative abundance of the same core genus was difference in different cultivars of tree peony. To further elucidate the microbial population correlates with the tissues and cultivars of tree peony, Principal component analysis (PCA) was used to illustrate the extent of variation of endophytic bacteria population in the different samples. Data are presented as a 2D plot to better illustrate the relationship. PCA (Fig. 5) identified two principal component factors (PCF) in relation to percentage abundance of groups, explaining 30.5% and 27.1% of the variation, respectively. The PCA analysis revealed that tissue was a strong interpretive factor for the variation in community composition of endophytes of tree peony. Root samples had a significantly higher PC1 value (except for rPsl5), and leaf samples had a higher PC2 value (except for lPs8). The first principal coordinate separated the samples based on the cultivars, the sample rPs2, rPs3 and rPl4 were relatively similar, which the sample lPr6, lPs7 and lPsl10 were relatively similar. The sample rPsl5 and lPs8 clearly separated from the other samples along PC1, which showed an obvious difference about bacteria community composition among cultivar of tree peony. It indicated that the cultivar was also a factor to shape the community composition.
Predictive metagenome analysis were plotted and represented 57.6% of whole inertia.")
PICRUSt approach was applied to infer the metagenomic content of the samples, and to evaluate the functional potential of the bacterial community's metagenome from its 16S profile. Based on the predicted metagenomes, 47 of level 3 KEGG Orthology (KO) groups were found and the gene families belonging to amino acid metabolism, energy metabolism, Two-Component System and bacterial motility protein were identified as the major gene families (Fig. 6). Similarly to the phylogenetic beta-diversity, the tissues of tree peony represented a strong structuring factor for constructed functional. In contrast, by PICRUSt inference, the functional abundance of ‘amino acid metabolism’, ‘gluconeogenesis’, ‘photosynthesis’ were significantly greater in leaves tissues than roots tissues of tree peony, while the abundance of ‘Two-Component System’, ‘Bacterial motility proteins’, ‘flagellar assembly’ and ‘secondary metabolite biosynthesis’ were greater in roots tissues of tree peony.
Discussion
This study was under taken to explore the endophytic bacteria diversity in root and leaf of tree peony in Luoyang city. Using Illumina sequencing of the V3-V4 hypervariable region of bacterial 16S rRNA genes and metagenomic library analysis, we observed conspicuous differences in endophytic bacterial community structure of different tissues and cultivars of tree peony. To our knowledge, this is the first implementation of PCR-based Illumina Miseq technology for investigating the diversity of endophytic bacteria in tree peony tissues.
The capacity of the Illumina platform to generate enormous data sets is undoubtedly an advantage.23,24 The most heavily sequenced members of the bacterial communities associated with tree peony roots and leaves were related to described species, 83% of our sequences could be assigned at the genus level. Our ability to assign sequences at the genus level is higher than results obtained in a pyrosequencing study of Arabidopsis thaliana rhizosphere and phyllosphere (60%).25 The rarefaction curve also tended to plateau, suggesting the library was large enough to reflect the endophytic bacterial diversity of tree peony.
Proteobacteria, Firmicutes, Bacteroidetes, Acidobacteria and Actinobacteria were the five most abundant phyla associated with tree peony, all phyla that are typical of the root and leaf endophytic bacteria,26–28 suggesting substantial overlap in the key community members across host species. However, there are many bacterial groups common on other hosts that we did not observe on tree peony. For example, the roots of Spartina alterniflora and Kandelia obovata were heavily populated by Cyanobacteria,29 this phylum was not existed in all samples. Gammaproteobacteria was the most abundant class of Proteobacteria in the leaf endophytic community, which was consistent with other studies.30,31 Moreover, we did not observe many sequences for Erwinia, Pantoea and Xanthomonas, which were abundant in the four kinds of commercial salad leaf vegetables. On the other hand, Succinivibrio was the most abundant genus in the tree peony roots and leaves, which was not present in other kinds of plant investigated in the literature. Succinivibrio is an anaerobic, Gram-negative, curved, spiral bacillus with a polar, were thought to occur as organisms in the rumens of herbivorous animals.32 More research is required to elucidate why this genus is abundant in tree peony tissues.
Comparison of the communities associated with the leaves and roots reveals both ubiquitous and organ specific groups. Serratia was most abundant genus in both root and leaf associated communities, which has been isolated from a variety of plant samples and is widely known for their plant growth promoting (PGP) and biocontrol qualities as well as for their endophytic lifestyle.33Acinetobacter, a common soil bacterium, could colonize plants by their roots and multiply extensively in the pathogen-infected tissues.34Enterobacteriaceae, Pseudomonas, Comamonadaceae sequences are common in all ten sample types, but they are most abundant in the root endophytic community. It has been previously observed that, in many cases, Pseudomonas and members of Enterobacteriaceae are abundant in both the soil environment and the plant interior.35–37 This suggests some of the taxa found in root of tree peony may come from soil. A previous study reported that Pseudomonas was abundant on rhizosphere of tree peony based on culture-dependent method, suggesting soil microorganism or rhizospheric species are the main sources of tree peony endophytes.38 Otherwise, leaves and roots of tree peony are colonized by some of the same genera, albeit in different proportions. This suggests that some endophytic bacteria species can migrate from roots to leaves.
The core bacterial community may be important in maintaining essential functions. When comparing the predicted functions of the core community to the entire community, we found that the functions are highly correlated. Acinetobacter, Enterobacteriaceae and Pseudomonas were most abundant in the root endophytic community. As the main sources of tree peony endophytes, PICRUSt analysis also showed ‘Two-Component System’, ‘Bacterial motility proteins’ and ‘flagellar assembly’ were more relative abundance in root tissues. Bacterial Two-component signal transduction systems are widespread in prokaryotes and play extensive roles in adaptation to environmental changes, which is very important for endophytic plant colonization.39 Cell motility might be important in plant invasion and in the spreading of endophytic microorganisms throughout plant organs and tissues.40 Otherwise, the results showed bacterial auxin phytohormone indole-3-acetic acid (IAA) synthesis and siderophore production plays a key role in plant growth promoting traits and it is necessary for efficient rhizosphere colonization.41 In our experiment, the production of indole-3-acetic acid, isoquinoline alkaloid, and siderophore production also showed the beneficial interaction between endophytes and tree peony. This suggests that the core community is responsible for functions that are important for the endophytes symbiosis to persist.
Plant-associated habitats are dynamic environments in which many factors affect the species compositions of microbial communities. A variety of reports indicate that structure of endophytic community is influenced by abiotic and biotic factors such as environment conditions and host genotype. The host plant genotype is one of the major influencing factors. For instance, Adams and Kloepper investigated the impact of cotton plant genotype on the inherent bacterial population of their seeds, seedling stems and root tissues. They found that the distinct genetic, morphological and physiological characteristics of individual cotton cultivars led to differences in the endophytic bacterial community structure among the cultivars.42 The diversity of bacterial communities associated with rice roots across 10 cultivars was investigated. The results indicated that different rice cultivars select specific fractions of the bacterial communities in sometimes highly different and at other times similar ways. That is, rice genotype determined, to a large extent, the composition of the different bacterial communities across cultivars.43 In our study, we present a survey of 5 tree peony cultivars, in which endophytic bacterial communities associated with roots and leaves were assessed. Our results indicated that different tree peony cultivars had some differences in the densities of endophytic microbial communities. For example, roots samples of China cultivars had the higher number of OTUs than introduced cultivars. Thus, it is possible that China cultivars have a better adaptability to the local environment conditions and have form more mutualistic associations between plant and bacteria. Furthermore, we found noticeable differences in endophytic bacterial communities across 5 tree peony cultivars. For example, Pseudomonas was much more enriched in the ‘Kinkaku’ and ‘High noon’ root than other samples. These results suggest that ‘Kinkaku’ and ‘High noon’ selectively recruited and promoted the growth of certain Pseudomonas in its root interior. The basis for the differences between cultivars is not clear. It is also likely that cultivar-specific root exudates may be shaping the endophyte community. Root exudates would alter the microbial community in intimate contact with plant roots. It is worth mentioning that the root bark of tree peony can produce some chemical material such as paeonol and paeoniflorin.44 The root exudates chemical composition and proportion can influence the composition of endophytic community across 5 tree peony cultivars. Otherwise, 5 tree peony cultivars which had different genetic and morphological physiological characteristic, which may thus affect bacterial spectra. Based on our results, we hypothesize that root exudates and genetic characteristics may result in distinct changes in endophytic bacterial populations of tree peony.
ConclusionsIn summary, the diversity of endophytic bacteria was high in tree peony. The community of endophytic bacteria showed obvious changes in different tissues and cultivars. The host genotypes determine the endophytic bacterial community. Further studies are needed to understand the mechanisms of the interactions between root exudates and endophytic community. Otherwise, the endophytic bacterial functional diversity will be further studied in tree peony to lay the foundation for application of tree peony endophytes.
Conflicts of interestThe authors declare that they have no conflicts of interest concerning this article.
This work was supported by the National Natural Science Foundation of China (Grant No. 31500008), and the Project of Science and Technology Department (Grant No. 152102210328) and Education Department (Grant No. 14A180024) of Henan Province. The authors greatly appreciate the support provided by National Peony Garden of Luoyang city in China.