


The main objective of this study was to evaluate the anaerobic conversion of vinasse into biomethane with gradual increase in organic loading rate (OLR) in two upflow anaerobic sludge blanket (UASB) reactors, R1 and R2, with volumes of 40.5 and 21.5L in the mesophilic temperature range. The UASB reactors were operated for 230 days with a hydraulic detection time (HDT) of 2.8d (R1) and 2.8–1.8d (R2). The OLR values applied in the reactors were 0.2–7.5gtotalCOD (Ld)−1 in R1 and 0.2–11.5gtotalCOD (Ld)−1 in R2. The average total chemical oxygen demand (totalCOD) removal efficiencies ranged from 49% to 82% and the average conversion efficiencies of the removed totalCOD into methane were 48–58% in R1 and 39–65% in R2. The effluent recirculation was used for an OLR above 6gtotalCOD (Ld)−1 in R1 and 8gtotalCOD (Ld)−1 in R2 and was able to maintain the pH of the influent in R1 and R2 in the range from 6.5 to 6.8. However, this caused a decrease for 53–39% in the conversion efficiency of the removed totalCOD into methane in R2 because of the increase in the recalcitrant COD in the influent. The largest methane yield values were 0.181 and 0.185 (L) CH4 (gtotalCOD removed)−1 in R1 and R2, respectively. These values were attained after 140 days of operation with an OLR of 5.0–7.5gtotalCOD (Ld)−1 and totalCOD removal efficiencies around 70 and 80%.
Ethanol is the world's most widely used biofuel.1 The global production of ethanol in 2011 was 86.1 billion liters, of which the US and Brazil contributed 62.7% and 24.4%, respectively.2
Vinasse is the final residue obtained during ethanol production by fermentation of sugarcane.3 For one liter of ethanol produced from sugarcane is estimated to output 8–18L of vinasse.4 The vinasse leaves the distillation column with a temperature of about 90°C and pH between 3 and 4. It constitutes 94–97% water, Mg2+, Ca2+, K+, melanoidins, and residual amounts of sugar, alcohol, and volatile components such as chloroform, pentachlorophenol, phenol, and methylene chloride, and the amount of these substances depends on the feedstock and the process of ethanol production.4,5 The España-Gamboa et al.,6 reported the presence of antibacterial components and heavy metals in vinasse. Approximately 75% of suspended solids present in vinasse are organic and biodegradable,7 which provides a high chemical and biochemical oxygen demand (COD and BOD) of up to 100gL−1 and 60gL−1, respectively.3,8
In Brazil, vinasse is mainly used in fertigation of sugarcane in adjacent areas of ethanol production industries because of its high organic matter and nutrient contents.6 However, studies suggest that the application of vinasse indiscriminately in soil could contaminate surface water and groundwater.9
In addition, the anaerobic digestion of vinasse may be utilized for stabilization of organic material and methane production, which can be used to produce energy required for drying yeast in distillery.8 During the anaerobic digestion of vinasse, most of the organic matter is removed, leaving the recalcitrant organic compounds and most of the nutrients in the effluent.5
The higher temperature of vinasse promotes thermophilic anaerobic digestion. However, in some industries, the systems that utilize the thermal energy of vinasse are currently being installed. This makes the topic of mesophilic anaerobic digestion interesting,10 and studies have shown its advantage over thermophilic anaerobic digestion in terms of imparting greater stability.7
Currently, the upflow anaerobic sludge blanket (UASB) reactor is the most widely used reactor for the treatment of vinasse obtained from the ethanol industry.11 Low sludge production and the conversion of approximately 50% of the total chemical oxygen demand (totalCOD) of vinasse to biogas have couples of advantages of using the UASB reactor.6 The design of the reactor is quite simple and does not require sophisticated equipment.12 This enables the use of UASB technology for treating industrial waste such as vinasse.
In the UASB reactors, the microorganisms are mainly grouped into granules and flocs formed by self-aggregation of bacteria and archaea. These formations greatly depend on the upflow and composition of wastewater. The granules are compact clusters that possess high specific methanogenic activity and sedimentation. They accumulate in large quantities in the fermentation chamber of UASB reactor.12
For efficient methane production from vinasse, strategies need to be developed for startup and maintenance of the anaerobic microbiota. High concentrations of phenolic compounds, such as melanoidins, present in the vinasse,9 heavy metals, and antibacterials used in the treatment of yeast may decrease and even inhibit the microbial activity.13
The startup time of the anaerobic reactor without adapted sludge inoculum can be up to 40% higher than that of a reactor with the use of adapted sludge.6
Within this context, this study aims to assess the startup and stabilization of the anaerobic conversion of vinasse to methane with gradual increase of organic loading rate in UASB reactors.
Materials and methodsReactor configurationThe experimental unit consisted of two bench-scale UASB reactors (R1 and R2) of capacity 40.5L and 21.5L, respectively (Figure 1). The reactors R1 and R2 have five and four sludge collection points, respectively, distributed along the height of the reactors (97.8 and 108.5cm, respectively, Figure 1). In R1, the sludge collection points P1, P2, P3, P4, and P5 are located at 5, 23.5, 37.4, 51.9, and 65.7cm from the base of the reactor. In R2, the sludge collection points P1, P2, P3, and P4 are located at 5, 25, 40.9, and 71.8cm from the base of the reactor.
Inoculum and influent characteristics reactors (R1 and R2).")
For the UASB reactor startup, the inoculum was granulated sludge from the UASB reactor used to treat swine wastewater. The inoculum sludge had total (TS) and volatile (VS) solid concentrations of 45.6gL−1 and 30.4gL−1, respectively. The volume of the sludge used was sufficient to occupy 30% of the volume of each reactor.
The influent used to feed the UASB reactors was obtained from in natura vinasse from a sugarcane plant in Ribeirão Preto, SP. The vinasse was collected weekly, from April to December 2012, after distillation in the wine columns, cooled down, and kept chilled.
The concentrations of totalCOD, TS, VS, Kjeldahl N, totalP, K, Ca, Mg, Na, Fe, Mn, Zn, and Cu were determined for characterization of vinasse.14 The concentrations of totalCOD, ST, and SV were 45,000; 41,300 and 31,800mgL−1, respectively. The Kjeldahl N and total P, K, Ca, Mg, Na, Fe, Mn, Zn, and Cu concentration were 470, 170, 88, 3.2, 1.4, 20.4, 24.6, 2.44, 0.78, and 0.21mgL−1, respectively.
A totalCOD of about 45,000mgL−1 was necessary to dilute the vinasse and gradually increase the totalCOD of the influent, consequently increasing the OLR in the UASB reactors. Initially, vinasse was diluted with water, and subsequently, the effluent from the UASB reactors was recirculated. Recirculation of the effluent allows limited use of dilution water and alkalizing as well as reuse of nutrients remaining in the effluent.
Operating conditions of the reactorsThe R1 was operated with a hydraulic detention time (HDT) of 2.8d, while R2 was first operated with an HDT of 2.8d for 219 days and then decreased to 1.8d. The HDT was decreased to obtain a gradual increase in OLR. The OLR was calculated by dividing the totalCOD of the influent by HDT.
The upflow velocity in the reactors R1 and R2 were similar, 0.019mh−1 and 0.018mh−1, respectively. The surface loading rates in the settlers of the UASB reactors were 0.011mh−1 (R1) and 0.014mh−1 (R2). With the decrease in HDT for R2, the upflow velocity and the surface loading rate in the settler of the UASB reactor increased to 0.028mh−1 and 0.022mh−1, respectively.
Although the reactors had different dimensions, they were assumed to be identical, and the same operational conditions (HDT, OLR, alkalizing, and recirculation) were applied. This consideration allowed us to assess the effects of the variables by maintaining one reactor in a normal stable condition while the other was being subjected to new operational conditions.
The OLR was increased from 0.2 to 7.5gtotalCOD (Ld)−1 in R1 and from 0.2 to 11.5gtotalCOD (Ld)−1 in R2 (Figure 2). The OLR was gradually increased to adapt the inoculum sludge and to obtain stability with higher OLR.
−1) and pH adjustment in UASB reactors (R1 and R2) for vinasse treatment.")
The mean pH value of the in natura vinasse was 4.5. Therefore, it was necessary to correct the pH of the influent to approximately 7.0. Until 158 and 172 days of operation of R1 and R2, respectively, pH of the influent was corrected by adding a solution of 12M NaOH. After this period, use of NaOH was discontinued and the effluent was recirculated, utilizing the alkalinity generated in the reactors for pH correction (Figure 2). Effluent recirculation in R1 and R2 was started with an OLR of 6 and 8gtotalCOD (Ld)−1, respectively.
The totalCOD, Kjeldahl nitrogen (KN), and totalP found in in natura vinasse were 45,000; 470mgL−1 and 62mgL−1, respectively. These values did not correspond to the recommended minimum proportion of COD:N:P=350:5:1 for proper microbial growth.15 For supplemental phosphorus and nitrogen, potassium phosphate monobasic (KH2PO4) and urea (CH4N2O) were added to vinasse.16
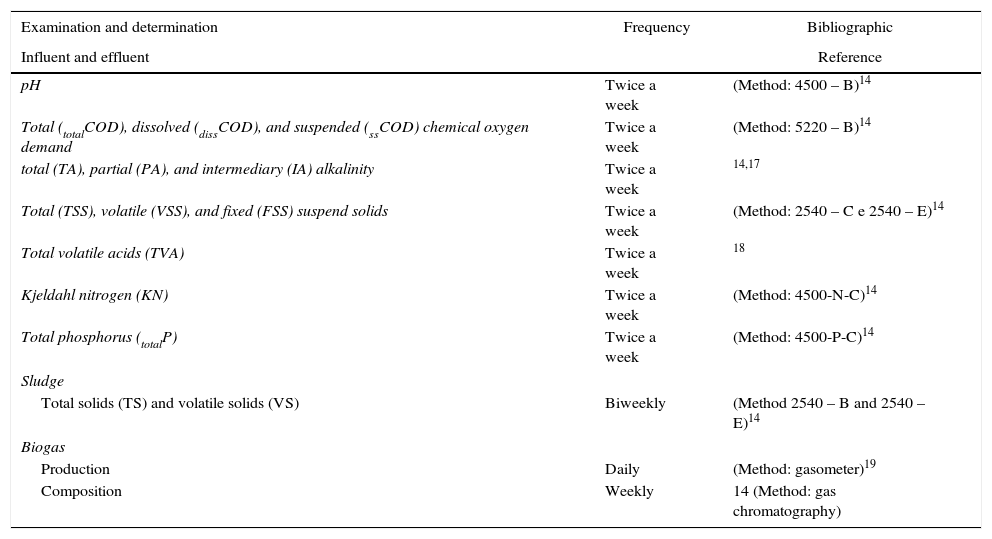
Analytical methodsTable 1 shows the physical examinations and organic and inorganic constituents determination methods adopted for the samples of influents, effluents, sludge, and biogas of the reactors. The frequency and bibliographic references of the methodologies used are also listed in the table.The air temperature near R1 and R2 was measured daily with a thermometer, and the mean values ranged from 20°C to 30°C. Therefore, the reactors were operated predominantly in the mesophilic temperature range.The daily volume of methane produced in the reactors was corrected to standard temperature and pressure (0°C and 1atm) (STP).
Determination and examination, frequency and bibliographic reference of the methodologies used for influent, effluent, sludge, and biogas.
| Examination and determination | Frequency | Bibliographic |
|---|---|---|
| Influent and effluent | Reference | |
| pH | Twice a week | (Method: 4500 – B)14 |
| Total (totalCOD), dissolved (dissCOD), and suspended (ssCOD) chemical oxygen demand | Twice a week | (Method: 5220 – B)14 |
| total (TA), partial (PA), and intermediary (IA) alkalinity | Twice a week | 14,17 |
| Total (TSS), volatile (VSS), and fixed (FSS) suspend solids | Twice a week | (Method: 2540 – C e 2540 – E)14 |
| Total volatile acids (TVA) | Twice a week | 18 |
| Kjeldahl nitrogen (KN) | Twice a week | (Method: 4500-N-C)14 |
| Total phosphorus (totalP) | Twice a week | (Method: 4500-P-C)14 |
| Sludge | ||
| Total solids (TS) and volatile solids (VS) | Biweekly | (Method 2540 – B and 2540 – E)14 |
| Biogas | ||
| Production | Daily | (Method: gasometer)19 |
| Composition | Weekly | 14 (Method: gas chromatography) |
In the first 158 (R1) and 172 (R2) days of the operation, the pH values of the influent when OLR was 0.2–7.5gtotalCOD (Ld)−1 were between 6.5 and 7.0 (Figure 3) because the influent was corrected with NaOH solution. The ratio of total alkalinity (TA)/COD in the influent of the reactor was 0.07–0.11. After this period and when recirculation of the effluent began, the pH values of the influent increased to 7.0–7.5 in R1 and 6.0–7.0 in R2 (Figure 3). This increase was due to the increase in the TA/COD ratio in the influent to 1.5 because of the recirculation. The TA/COD ratio greater than 0.2 in the influent suggests that the alkalinity in the reactor is sufficient to be operated with stability.20
 for vinasse treatment.")
The effluent pH in both the reactors ranged from 7.0 to 8.0. With the recirculation of the effluent, the pH remained steady around 7.8 in R1, which was operated with a smaller OLR (Figure 3). These values are close to the range 6.7–7.8 considered ideal for the development of methanogenic archaea.21
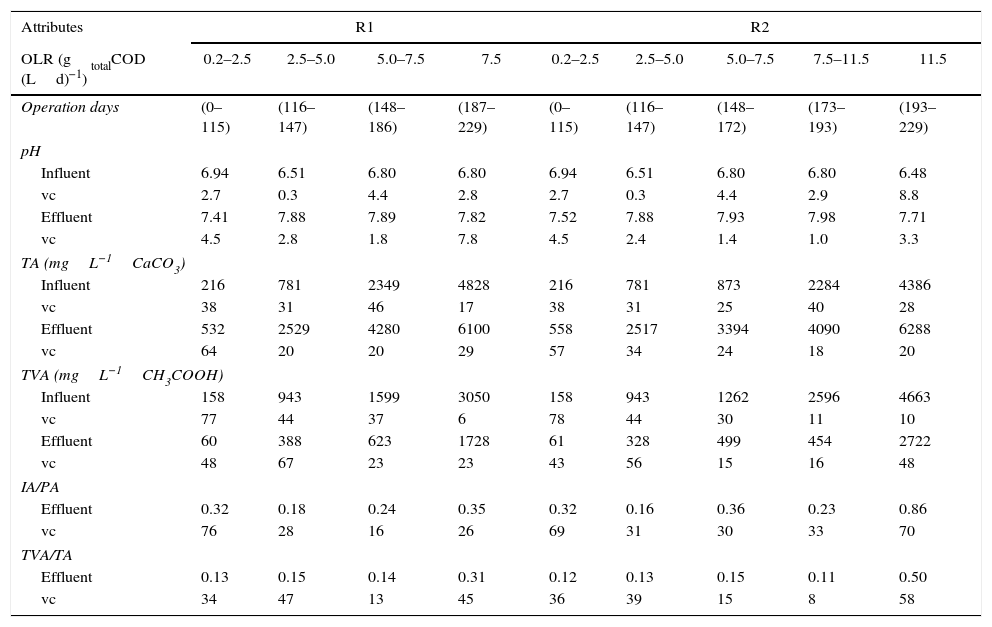
The average concentrations of TA in the effluents of both reactors increased from 532 and 558mgL−1 to approximately 4280 and 3394mgL−1, respectively, with the increase in OLR from 0.2 to 7.5gtotalCOD (Ld)−1 (Table 2 and Figure 4).
Average values of the concentrations of total alkalinity (TA), total volatile acids (TVA) of the influents and effluents; ratios IA/PA and TVA/TA of the effluents; and OLR applied during the operation of the UASB reactors (R1 and R2) for vinasse treatment.
| Attributes | R1 | R2 | |||||||
|---|---|---|---|---|---|---|---|---|---|
| OLR (gtotalCOD (Ld)−1) | 0.2–2.5 | 2.5–5.0 | 5.0–7.5 | 7.5 | 0.2–2.5 | 2.5–5.0 | 5.0–7.5 | 7.5–11.5 | 11.5 |
| Operation days | (0–115) | (116–147) | (148–186) | (187–229) | (0–115) | (116–147) | (148–172) | (173–193) | (193–229) |
| pH | |||||||||
| Influent | 6.94 | 6.51 | 6.80 | 6.80 | 6.94 | 6.51 | 6.80 | 6.80 | 6.48 |
| vc | 2.7 | 0.3 | 4.4 | 2.8 | 2.7 | 0.3 | 4.4 | 2.9 | 8.8 |
| Effluent | 7.41 | 7.88 | 7.89 | 7.82 | 7.52 | 7.88 | 7.93 | 7.98 | 7.71 |
| vc | 4.5 | 2.8 | 1.8 | 7.8 | 4.5 | 2.4 | 1.4 | 1.0 | 3.3 |
| TA (mgL−1CaCO3) | |||||||||
| Influent | 216 | 781 | 2349 | 4828 | 216 | 781 | 873 | 2284 | 4386 |
| vc | 38 | 31 | 46 | 17 | 38 | 31 | 25 | 40 | 28 |
| Effluent | 532 | 2529 | 4280 | 6100 | 558 | 2517 | 3394 | 4090 | 6288 |
| vc | 64 | 20 | 20 | 29 | 57 | 34 | 24 | 18 | 20 |
| TVA (mgL−1CH3COOH) | |||||||||
| Influent | 158 | 943 | 1599 | 3050 | 158 | 943 | 1262 | 2596 | 4663 |
| vc | 77 | 44 | 37 | 6 | 78 | 44 | 30 | 11 | 10 |
| Effluent | 60 | 388 | 623 | 1728 | 61 | 328 | 499 | 454 | 2722 |
| vc | 48 | 67 | 23 | 23 | 43 | 56 | 15 | 16 | 48 |
| IA/PA | |||||||||
| Effluent | 0.32 | 0.18 | 0.24 | 0.35 | 0.32 | 0.16 | 0.36 | 0.23 | 0.86 |
| vc | 76 | 28 | 16 | 26 | 69 | 31 | 30 | 33 | 70 |
| TVA/TA | |||||||||
| Effluent | 0.13 | 0.15 | 0.14 | 0.31 | 0.12 | 0.13 | 0.15 | 0.11 | 0.50 |
| vc | 34 | 47 | 13 | 45 | 36 | 39 | 15 | 8 | 58 |
OLR, organic loading rate; IA, intermediary alkalinity; PA, partial alkalinity; vc, variation coefficient (%).
 as a function of the organic loading rate (OLR) applied in UASB reactors (R1 and R2) for vinasse treatment.")
In R2, after 193 days of operation, with an OLR of 11.5gtotalCOD (Ld)−1 and HDT of 2.8d, the influent pH decreased to below 6.0. Approximately 40% of the effluent was being recirculated to correct the pH. Souza et al.16 used at least 50% effluent recirculation rate to maintain an influent pH of 7.0 in a thermophilic UASB treatment of vinasse. Therefore, after 218 days, HDT in R2 was reduced from 2.8 to 1.8d, which increased the volume of the recirculated effluent and thus contributed to pH correction to approximately 7.0 and to subsequent TA increase (Figures 3 and 4).
The average concentrations of total volatile acids (TVA) in the influent and effluent of the reactors increased with gradual increase in OLR. Maximum TVA was 1728mgL−1 with an OLR of 7.5gtotalCOD (Ld)−1 in R1 and 2722mgL−1 with an OLR of 11.5gtotalCOD (Ld)−1 in R2. The accumulation of TVA in the treatment of vinasse was mentioned by Souza et al.16 and Espinosa et al.22 The typical reactor response to rapid changes in OLR could lead to massive TVA concentrations, drop in pH, and consequent failure of the process.23
With the methods used to control the influent pH, the average intermediate alkalinity (IA)/partial alkalinity (PA) ratios in the effluent were low (0.18–0.35) in R1 and higher (0.23–0.86) in R2 because of a higher OLR of 11.5gtotalCOD (Ld)−1 applied (Table 2). According to Ripley et al.,24 an IA/PA ratio of above 0.3 indicates the occurrence of disorders in the anaerobic digestion process.
The average TVA/TA ratios in the effluents were 0.13–0.31 in R1 and 0.12–0.50 in R2 (Table 2) with increased OLR. The largest TVA/TA ratios were obtained for an OLR of 11.5gCOD (Ld)−1 with increasing TVA concentration from 2596 to 4663mgL−1. This is because of the decrease in the total COD removal efficiency from 82% to 60%.
The TVA/TA ratio above 0.8 may inhibit methanogenic archaea, of 0.3–0.4 indicates an unstable system, and a ratio of 0.1–0.2 is appropriate.25 Following this finding, instabilities existed only when R2 was operated with an OLR of 11.5gtotalCOD (Ld)−1, and stable operation of both UASB reactors was possible with an OLR of up to 7.5gtotalCOD (Ld)−1.
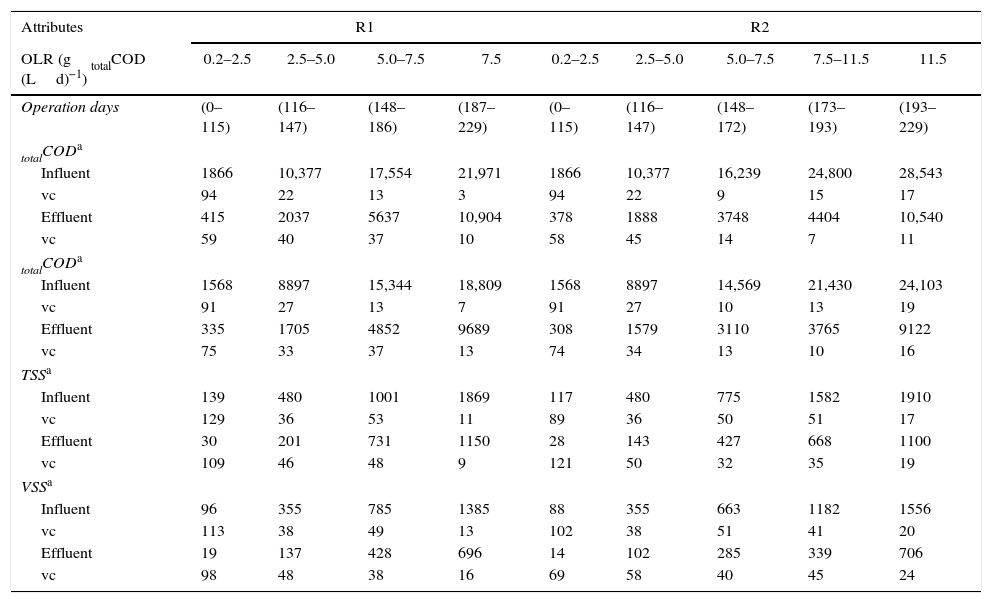
COD and suspended solidsThe values of totalCOD of the influent were 1866–21,971mgL−1 in R1 and 1866–28,543mgL−1 in R2 (Table 3) with the gradual increase in OLR. The average values of dissolved COD (dissCOD) were 84–89% of totalCOD, indicating that most of the organic matter of the influent can be found mainly soluble.
Average values of totalCOD, dissCOD, TSS, and VSS of the influents and effluents and the OLR applied during the operation of UASB reactors (R1 and R2) for vinasse treatment.
| Attributes | R1 | R2 | |||||||
|---|---|---|---|---|---|---|---|---|---|
| OLR (gtotalCOD (Ld)−1) | 0.2–2.5 | 2.5–5.0 | 5.0–7.5 | 7.5 | 0.2–2.5 | 2.5–5.0 | 5.0–7.5 | 7.5–11.5 | 11.5 |
| Operation days | (0–115) | (116–147) | (148–186) | (187–229) | (0–115) | (116–147) | (148–172) | (173–193) | (193–229) |
| totalCODa | |||||||||
| Influent | 1866 | 10,377 | 17,554 | 21,971 | 1866 | 10,377 | 16,239 | 24,800 | 28,543 |
| vc | 94 | 22 | 13 | 3 | 94 | 22 | 9 | 15 | 17 |
| Effluent | 415 | 2037 | 5637 | 10,904 | 378 | 1888 | 3748 | 4404 | 10,540 |
| vc | 59 | 40 | 37 | 10 | 58 | 45 | 14 | 7 | 11 |
| totalCODa | |||||||||
| Influent | 1568 | 8897 | 15,344 | 18,809 | 1568 | 8897 | 14,569 | 21,430 | 24,103 |
| vc | 91 | 27 | 13 | 7 | 91 | 27 | 10 | 13 | 19 |
| Effluent | 335 | 1705 | 4852 | 9689 | 308 | 1579 | 3110 | 3765 | 9122 |
| vc | 75 | 33 | 37 | 13 | 74 | 34 | 13 | 10 | 16 |
| TSSa | |||||||||
| Influent | 139 | 480 | 1001 | 1869 | 117 | 480 | 775 | 1582 | 1910 |
| vc | 129 | 36 | 53 | 11 | 89 | 36 | 50 | 51 | 17 |
| Effluent | 30 | 201 | 731 | 1150 | 28 | 143 | 427 | 668 | 1100 |
| vc | 109 | 46 | 48 | 9 | 121 | 50 | 32 | 35 | 19 |
| VSSa | |||||||||
| Influent | 96 | 355 | 785 | 1385 | 88 | 355 | 663 | 1182 | 1556 |
| vc | 113 | 38 | 49 | 13 | 102 | 38 | 51 | 41 | 20 |
| Effluent | 19 | 137 | 428 | 696 | 14 | 102 | 285 | 339 | 706 |
| vc | 98 | 48 | 38 | 16 | 69 | 58 | 40 | 45 | 24 |
The concentrations of total and volatile suspended solids (TSS and VSS) in the influent were 117–1910mgL−1 and 96–1556mgL−1, respectively (Table 3). VSS was 69–85% of TSS, thus indicating that organic suspended solids were predominant.
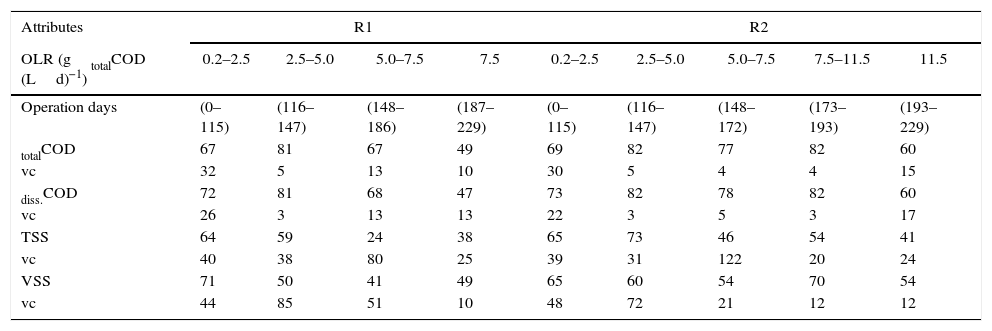
The maximum average efficiencies of totalCOD and dissCOD removal in the UASB reactors of 81% and 82%, respectively, were achieved with an OLR of 2.5–5.0gtotalCOD (Ld)−1 in R1 and R2. With the increase in average OLR from 5.0 to 7.5gtotalCOD (Ld)−1 in R1 and R2, and 7.5–11.5totalCOD (Ld)−1 in R2, the removal efficiencies of totalCOD and dissCOD remained similar, 70–82%, respectively (Table 4 and Figure 5). Therefore, the strategy used (inoculated with granular sludge, pH correction with NaOH and application of increasing OLR) allowed the startup and stabilization of COD removal in UASB reactor with OLR up to 11.5gtotalCOD (Ld)−1.
Average values of OLR and the removal efficiencies (in %) of totalCOD, dissCOD, TSS, and VSS during the operation of the UASB reactors (R1 and R2) for vinasse treatment.
| Attributes | R1 | R2 | |||||||
|---|---|---|---|---|---|---|---|---|---|
| OLR (gtotalCOD (Ld)−1) | 0.2–2.5 | 2.5–5.0 | 5.0–7.5 | 7.5 | 0.2–2.5 | 2.5–5.0 | 5.0–7.5 | 7.5–11.5 | 11.5 |
| Operation days | (0–115) | (116–147) | (148–186) | (187–229) | (0– 115) | (116–147) | (148–172) | (173–193) | (193–229) |
| totalCOD | 67 | 81 | 67 | 49 | 69 | 82 | 77 | 82 | 60 |
| vc | 32 | 5 | 13 | 10 | 30 | 5 | 4 | 4 | 15 |
| diss.COD | 72 | 81 | 68 | 47 | 73 | 82 | 78 | 82 | 60 |
| vc | 26 | 3 | 13 | 13 | 22 | 3 | 5 | 3 | 17 |
| TSS | 64 | 59 | 24 | 38 | 65 | 73 | 46 | 54 | 41 |
| vc | 40 | 38 | 80 | 25 | 39 | 31 | 122 | 20 | 24 |
| VSS | 71 | 50 | 41 | 49 | 65 | 60 | 54 | 70 | 54 |
| vc | 44 | 85 | 51 | 10 | 48 | 72 | 21 | 12 | 12 |
OLR, organic loading rate; totalCOD, total chemical oxygen demand; dissCOD, dissolved chemical oxygen demand; TSS, total suspended solids; VSS, volatile suspended solids; vc, variation coefficient (%).
 as a function of the organic loading rate (OLR) applied in the UASB reactors (R1 and R2) for vinasse treatment.")
The removal efficiencies of totalCOD decreased to approximately 50% and 60% with the recirculation of the effluent when OLR of 7.5 and 11.5gtotalCOD (Ld)−1 was applied in R1 and R2, respectively. This was due to the increase in the amount of compounds that cannot be easily degraded with the subsequent recirculation of the effluent.
For a successful startup of the anaerobic treatment of vinasse from wine distillery, Wolmarans and Villers26 recommended the UASB reactor to be operated at an OLR of 4.0–8.0gtotalCOD (Ld)−1 until 90% totalCOD removal is achieved, which will initiate the gradual increase of OLR. This result was similar to that of our work. However, other studies on sugarcane vinasse treatment in UASB reactors attained successful with COD removal at an efficiency below 90%,16,27 which resulted in an OLR up to 30gtotalCOD (Ld)−1.16 This confirms that it is possible to increase the OLR, but the COD removal decreases, as occurred in UASB reactors (R1 and R2) with OLR above 7.5gtotalCOD (Ld)−1.
The average values of TSS removal efficiency decreased from 64% to 38% in R1 and from 65% to 41% in R2 when OLR was increased from 0.2 to 7.5gtotalCOD (Ld)−1 in R1 and from 0.2 to 11.5gtotalCOD (Ld)−1 in R2 (Table 4). This decrease in TSS removal efficiency is due to wash out of the sludge in the reactors. This issue was solved by discarding 10% of the volume of sludge blanket of both reactors with an OLR of 5.0–7.5gtotalCOD (Ld)−1.
Total and volatile solids in the sludgeTS concentration in the sludge of the UASB reactors (R1 and R2) increased with OLR (Figure 6A and B), indicating that there was an increase in the sludge blanket of the reactors.
 in the sludge collected at the points shown in Figure 1 as a function of the organic loading rate (OLR) applied in the UASB reactors (R1 and R2) treating vinasse. (A) R1 and (B) R2.")
Concentration of total solids (TS) in the sludge collected at the points shown in Figure 1 as a function of the organic loading rate (OLR) applied in the UASB reactors (R1 and R2) treating vinasse. (A) R1 and (B) R2.
In R1, TS concentration in the sludge increased from 49 to 75gL−1, 41 to 72gL−1, 31 to 55gL−1, 5 to 28gL−1 and 5 to 30gL−1 at collection points P1, P2, P3, P4, and P5, respectively, and with an OLR of 0.2–7.5gtotalCOD (Ld)−1(Figure 6A).
In R2, TS concentration in the sludge increased from 45 to 70gL−1, 42 to 68gL−1, 31 to 45gL−1 and 5 to 25gL−1 at collection points P1, P2, P3, and P4, respectively, and with an OLR of 0.2–11.5gtotalCOD (Ld)−1 (Figure 6B).
The decrease in TS concentration in the sludge from both reactors at collection points P3 and P4 is due to the disposal of excess sludge (10% of the volume of the sludge blanket). This prevented VSS wash out with the effluent and was performed with an OLR of 5.0–7.5gtotalCOD (Ld)−1.
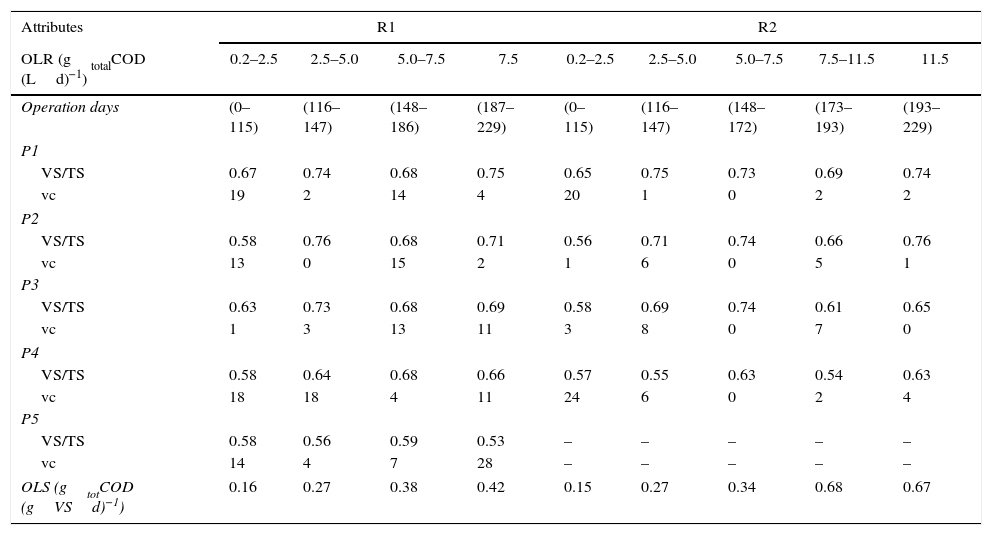
The ratio of volatile and total solids (VS/TS) in the sludge from the UASB reactors ranged from 0.54 to 0.76 (Table 5). These values indicate the predominance of organic matter in the sludge, and thus the presence of microorganisms, as confirmed by intensive conversion of totalCOD removed into methane (Table 6).
Average values of the ratio of VS/TS in the sludge, OLS and OLR during the operation of the UASB reactors (R1 and R2) for vinasse treatment.
| Attributes | R1 | R2 | |||||||
|---|---|---|---|---|---|---|---|---|---|
| OLR (gtotalCOD (Ld)−1) | 0.2–2.5 | 2.5–5.0 | 5.0–7.5 | 7.5 | 0.2–2.5 | 2.5–5.0 | 5.0–7.5 | 7.5–11.5 | 11.5 |
| Operation days | (0–115) | (116–147) | (148–186) | (187–229) | (0– 115) | (116–147) | (148–172) | (173–193) | (193–229) |
| P1 | |||||||||
| VS/TS | 0.67 | 0.74 | 0.68 | 0.75 | 0.65 | 0.75 | 0.73 | 0.69 | 0.74 |
| vc | 19 | 2 | 14 | 4 | 20 | 1 | 0 | 2 | 2 |
| P2 | |||||||||
| VS/TS | 0.58 | 0.76 | 0.68 | 0.71 | 0.56 | 0.71 | 0.74 | 0.66 | 0.76 |
| vc | 13 | 0 | 15 | 2 | 1 | 6 | 0 | 5 | 1 |
| P3 | |||||||||
| VS/TS | 0.63 | 0.73 | 0.68 | 0.69 | 0.58 | 0.69 | 0.74 | 0.61 | 0.65 |
| vc | 1 | 3 | 13 | 11 | 3 | 8 | 0 | 7 | 0 |
| P4 | |||||||||
| VS/TS | 0.58 | 0.64 | 0.68 | 0.66 | 0.57 | 0.55 | 0.63 | 0.54 | 0.63 |
| vc | 18 | 18 | 4 | 11 | 24 | 6 | 0 | 2 | 4 |
| P5 | |||||||||
| VS/TS | 0.58 | 0.56 | 0.59 | 0.53 | – | – | – | – | – |
| vc | 14 | 4 | 7 | 28 | – | – | – | – | – |
| OLS (gtotCOD (gVSd)−1) | 0.16 | 0.27 | 0.38 | 0.42 | 0.15 | 0.27 | 0.34 | 0.68 | 0.67 |
OLR, organic loading rate; OLS, organic load in the sludge; VS, volatile solids; TS, total solids; vc, variation coefficient (%). P1, point 1 (bottom); P2, point 2; P3, point 3; P4, point 4; P5, point 5 (top), as shown in Figure 1.
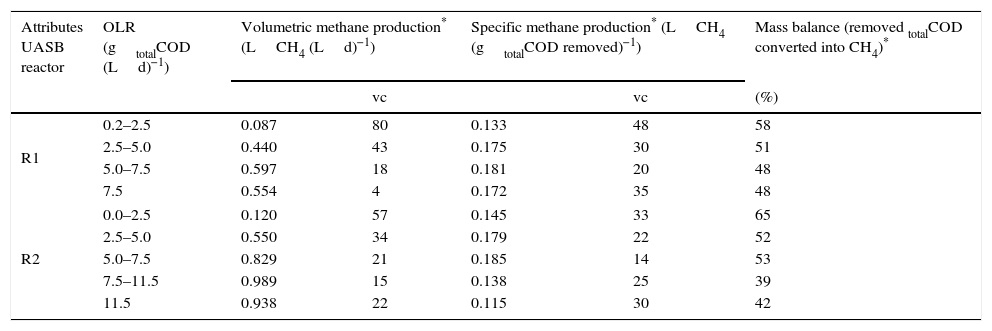
Average values of OLR, volumetric and specific methane production, and mass balance for conversion of removed totalCOD into methane during operation of UASB reactors (R1 and R2) for vinasse treatment.
| Attributes UASB reactor | OLR (gtotalCOD (Ld)−1) | Volumetric methane production* (LCH4 (Ld)−1) | Specific methane production* (LCH4 (gtotalCOD removed)−1) | Mass balance (removed totalCOD converted into CH4)* | ||
|---|---|---|---|---|---|---|
| vc | vc | (%) | ||||
| R1 | 0.2–2.5 | 0.087 | 80 | 0.133 | 48 | 58 |
| 2.5–5.0 | 0.440 | 43 | 0.175 | 30 | 51 | |
| 5.0–7.5 | 0.597 | 18 | 0.181 | 20 | 48 | |
| 7.5 | 0.554 | 4 | 0.172 | 35 | 48 | |
| R2 | 0.0–2.5 | 0.120 | 57 | 0.145 | 33 | 65 |
| 2.5–5.0 | 0.550 | 34 | 0.179 | 22 | 52 | |
| 5.0–7.5 | 0.829 | 21 | 0.185 | 14 | 53 | |
| 7.5–11.5 | 0.989 | 15 | 0.138 | 25 | 39 | |
| 11.5 | 0.938 | 22 | 0.115 | 30 | 42 | |
Values adjusted for standard temperature and pressure (STP) (0°C and 1atm).
OLR, organic loading rate; totalCOD, total chemical oxygen demand; vc, variation coefficient (%).
According to Brazilian legislation (Resolution n° 37528), the sewage sludge or derived product is considered stable for agriculture use if VS/TS<0.70. Therefore, it was observed that the sludge has been stabilized, especially in the top of the sludge blanket (collection points, P3, P4, and P5 from R1 and P3 and P4 from R2). Thus, when necessary, sludge disposal should be performed from P3 because at this point VS/TS<0.7.
The organic load in the sludge (OLS) ranged from 0.16 to 0.42gtotalCOD (gVSd)−1 in R1 and 0.15 to 0.67gtotalCOD (gVSd)−1 in R2, with an increase in OLR (Table 5). The recommendation of Chernicharo12 was followed. The OLS during the startup of the UASB reactors was maintained between 0.05 and 0.15gtotalCOD (gVSd)−1. It was gradually increased to a value lower than 2.0gtotalCOD (gVSd)−1 depending on the removal efficiencies.
MethaneMethane percentage in the biogas decreased from 83% to 69% and from 85% to 64% in R1 and R2, respectively, when OLR was increased (Table 6). However, the volumetric methane production reached up to 0.8L CH4 (L reactor d)−1 in R1 and 1.3L CH4 (L reactor d)−1 in R2 when higher OLR values of 7.5 and 11.5gtotalCOD (Ld)−1 were applied, respectively (Figure 7). The highest average values of the volumetric methane production were 0.597 and 0.989L CH4 (Ld)−1 with OLR values of 5.0–7.5gtotalCOD (Ld)−1 in R1 and 7.5–11.5gtotalCOD (Ld)−1 in R2.
 for vinasse treatment.")
The specific methane production increased from 0.133 to 0.181L CH4 (gtotalCOD removed)−1 in R1 and from 0.145 to 0.185L CH4 (gtotalCOD removed)−1 in R2 with the application of an OLR of 0.2–7.5gtotalCOD (Ld)−1. With higher values of OLR and effluent recirculation, the average values of specific methane production decreased to 0.172 and 0.115L CH4 (gtotalCOD removed)−1 in R1 and R2, respectively (Table 6). The methane yield was below the theoretical value of 0.35L CH4 (gCOD removed)−1 calculated stoichiometrically. The methane yield obtained by Souza et al.,16 was 0.37L CH4 (gCOD removed)−1 with an OLR of 26.5g COD (Ld)−1 and that obtained by España-Gamboa et al.,6 was 0.26L CH4 (gCOD removed)−1 with an OLR of 17.0g COD (Ld)−1 in the vinasse treatment in thermophilic UASB reactors. These results suggest that the vinasse anaerobic treatment conducted in the thermophilic phase allows application of larger OLR and yields higher specific methane production.
The average conversion rates of totalCOD removed into methane in R1 and R2 were 48–58% and 39–65%, respectively (Table 6). These values are higher by more than 50% compared with those observed by Harada et al.,27
Assuming that 10% of removed COD was converted in the sludge, as indicated by Chernicharo,12 methane loss of 25% and 51% was found in R1 and R2. A significant portion of gases generated in the anaerobic treatment can remain dissolved in the liquid and be expelled out with the treated effluent. The methane loss in the effluent from the UASB reactors can vary from 20% to 50%.21 Therefore, the values assigned to the sludge production and methane losses in the effluent can result in up to 30–60% of COD removal. These values are within the range quoted for R1 and R2.
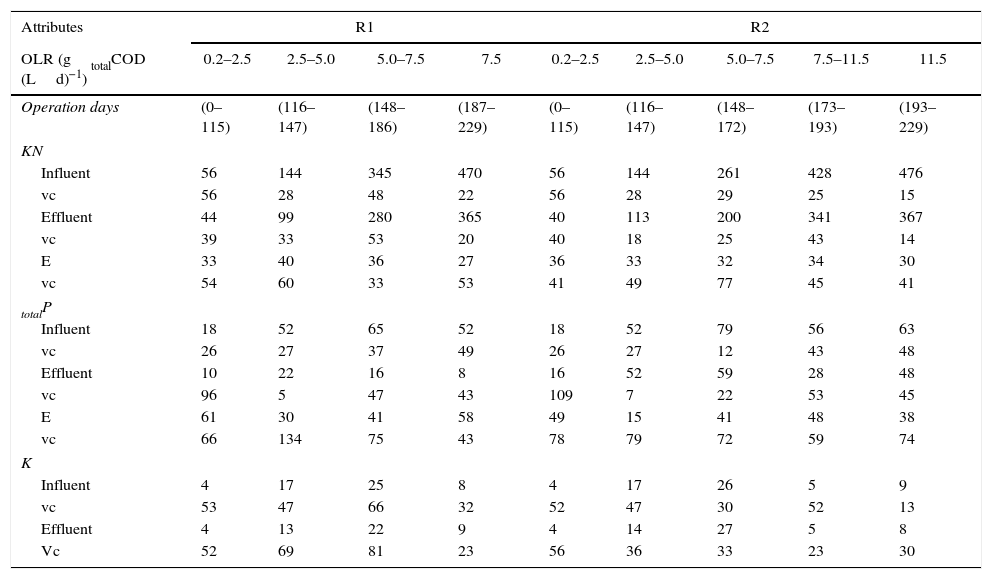
Nitrogen and phosphorusThe average concentration of totalP and KN in the influent increased from 56 to 476mgL−1 and from 18 to 63mgL−1, respectively, due to the nutrient supplementation and the increase of OLR in R1 and R2 (Table 7). Supplementation of nitrogen, phosphorus, and potassium can reduce the effects of possible shock loads and prevent flotation of granules in UASB reactors. Among several possible formulations for supplemental phosphorus and potassium, KH2PO4 is recommended owing to its buffer capacity.15
Average concentrations (mgL−1) of Kjeldahl nitrogen (KN), total phosphorus (totalP) and potassium (K) in the influents and effluents; removal efficiency (E in %); and OLR during operation of UASB reactors (R1 and R2) for vinasse treatment.
| Attributes | R1 | R2 | |||||||
|---|---|---|---|---|---|---|---|---|---|
| OLR (gtotalCOD (Ld)−1) | 0.2–2.5 | 2.5–5.0 | 5.0–7.5 | 7.5 | 0.2–2.5 | 2.5–5.0 | 5.0–7.5 | 7.5–11.5 | 11.5 |
| Operation days | (0–115) | (116–147) | (148–186) | (187–229) | (0–115) | (116–147) | (148–172) | (173–193) | (193–229) |
| KN | |||||||||
| Influent | 56 | 144 | 345 | 470 | 56 | 144 | 261 | 428 | 476 |
| vc | 56 | 28 | 48 | 22 | 56 | 28 | 29 | 25 | 15 |
| Effluent | 44 | 99 | 280 | 365 | 40 | 113 | 200 | 341 | 367 |
| vc | 39 | 33 | 53 | 20 | 40 | 18 | 25 | 43 | 14 |
| E | 33 | 40 | 36 | 27 | 36 | 33 | 32 | 34 | 30 |
| vc | 54 | 60 | 33 | 53 | 41 | 49 | 77 | 45 | 41 |
| totalP | |||||||||
| Influent | 18 | 52 | 65 | 52 | 18 | 52 | 79 | 56 | 63 |
| vc | 26 | 27 | 37 | 49 | 26 | 27 | 12 | 43 | 48 |
| Effluent | 10 | 22 | 16 | 8 | 16 | 52 | 59 | 28 | 48 |
| vc | 96 | 5 | 47 | 43 | 109 | 7 | 22 | 53 | 45 |
| E | 61 | 30 | 41 | 58 | 49 | 15 | 41 | 48 | 38 |
| vc | 66 | 134 | 75 | 43 | 78 | 79 | 72 | 59 | 74 |
| K | |||||||||
| Influent | 4 | 17 | 25 | 8 | 4 | 17 | 26 | 5 | 9 |
| vc | 53 | 47 | 66 | 32 | 52 | 47 | 30 | 52 | 13 |
| Effluent | 4 | 13 | 22 | 9 | 4 | 14 | 27 | 5 | 8 |
| Vc | 52 | 69 | 81 | 23 | 56 | 36 | 33 | 23 | 30 |
OLR, organic loading rate; vc, variation coefficient (%).
Although the vinasse from sugarcane contains high concentrations of potassium ion, approximately 5gL−1,20 it was used as the source of phosphorus KH2PO4 because, according to Chen et al.,29 almost no reports of toxic effects of potassium on the microbiota of anaerobic reactors.
The ratio of COD:N:P in the influent varied from 350:4.8:0.8 to 350:7.4:1.7 in R1 and R2 for OLR greater than 2.5g total COD (Ld)−1. These values are close to that suggested by Chernicharo12 sufficient for satisfying the conditions of microorganisms for anaerobic digestion.
In the effluent of the reactors, totalP and KN were lower than those observed in the influent and ranged from 44 to 367mgL−1 and 10 to 52mgL−1, respectively. The average removal efficiencies of KN and totalP were 27–40% and 30–61%, respectively, in R1 and 30–36% and 15–49%, respectively, in R2 (Table 7). According to Oliveira et al.,30 one of the possible mechanisms for nitrogen and phosphorus removal is the formation of struvite (NH4MgPO4·6H2O) and vivianite (Fe3(PO4)2·8H2O) in addition to immobilization in the microbiota from the sludge blanket.
The potassium concentration in the effluent of the reactors was similar to that in the influent (Table 7). Therefore, the KN, totalP, and K available in the effluent and retained in the sludge can be used for fertigation and fertilization, and thus can partly replace mineral fertilizers and reduce production costs.
ConclusionsThe highest totalCOD conversion into methane of 0.19L CH4 (gtotalCOD removed)−1 was achieved after 140 days of operation of the UASB reactors with totalCOD removal efficiencies of approximately 70% and 80%, and an OLR of 5.0–7.5gtotalCOD (Ld)−1. The highest totalCOD removal efficiencies were 81% and 82% in R1 and R2, respectively, with an OLR of 2.5–5.0gtotalCOD (Ld)−1. Recirculation of the effluent allowed adjustment of influent pH without the need to add sodium hydroxide. The UASB reactors produced methane with high efficiency, a better quality effluent, and stable sludge. The nutrients present in the vinasse and those obtained from the supplements in the anaerobic treatment can be recycled by using the effluent in fertigation and the sludge for plant fertilization.
Conflicts of interestThe authors declare no conflicts of interest.
We thank the Coordination for the Improvement of Higher Education Personnel (CAPES; Process PNPD-3137/2010) and the National Council for Scientific and Technological Development (CNPq; Process 456426/2014-0) for financial support and scholarship to the first author.