


Maltose and pectin-assisted low-temperature combustion modified sol–gel process was employed to synthesize nanopowders of Ce0.8Sm0.2O2−δ (SDC 20), Ce0.81Nd0.095Sm0.095O2−δ (NSDC). The sample's powder was sintered at 1250oC for 6h to form dense ceramics with a relative density greater than 95%. The Rietveld refinement of powder XRD patterns indicates a single-phase material with a cubic fluorite structure. The Raman spectroscopy studies confirm solid solution with evidence of more oxygen vacancies in sample NSDC to sample SDC 20. The SEM images of the samples show a high-dense surface with few pores. The EDX results confirm the sample's chemical composition. Impedance measurements were carried out to study electrical properties. The NSDC sample showed improved conductivity (3.06×10⁻²S/cm at 600°C) over SDC 20 (2.16×10⁻²S/cm at 600°C) with lower activation energy (0.81eV). Specific grain (σ*g) and grain boundary (σ*gb) conductivity values were calculated using porosity corrections to the Bricklayer model.
Se empleó un proceso sol-gel modificado por combustión a baja temperatura asistido por maltosa y pectina para sintetizar nanopolvos de Ce0,8Sm0,2O2−δ (SDC 20), Ce0,81Nd0,095Sm0,095O2−δ (NSDC). El polvo de la muestra se sinterizó a 1250°C durante 6h para formar cerámicas densas con una densidad relativa superior al 95%. El refinamiento de Rietveld de los patrones de XRD en polvo indica un material monofásico con una estructura de fluorita cúbica. Los estudios de espectroscopia Raman confirman la solución sólida con evidencia de más vacantes de oxígeno en la muestra NSDC a la muestra SDC 20. Las imágenes SEM de las muestras muestran una superficie de alta densidad con pocos poros. Los resultados de EDX confirman la composición química de la muestra. Se realizaron mediciones de impedancia para estudiar las propiedades eléctricas. La muestra de NSDC mostró una conductividad mejorada (3,06×10⁻²S/cm a 600°C) sobre SDC 20 (2,16×10⁻²S/cm a 600°C) con menor energía de activación (0,81eV). Los valores específicos de conductividad de grano (σ*g) y del límite de grano (σ*gb) se calcularon utilizando correcciones de porosidad al modelo Bricklayer.
Solid electrolyte materials play a significant and vital role in solid oxide fuel cells (SOFCs). SOFCs convert chemical energy to electrical energy as long as the fuel is supplied [1,2]. SOFCs are known for clean, green, and efficient energy conversion. SOFC consists of an anode, cathode, and electrolyte materials as main parts [3]. An electrolyte material should have a higher density and electrical conductivity; for example, YSZ (yttrium stabilized zirconia) needs higher operating temperatures, i.e., more than 800°C, to reach optimum conductivity. Materials selection is not that easy at such high operating temperatures where specific problems can occur like micro-cracks, materials degradation, chemical instability, and thermal instability across cell components [4–6].
In search of advanced alternate materials to bring down the operating temperature into the region 500–700°C, doped cerium oxide (CeO2) is a suitable candidate. CeO2 is a poor ionic conductor (10−5S/cm at 600°C) [3,5]. However, its conductivity could be improved by doping rare earth or alkaline earth materials. Besides, structural changes also play an important role in understanding ionic conductivity since it depends on oxygen vacancies [5]. Cerium oxide structure is cubic fluorite. When ceria is doped with dopants, solid solution formation without affecting its structure is essential to optimize the electrical properties.
The sample composition selection is based on the density functional theory (DFT) results reported by Anderson et al. [7]. Anderson et al. have suggested two combinations of dopants, i.e., Pr/Gd or Nd/Sm. When these dopants doped into ceria in the ratio 1:1, improved conductivity with lower activation energy values were reported theoretically. In the present study, Nd/Sm combination is selected in the ratio of 1:1. Furthermore, the average atomic number of Nd (61) and Sm (62) is 61.5, which is correlated to the critical ionic radius (rc) [8,9]. Kim [10] reported that the dopants selection should be based on the critical radius (rc) (for trivalent dopants, 1.04Å) to optimize the ionic conductivity. However, it is not possible to explain the electrical properties only based on the critical radius (rc) [9,11].
The sample preparation method plays a vital role in preparing dense ceramic electrolytes. For example, Omer et al. [12] have synthesized the samples Smx/2Ndx/2Ce1−xO2−δ through the solid-state reaction method and obtained the dense ceramic samples by sintering at 1600°C for 12h. Such high temperatures result in micro-cracks on the surface, considerable grain growth, and sample composition instability. Liu et al. [13] reported citric acid–nitrate low-temperature combustion process for the system Ce0.9(SmxNd1−x)0.1O1.95, and samples were sintered at 1350°C for 4h. Coles-Aldridge and Baker [9] reported a citrate complexation process for the system Ce0.8SmxGdyNdzO1.9 and sintered samples at 1450°C for 4h. Arabaci et al. [14] synthesized Nd0.20SmxCe0.8−xO1.9−x/2 samples by a polyol process and sintered at 1400°C for 6h. Li et al. [15] reported a citrate sol–gel method for Ce0.8Sm0.1Nd0.1O2−δ and sintered at 1500°C for 4h. A modified sol–gel process using maltose and pectin [16,17] has been employed to prepare the samples to overcome these problems in the present study. This method is very simple, environment friendly, and more control over the particle size with uniform distribution.
In the present study, Ce0.8Sm0.2O2−δ (SDC 20), Ce0.81Nd0.095Sm0.095O2−δ (NSDC) samples are prepared through a modified sol–gel process using maltose and pectin as chelating and gel agents [16,17]. The present investigation aims to prepare dense ceramics at sintering temperatures lower than reported [9,12–15] and study their structural, microstructural, and electrical properties.
Experimental methodA modified sol–gel process using maltose and pectin was carried out to synthesize the samples SDC 20 and NSDC. Ce, Sm, and Nd nitrates were dissolved in distilled water under continuous stirring in a beaker. The synthesis procedure can be seen in Fig. 1, and details can be found elsewhere [16,17]. Maltose and pectin solution is slowly dripped into nitrates’ solution by continuously stirring the solution up to 1h to avoid particles’ agglomeration and solidification into crystals. The adequately mixed solution was kept on a magnetic stirrer at 85°C until forming a gel. The gel was then placed on a hot plate at 80°C for 21h, resulting in pale yellow colour powder.

Furthermore, the powder was calcined at 600°C for 2h, and the powder was properly ground to get a fine powder. The powder was then pressed uni-axially into circular pellets, and then sample pellets were sintered in air at 1250°C for 6h. The Archimedes method was used to measure density. The sintered sample's relative density was more than 95%.
The powder XRD patterns were recorded by the BRUKER D8 instrument. Topaz software was used for Rietveld refinement of powder XRD patterns. A Raman spectrometer (LABRAM-HR using a laser excitation line of 514.5nm at room temperature) was used to record the Raman spectra. The sample's surface morphology was recorded using a scanning electron microscope (FE-SEM, ZEISS Sigma 500 VP). Sample composition analysis was observed by an energy-dispersive X-ray spectrometer (EDX attached with FE-SEM). An Agilent precision impedance analyzer (4294 A) was used to measure electrical properties. The measuring frequency range was between 42Hz and 5MHz on dense sintered pellets. The electrical conductivity measurements were taken at various temperatures between 250 and 700°C in the air. Sample pellets surface was coated with silver paste and dried in the oven at 150°C for 2h.
Results and discussionStructural characterizationFig. 2 shows the powder XRD patterns of SDC 20 and NSDC samples. It shows a cubic fluorite structure with a space group Fm3¯m (JCPDS File No. 34-0394). The doping of Nd3+ and Sm3+ into Ce4+ would result in a shift in the doped ceria peaks. This shift shows that the lattice parameter of the NSDC sample is increased over SDC 20. When larger ionic radii of dopants (Sm3+,1.07Å, and Nd3+, 1.10Å) doped into a host of smaller ionic radii (Ce4+, 0.97Å), it results in an expansion in the host lattice [9,12]. The lattice parameter of the NSDC sample is 5.439Å (±0.002), and it is nearer to the reported values (Table 1) [9,15]. However, the reported composition (Ce0.80Nd0.1Sm0.1O2−δ) of the samples is not the same as the present sample (Ce0.81Nd0.095Sm0.095O2−δ).

Structural information of SDC 20 and NSDC samples.
| Parameter | CeO2 | SDC 20 | NSDC |
|---|---|---|---|
| Structure | Cubic | Cubic | Cubic |
| Space group | Fm3¯m | Fm3¯m | Fm3¯m |
| Rp | 5.340 | 5.401 | 5.422 |
| Rwp | 6.25 | 7.32 | 7.22 |
| Rexp | 5.55 | 6.47 | 6.91 |
| GOF | 1.12 | 1.13 | 1.04 |
| Lattice parameter, a (Å) | 5.411 (0.002) | 5.421 (0.003)5.423 (Ref. [9]) | 5.439 (0.002)5.440 (Ref. [15])5.441 (Ref. [9]) |
| Volume (a3) | 158.428 | 159.308 | 160.90 |
| Average crystallite size (nm) | 17 | 15 | 16 |
| r.m.s strain | 6×10⁻⁴ | 5.24×10⁻⁵ | 4.63×10⁻⁵ |
| CeO bond length (Å) | 2.344 | 2.348 | 2.350 |
| Atomic coordinate | |||
| Ce (4a site) | |||
| (xyz) | (000) | (000) | (000) |
| Occupancy | 0.9983 | 0.8012 | 0.8104 |
| Sm (4a site) | |||
| (xyz) | – | (000) | (000) |
| Occupancy | – | 0.1988 | 0.0948 |
| Nd (4a site) | |||
| (xyz) | – | – | (000) |
| Occupancy | – | – | 0.0948 |
| O (8c site) | |||
| (xyz) | (1/41/41/4) | (1/41/41/4) | (1/41/41/4) |
| Occupancy | 0.9901 | 0.9199 | 0.9251 |
The reflection from the (111) plane was used to calculate the average crystallite size. The average crystallite size (DXRD) was calculated using Scherrer's equation:
where λ is the wavelength of the radiation, θ is the diffraction angle, and β is the full-width at the half maximum. β broadening depends on instrumental broadening and sample size broadening. β is corrected using the relation (β2sample=β2total−β2instrument).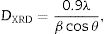
The average crystallite size values of SDC 20 and NSDC samples are presented in Table 1. The Rietveld refinement of powder XRD patterns SDC 20 and NSDC samples is shown in Fig. 3. It is noticed that the difference between experimental data and calculated data is small (i.e., almost a line). The fitting profile parameters like space group, profile, structure, Rp, Rw, Rexp, and goodness of fit (GOF) are shown in Table 1. The dopants Nd and Sm were positioned at site 4a with coordinate (000) of Ce, and oxygen was positioned at site 8c with coordinate (1/41/41/4). The occupancy numbers are given in Table 1. VESTA images are included in Fig. 3 (insets).
Raman spectroscopy
Fig. 4 presents the Raman spectra of SDC 20 and NSDC samples. It can be seen from Fig. 4 that for pure CeO2, there is only one vibrational mode at 462.63cm−1, and it is related to F2g symmetry (cubic phase) [18]. Furthermore, it is observed that there is one more extra band present at around 558cm−1. This additional band indicates the formation of oxygen vacancies. i.e., when Nd3+ and Sm3+ doped into the ceria matrix, oxygen vacancies are introduced. Besides, a decrease in intensity for the samples SDC 20 and NSDC over pure ceria is noticed. There is a shift towards lower frequency due to the ionic radius difference between host (Ce4+, 0.97Å) and dopants (Sm3+, 1.07Å, and Nd3+, 1.10Å). Raman spectra results support XRD results as solid solution formation and give evidence for the more oxygen vacancies for the sample NSDC over SDC 20.
Morphological characterization
Fig. 5(a) and (b) shows the SEM images at temperatures 600°C and 1000°C. The density of the sample is increasing with temperature. The SEM image (Fig. 5(c)) provides the information that small pores were present on the broken pellet surface. Fig. 5(d) shows the SEM photograph of NSDC of specimens at 1250°C. The sample surface shows grains clearly and a highly dense surface. The mean line intercept method was used to calculate the average grain size, and its value is 1.54μm. Besides, there are few grains in size range of 0.43–0.55μm. Fig. 5(e) presents the EDX element composition of NSDC samples. It is noticed that Ce, Nd, and Sm are present in the final sample as per the weight calculation.
Electrical properties 600°C, (b) 1000°C, (c) Broken pellet surface, (d) 1250°C and (e) EDS element mapping.")
To understand the electrical properties response of electrolyte material, a.c. impedance spectroscopy is a powerful tool to study grain, grain boundary, and electrode contributions to the total ionic conductivity. It is possible to study the transport properties from impedance studies by analyzing the real (resistive) and imaginary (reactive) parts separately.
Fig. 6(a) and (b) shows the typical Nyquist plots of NSDC samples at different temperatures. It is noticed that there are two well-resolved semi-circles in Fig. 6(a). A high-frequency semi-circle contributes to grain resistance (Rg), and a medium frequency semi-circle contributes to grain boundary resistance (Rgb). The grain and grain boundary resistance sum is the total resistance (Rt=Rg+Rgb) [19]. As the temperature is increased, both grain and grain boundary resistances decreased. Grain resistance arc is seen partially and not resolved properly after 350°C temperature in Fig. 6(b) due to frequency limit. The resistor–capacitor model was used to fit the impedance spectra (EIS software). CPE elements replace the capacitor due to different grain size distribution.
 Nyquist plots of NSDC sample at different temperatures and (c) typical Nyquist plots of SDC 20 and NSDC samples at 250°C.")
Fig. 6(c) presents the typical Nyquist plots for the samples SDC 20 and NSDC at 250°C. Compared with the SDC 20 sample, grain resistance is higher for the NSDC sample and lower grain boundary resistance; this shows that Sm and Nd co-dopants could decrease the grain boundary resistance over SDC 20 sample. However, Coles-Aldridge and Baker [9] reported that grain size varies with sintering temperature. i.e., with increasing sintering temperature, increase in grain size, and decrease in the grain boundary area, consequently, an increase in grain resistance with grain size and a decrease in grain boundary resistance. The total ionic conductivity σ=l/RA is calculated using total resistance, Rt=Rg+Rgb, where Rg is the grain resistance, Rgb is the grain boundary resistance, l is the thickness, and A is the cross-sectional area.
Fig. 7(a)–(c) shows the Arrhenius nature of conductivity vs. inverse temperature for grain, grain boundary, and total electrical conductivity of SDC 20 and NSDC samples. Fig. 7(a) shows the grain conductivity is higher for the sample SDC 20 over the NSDC sample, whereas grain boundary conductivity is higher for the NSDC sample over SDC 20 sample, as shown in Fig. 7(b). Fig. 7(c) shows that the total electrical conductivity of the NSDC sample is higher than that of the sample SDC 20. Total electrical conductivity values of SDC 20 and NSDC samples are presented in Table 2. When Sm3+ and Nd3+ doped into ceria, oxygen vacancies are created, which improves the ionic conductivity [3,5,6,9]. These equations are written in KrÖger-Vink notation [3,5], (VO••)=oxygen vacancy concentration, Nd′Ce or Sm′Ce=Nd3+ or Sm3+ doped into host Ce4+. The re-orientation process takes place due to VO••, oxygen vacancy occupancy in the fluorite structure. VO••, oxygen vacancy forms defect associate pairs with dopant cations (Nd′Ce. VO••, Sm′Ce.VO••) or (Nd′Ce.VO••.Nd′Ce, Sm′Ce.VO••.Sm′Ce) [20].
 grain conductivity, (b) grain boundary, and (c) total conductivity.")
Total electrical conductivity and activation energy values of SDC 20 and NSDC samples.
| Temperature (°C) | SDC 20 | NSDC |
|---|---|---|
| Total electrical conductivity, σt (S/cm) | ||
| 300 | 7.3090×10⁻⁶ | 9.5991×10⁻⁶ |
| 400 | 1.2254×10⁻⁴ | 1.4086×10⁻⁴ |
| 500 | 9.9364×10⁻⁴ | 2.0248×10⁻³ |
| 600 | 0.0061 | 0.0105 |
| 700 | 0.0216 | 0.0306 |
| Activation energy (e V) | ||
| Total conductivity | ||
| (250–500) | 1.01 | 0.95 |
| (550–700) | 0.89 | 0.81 |
| SDC 20 | NSDC | |||
|---|---|---|---|---|
| Grain | Grain boundary | Grain | Grain boundary | |
| (250–500) | 0.79 | 1.06 | 0.77 | 1.01 |
Fig. 7(a)–(c) presents grain, grain boundary, and total electrical conductivity curves and follows a straight-line character. Activation energy values were calculated by linear fitting the curves. The activation energy of the samples was calculated using Eq. (1):
where Ea is the activation energy, k is Boltzmann constant, and σo is the pre-exponential factor.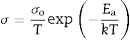
From Fig. 7(c), it is noticed that there is a slope change above 500°C (Tc, transition temperature). In the temperature ranges 250–500°C, total activation energy is due to association and migration energy, whereas at higher temperatures, i.e., 550–700°C, total activation energy is due to migration energy because most of the oxygen vacancies would dissociate [9,12]. The activation energies for grain, grain boundary, and total electrical conductivities are presented in Table 2. NSDC sample activation energy values are lower in comparison with the SDC 20 sample.
Table 3 presents the total electrical conductivity of SDC 20 and NSDC samples comparison with reported values. The total electrical conductivity values are matched with reported observations [21–31]. It is noticed from Table 3, slightly lower total electrical conductivity values than reported due to lower grain boundary conductivity contribution to the total electrical conductivity. However, grain boundary resistance could be decreased further by increasing the samples’ density (grain boundary area decreased with increasing grain size at a higher density) [9]. In the present study, we could synthesize the nanopowders successfully through maltose–pectin assisted modified sol–gel process. Dense ceramics are prepared by sintering the samples at 1250°C for 6h., The present sample's sintering temperature (density 95%) is lowered to 1250°C (compared to 1350°C), comparing with reported results [12–15]. However, as per the reports [9,13,15], grain boundary resistance could be decreased by increasing the sintering temperature. Electrical properties depend on the sample's synthesis method, structure, optimized sintering temperature, density, grain size, grain boundary area (grain boundary resistance contribution to total conductivity).
Electrical conductivity values comparison of SDC and NSDC samples.
| Composition | Total conductivity, σt (S/cm) | Activation energy (eV) | Reference |
|---|---|---|---|
| Ce0.8Sm0.2O2−δ | 2.16×10⁻² (700°C) | 0.89 | Present |
| Ce0.81Nd0.095Sm0.095O2−δ | 3.06×10⁻² (700°C) | 0.81 | Present |
| Ce0.80Nd0.1Sm0.1O1.9 | 3.73×10⁻² (700°C)(absolute value) | 0.90 | Coles-Aldridge [9] |
| Ce0.80Nd0.1Sm0.1O1.9 | 3.29×10⁻² (700°C) | 1.02 | Kahlaoui [21] |
| Ce0.80Nd0.1Y0.1O1.9 | 3.17×10⁻² (700°C) | 0.64 | Sha [22] |
| Ce0.80Nd0.08Sm0.12O1.9 | 3.90×10⁻² (700°C) | 0.63 | Arabaci [23] |
| Ce0.80Nd0.1Sm0.1O2−δ | 1.32×10⁻³ (600°C) | 0.95 | Li [15] |
| SDC (Ce0.8Sm0.2O2−δ) | 2.0×10⁻⁴ (600°C) | 1.02 | Li [15] |
| NDC (Ce0.8Nd0.2O2−δ) | 2.8×10⁻⁴ (600°C) | 0.95 | Li [15] |
| SDC(Ce0.8Sm0.2O2−δ) | 1.14×10⁻² (600°C) | 0.65 | Liu [24] |
| Ce0.8Sm0.2O2−δ | 2.22×10⁻³ (600°C) | 1.02 | Xiaomin[25] |
| Ce0.8Sm0.2O2−δ | 1.79×10⁻² (600°C) | 0.77 | Arabaci [26] |
| Ce0.8Gd0.2O2−δ | 3.40×10⁻² (750°C) | 0.62 | Arabaci [26] |
| Ce0.8Sm0.2O2−δ | 2.36×10⁻² (700°C) | 0.58 | Anwar [27] |
| Ce0.9Gd0.1O2−δ | 1.13×10⁻² (700°C) | 1.02 | Meisetti [28] |
| Ce0.82La0.06Sm0.06Gd0.06O2−δ | 3.81×10⁻² (600°C) | 0.55 | Venkataramana [29] |
| 8YSZ | 2.74×10⁻⁴ (700°C) | 0.74 | Rahmawati [30] |
| Ce0.80Nd0.1Sm0.1O1.9 | 3.15×10⁻² (600°C) | 0.63 | Liu [31] |
Pérez-Coll et al. [32] suggested the Bricklayer model with porosity corrections would be useful to study the electrical properties of lower density solid electrolyte materials. Fig. 8 shows the specific grain, specific grain boundary, normalized grain, and normalized grain boundary conductivity of SDC 20 and NSDC samples vs. 1000/T. Specific grain (σ*g), specific grain boundary (σ*gb) conductivity values were calculated using Eqs. (2) and (3)[32]:
where L is the thickness, A is the cross-sectional area, D is the average grain size, dg is the grain boundary thickness, fpor is the porosity factor, Rg is the grain resistance, and Rgb is the grain boundary resistance.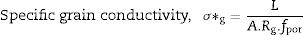

), specific grain boundary conductivity (σ*=L.dgb/(A.Rgb.fpor.D)), normalized grain conductivity (σg=L/(A.Rg)), and normalized grain boundary conductivity (σgb=L/(A.Rgb)) of SDC 20 and NSDC samples vs. 1000/T.")
It is noticed from Fig. 8 that there is a porosity effect on grain and grain boundary conductivity; specific grain conductivity is higher than that of the normalized grain conductivity for the samples SDC 20 and NSDC, whereas specific grain boundary conductivity is lower than that the normalized grain boundary conductivity. Pérez-Coll et al. [32] pointed out that grain resistance depends on porosity, whereas grain boundary resistance depends on porosity and grain size. Porosity factor (fpor) is calculated using Eq. (4):
Porosity results in the geometrical effects on sample resistance (grain and grain boundary resistance). However, it is noteworthy to say that the porosity correction is more useful for the samples whose relative density is lower, i.e., around 75–90%. The Bricklayer model is useful to explain the electrical properties of high dense ceramic electrolyte materials, whereas, for lower dense ceramic samples, it is not that useful [32] due to geometrical effect (like porosity, grain size). Using Eqs. (2)–(4), Pérez-Coll et al. [32] modified the Bricklayer model, and these modifications resulted in a specific grain and grain boundary conductivity (no geometrical effect on samples). It can be seen that from Fig. 8, specific grain conductivity contribution is higher than that of the specific grain boundary conductivity since grain boundary conductivity depends on density, grain size, and the porosity of the sample. Hence, therefore geometrical corrections would result in the real conductivity values of the samples.
ConclusionsSamarium doped ceria, Ce0.8Sm0.2O2−δ (SDC 20), Neodymium, and Samarium co-doped ceria Ce0.81Nd0.095Sm0.095O2−δ (NSDC) samples were synthesized successfully by the modified sol–gel method using maltose and pectin as chelating and gel agents. Rietveld refinement of XRD powder patterns confirms the cubic structure with a single phase. Oxygen vacancies and the formation of a solid solution were confirmed by Raman spectroscopy. High-dense ceramic samples were prepared by sintering at 1250°C for 6h with a high relative density (greater than 95%). SEM images were shown a high-dense surface with grains and consistent with the relative density. EDX confirms that Ce, Sm, Nd, and O are present in the final sample composition. The Ce0.81Nd0.095Sm0.095O2−δ (NSDC) sample shows higher total electrical conductivity, 3.06×10⁻²S/cm (600°C), and lower activation energy (0.81eV) than the SDC 20 sample, 2.16×10⁻²S/cm (600°C) (0.89eV). Specific grain and grain boundary conductivity results show porosity effect on normalized grain and grain boundary conductivity. Hence, the present sample is useful as an electrolyte for solid oxide fuel cell applications.
Conflict of interestThe authors declare that they have no known competing financial interests or personal relationships that could have appeared to influence the work reported in this paper.

