


MAX phases exhibit excellent combination of ceramic and metallic-like properties. In this work, MAX phase Ti3SiC2 powder was synthesized starting-off with different combinations of elemental powders and carbides. The powders used were Ti, Si, C, SiC and TiC in different combinations, molar ratios and powder size. Powders were heat treated on a vacuum furnace for different times and temperatures for in situ production of the Ti3SiC2 MAX phase. High purity synthesized samples were analyzed by X-ray diffraction (XRD) and scanning electron microscopy (SEM) in order to identify and quantify the different phase constituents present. The main phase constituents in the powders produced were Ti3SiC2 and TiSi2. Up to 94% of Ti3SiC2 MAX phase was obtained using Ti:SiC:C as starting powders in a molar ratio of 3:1.5:0.5. Different phase constitution was observed on the surface and the centre of the samples. An optimal starting powder composition, molar ratio, heat treatment temperature and time is proposed for the formation of high purity Ti3SiC2 MAX phase. Selected mixture was studied thermodynamically and a reaction mechanism of formation of the MAX phase is proposed.
Las fases MAX presentan una excelente combinación de propiedades cerámicas y metálicas. En este trabajo se sintetizaron polvos de fase MAX Ti3SiC2 a partir de diferentes combinaciones de polvos elementales y carburos. Los polvos utilizados fueron Ti, Si, C, SiC y TiC en diferentes combinaciones, proporciones molares y tamaño de partícula. Los polvos se sinterizaron en un horno de vacío a diferentes tiempos y temperaturas para la producción in situ de la fase MAX Ti3SiC2. Las muestras sintetizadas de alta pureza se analizaron mediante difracción de rayosX (XRD) y microscopía electrónica de barrido (SEM) para identificar y cuantificar las diferentes fases constituyentes presentes. Las principales fases constituyentes en los polvos producidos fueron de Ti3SiC2 y TiSi2. Se obtuvo hasta un 94% de fase MAX Ti3SiC2 utilizando como polvos de partida Ti:SiC:C en una proporción molar de 3:1,5:0,5. Se observó diferente formación de fase en la superficie y en el centro de las muestras. Finalmente, se propone una composición óptima de polvo de partida, relación molar, temperatura de sinterización y tiempo para la formación de la fase MAX de Ti3SiC2 de alta pureza. La mezcla seleccionada se estudió termodinámicamente y se propone un mecanismo de reacción para la formación de la fase MAX.
MAX phases are known for their excellent combination of both metallic (high electrical and thermal conductivity, machinability, high tolerance to damage) and ceramic (stiffness, good mechanical properties at high temperature, corrosion and oxidation resistance) properties [1]; hence, amongst other, these materials are promising candidates as high temperature components for both structural and functional applications [2]. These family of materials are defined like ternary compounds with a general formula of Mn+1AXn where M is an early transition metal, A is an element from groups IIIA and IVA of the periodic table, X either carbon or nitrogen and n a number between 1 and 3 [1,3]. They show a hexagonal crystalline structure (space group P63/mmc) where layers of the elements M and X are intercalated with a layer of the element A. Furthermore, due to their nanolaminated structure, MAX phases show good shock absorption resistance by the formation of kink bands. In particular, Ti3SiC2 presents low density (ρ=4.52g/cm3), high Young's modulus (E=339–343GPa) and higher fracture toughness than ceramics (KIC=5–20MPam1/2). Additionally, Ti3SiC2 has a good thermal and electrical conductivity (λ=34W/mK, σe=4.5×10⁶S/m) [3–6].
Titanium silicon carbide (Ti3SiC2) has been one of the most widely studied compounds of MAX phases. The difficulty in synthesizing high purity or single phase in either powder or bulk form has lead researchers to study different processing approaches and optimize its synthesis since Ti3SiC2 was firstly synthesized in the 1960s [7]. For bulk Ti3SiC2 samples some of the synthesis routes reported are summarized below. Goto and Hirai [8] reported on the synthesis of the MAX phase by chemical vapour deposition (CVD) using TiCl4, SiCl4 and CCl4 and applying an electronic current to a graphite substrate at deposition temperatures of 1300–1600°C. Barsoum and El-Raghy reported the synthesis of Ti3SiC2 by hot pressing (HP) [6] applying pressures of 40MPa at 1600°C starting from Ti, Si and C powders in a stoichiometric proportion of 3:1:2. Later, they published a work based on the synthesis of the MAX phase by hot isostatic pressing (HIP) [3] with temperatures ranging from 1450 to 1700°C applying 40MPa of pressure starting with a mixture containing SiC instead of elemental Si. They study the reaction path of the mixture proposing as intermediate phases during the synthesis TiCx and Ti3SiCx. Ti:Si:TiC mixtures in a molar ratio of 1:1:2 have been used by Gao et al. to obtain Ti3SiC2 through spark plasma sintering (SPS) [9], with pressures from 20 to 60MPa and temperatures between 1125 and 1400°C obtaining dense samples with a 2wt.% of TiC impurities. Through pulse discharge sintering (PDS) nearly full density Ti3SiC2 (99wt.%) has been obtained with TiC as a secondary phase and at a temperature range between 1200 and 1450°C [10].
Furthermore, the production of Ti3SiC2 powders has also been extensively investigated through different techniques. Sun et al. [11] obtained an 81wt.% of Ti3SiC2 through solid–liquid reaction (S–L) using NaF in the mixture of Ti, Si and graphite at 1300°C. Self-propagating high temperature synthesis (SHS) has also been studied as a cost efficient technique; El Saeed et al. obtained purity as high as 88% starting from a mixture of Ti:SiC:C with a molar ratio of 3:1.2:0.8 [12] obtaining TiC as secondary phase. Pressureless sintering (PS) has also been studied by Córdoba et al. [13] for the synthesis of MAX phase Ti3SiC2. In this work they studied different molar ratios and starting powders under Ar atmosphere obtaining up to a 98% purity at 1400°C. Most common starting point of these methods is the use of elemental powders of the MAX phase (Ti, Si, C) and carbides (SiC, TiC) in different molar ratios. Other works propose the formation of Ti3SiC2 by using titanium hydride (TiH2) as starting powder [14]. In these works, authors report a secondary or intermediate phase present during the synthesis, generally, titanium or silicon carbides and titanium silicides. An excess of silicon in the initial stoichiometric composition is a common strategy used for a higher purity of Ti3SiC2 in order to compensate the evaporation of Si during heat treatments [12,13,15] and therefore the formation of secondary phase TiC. Nevertheless, this excess Si has to be controlled since it can produce high amounts of titanium silicides (TiSi2, Ti5Si3). In addition, the presence of titanium carbide can be an indicator of a decomposition process of Ti3SiC2[16]. Also, other studies propose the addition of aluminium in the starting mixtures in low quantities to activate the reaction mechanism of the synthesis [17–20]. An overall important problematic of these techniques is the high temperatures needed, the sophisticated and expensive equipment required for high purity synthesis of Ti3SiC2 MAX phase and the low yield of MAX phase.
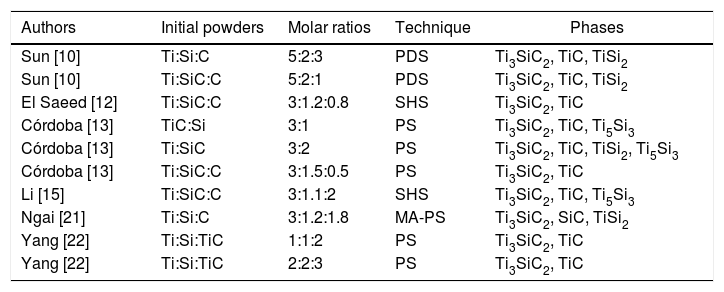
This work pretends to propose and study thoroughly a cost-efficient route (pressureless sintering) of MAX phase powder preparation with high purity content of Ti3SiC2 using a simple synthesis technique. For this purpose, different initial conditions in terms of starting powder and molar ratios have been analyzed and varied to achieve this objective, starting from initial mixtures based on the literature described in the previous paragraphs, summarized in Table 1, as well as novel ratios. In addition, the technique proposed allows for easy scaling-up process in order to be able to produce high amount of MAX phase in powder form. Finally, in order to understand the formation of the Ti3SiC2 phase, the ΔG of different possible reactions is calculated and a formation mechanism is proposed and discussed.
Summary of initial mixtures reported for successful synthesis of Ti3SiC2 used in this work.
| Authors | Initial powders | Molar ratios | Technique | Phases |
|---|---|---|---|---|
| Sun [10] | Ti:Si:C | 5:2:3 | PDS | Ti3SiC2, TiC, TiSi2 |
| Sun [10] | Ti:SiC:C | 5:2:1 | PDS | Ti3SiC2, TiC, TiSi2 |
| El Saeed [12] | Ti:SiC:C | 3:1.2:0.8 | SHS | Ti3SiC2, TiC |
| Córdoba [13] | TiC:Si | 3:1 | PS | Ti3SiC2, TiC, Ti5Si3 |
| Córdoba [13] | Ti:SiC | 3:2 | PS | Ti3SiC2, TiC, TiSi2, Ti5Si3 |
| Córdoba [13] | Ti:SiC:C | 3:1.5:0.5 | PS | Ti3SiC2, TiC |
| Li [15] | Ti:SiC:C | 3:1.1:2 | SHS | Ti3SiC2, TiC, Ti5Si3 |
| Ngai [21] | Ti:Si:C | 3:1.2:1.8 | MA-PS | Ti3SiC2, SiC, TiSi2 |
| Yang [22] | Ti:Si:TiC | 1:1:2 | PS | Ti3SiC2, TiC |
| Yang [22] | Ti:Si:TiC | 2:2:3 | PS | Ti3SiC2, TiC |
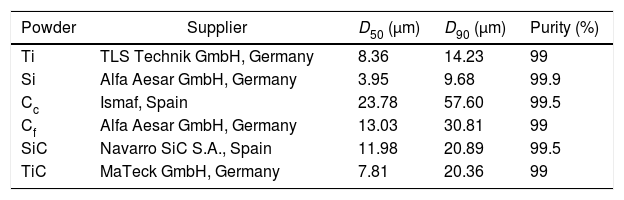
Synthesis of the MAX phase Ti3SiC2 was studied starting from commercially available elemental powders and carbides, summarized in Table 2. Particle size distribution was obtained by laser diffraction obtaining mean particle size of the powders represented in number (MasterSizer2000, Malvern Instruments, UK). In addition, initial powders micrographs are shown in Fig. 1. All powders have an irregular morphology except for titanium powders that have spherical shape. Moreover, two types of graphite have been used, nomenclature stands for their particle size distribution: Cc for a coarser powder and Cf for fine particles.
Detailed list of initial powders used and their characterization.
| Powder | Supplier | D50 (μm) | D90 (μm) | Purity (%) |
|---|---|---|---|---|
| Ti | TLS Technik GmbH, Germany | 8.36 | 14.23 | 99 |
| Si | Alfa Aesar GmbH, Germany | 3.95 | 9.68 | 99.9 |
| Cc | Ismaf, Spain | 23.78 | 57.60 | 99.5 |
| Cf | Alfa Aesar GmbH, Germany | 13.03 | 30.81 | 99 |
| SiC | Navarro SiC S.A., Spain | 11.98 | 20.89 | 99.5 |
| TiC | MaTeck GmbH, Germany | 7.81 | 20.36 | 99 |
 Ti, (b) Si, (c) coarse graphite (Cc), (d) fine graphite (Cf), (e) SiC and (f) TiC.")
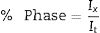
Different mixtures were prepared, varying initial powders, powder particle size and molar ratios. Each powder combination was mixed in a Turbula shaker mixer (WAB, Switzerland) for 1h and compacted uniaxially at 200MPa to obtain discs of 16mm diameter and 3mm thickness. Green samples were heat treated in an alumina crucible with heating and cooling rates of 5°C/min up to the selected heat treatment temperature for 2h; vacuum atmosphere (2.5×10⁻⁵bar) was employed (HVT-15/50/450, Carbolite, UK). Heat treated samples were analyzed by X-ray diffractometry (XRD, Philips X’pert, Netherlands) with Cu Kα radiation at 40kV and 40mA as well as scanning electron microscopy (SEM, XL-30 Philips, US) coupled with energy-dispersive X-ray spectroscopy (EDS, EDAX, US) in order to study and quantify the phases present after the thermal cycle. XRD spectra can be found as supplementary information. Due to the layered structure of Ti3SiC2, prior to quantification it was verified that the relative intensities of XRD peaks were consistent with random orientation. Quantification of phases was calculated as reported elsewhere [13], using Eq. (1), where Ix is the integrated area of most intense peak of the phase to be analyzed (Ti3SiC2 (104), Ti8C5 (024), TiC (200), Ti5Si3 (211), TiSi2 (131), SiC (111) and C (002)) and It the total sum of the integrated area of most intense peak for all representative present phases. Integrated areas were calculated by least-square procedure. These calculated percentages were compared to Rietveld refinement to study the validity of this quantification method.
After heat treatment, selected samples were crushed in an agate mortar and studied thoroughly comparing the XRD patterns and SEM micrographs of powders obtained with those of the bulk sample surface. Differential thermal analysis (DTA, SETSYS Evolution, SETARAM Instrumentation, France) was performed at a heating rate of 10°C/min to 1500°C to study the reaction. Furthermore, reaction mechanism and intermediate phase reactions have been studied by thermodynamic calculations of ΔG using Thermo-Calc software (Sweden) with database SSOL5 and SSUB5 [23].
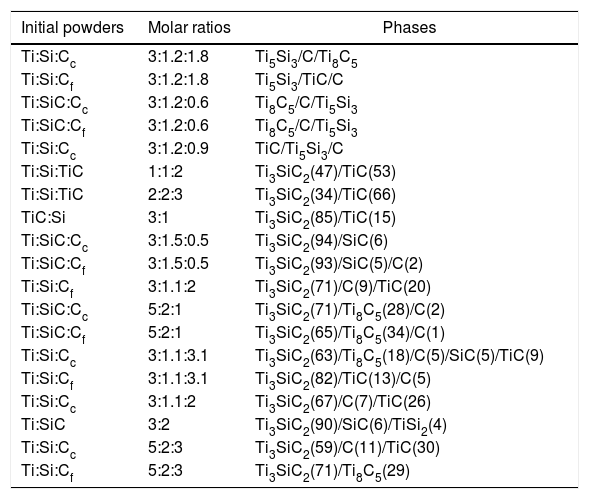
Results and discussionsEffect of initial powder molar ratio and surface diffusion on phase constitutionIn order to be able to narrow down and determine optimal powder ratios, different mixtures of powders and molar ratios were produced. As commented in the introduction, these mixtures were selected attending to previous reported work using different synthesis techniques [10,12,13,15,21,22] as well as self-established ratios. Table 3 shows the detected phases for mixtures prepared with different molar ratios, initial powders and graphite size. In order to reduce the number of variables, the heat treatment temperature was set to 1300°C for 2h, with the objective of studying in depth the compositions with higher formation or MAX phase at these conditions. Although this temperature might not be the optimum for some of the mixtures prepared, it is selected as a relatively low temperature compared to reported synthesis conditions presented previously.
List of initial compositions, molar ratios and phases present (XRD) after heat treatment at 1300°C for 2h in vacuum atmosphere. Graphite nomenclature stands for c (coarse) and f (fine), according to their powder size distribution. In brackets, calculated amount of phase for mixtures with Ti3SiC2 formation.
| Initial powders | Molar ratios | Phases |
|---|---|---|
| Ti:Si:Cc | 3:1.2:1.8 | Ti5Si3/C/Ti8C5 |
| Ti:Si:Cf | 3:1.2:1.8 | Ti5Si3/TiC/C |
| Ti:SiC:Cc | 3:1.2:0.6 | Ti8C5/C/Ti5Si3 |
| Ti:SiC:Cf | 3:1.2:0.6 | Ti8C5/C/Ti5Si3 |
| Ti:Si:Cc | 3:1.2:0.9 | TiC/Ti5Si3/C |
| Ti:Si:TiC | 1:1:2 | Ti3SiC2(47)/TiC(53) |
| Ti:Si:TiC | 2:2:3 | Ti3SiC2(34)/TiC(66) |
| TiC:Si | 3:1 | Ti3SiC2(85)/TiC(15) |
| Ti:SiC:Cc | 3:1.5:0.5 | Ti3SiC2(94)/SiC(6) |
| Ti:SiC:Cf | 3:1.5:0.5 | Ti3SiC2(93)/SiC(5)/C(2) |
| Ti:Si:Cf | 3:1.1:2 | Ti3SiC2(71)/C(9)/TiC(20) |
| Ti:SiC:Cc | 5:2:1 | Ti3SiC2(71)/Ti8C5(28)/C(2) |
| Ti:SiC:Cf | 5:2:1 | Ti3SiC2(65)/Ti8C5(34)/C(1) |
| Ti:Si:Cc | 3:1.1:3.1 | Ti3SiC2(63)/Ti8C5(18)/C(5)/SiC(5)/TiC(9) |
| Ti:Si:Cf | 3:1.1:3.1 | Ti3SiC2(82)/TiC(13)/C(5) |
| Ti:Si:Cc | 3:1.1:2 | Ti3SiC2(67)/C(7)/TiC(26) |
| Ti:SiC | 3:2 | Ti3SiC2(90)/SiC(6)/TiSi2(4) |
| Ti:Si:Cc | 5:2:3 | Ti3SiC2(59)/C(11)/TiC(30) |
| Ti:Si:Cf | 5:2:3 | Ti3SiC2(71)/Ti8C5(29) |
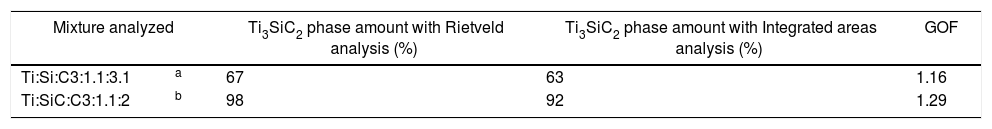
To validate the method used for the quantification of phases, which uses the integrated area of the most representative peaks, a Rietveld refinement was performed on selected diffractograms to determine and compare the adjustment of this technique. Results for both methods as well as goodness of fit (GOF) value of the Rietveld analysis are shown in Table 4; GOF is a quality value and it is established that for values between 1.09 and 1.28 there is a good refinement [24]. Rietveld refinement shows a similar phase constitution as the calculated with the integrated areas, with a maximum difference of 6% in phase constitution. Although 6% can be a high difference, all results for Rietveld refinement show higher purity than the studied with integrated area. Taking into account that Rietveld analysis might yield a higher purity, integrated area analysis is considered as a valid method and used for further quantification.
Regarding initial molar ratios, it is noticeable how selecting optimal molar ratios is essential to ensure MAX phase formation. From the phase quantifications performed and shown in Table 3, it can be seen that near stoichiometry ratios tend to have a higher Ti3SiC2 content during the synthesis. Furthermore, as commented previously, increasing the amount of atomic percentage of silicon also increases MAX phase formation due to the sublimation during heat treatment at high temperatures [12,13,15]. The influence of graphite particle size is not clear since, depending on the mixture, it appears to either increase or reduce the amount of MAX phase formation. From these results three different mixtures were selected for further analysis (Ti:Si:Cf=3:1.1:3.1, Ti:SiC=3:2 and Ti:SiC:Cc=3:1.5:0.5) attending to the final content of Ti3SiC2 and intermediate phases produced during the synthesis.
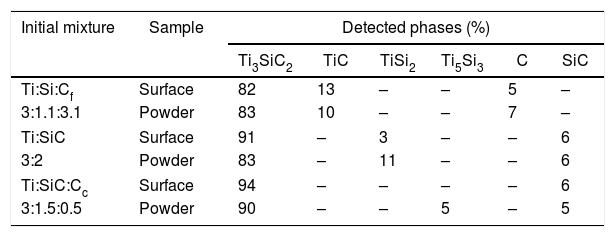
In addition to initial molar ratios, diffusion also plays an important role on the samples’ final phase constitution. Detected phases on the surface of the samples often differ from those present on the interior of the sample [25]. Selected mixtures, according to the amount of Ti3SiC2 phase formed, were crushed into powders to study and identify the phases present in the internal zone of the sample (Table 5 and Fig. 2). As expected, diffusion on the surface of samples is different than at the centre. Generally, there is a loss of purity in the synthesis and in some cases, new phases appear that are not present on the surface (Ti5Si3). These new phases are intermediate products produced during the synthesis process, corroborating the diffusion difference between zones in the sample. Decrease in purity is observed once powders are obtained (Table 5) for samples Ti:SiC=3:2 and Ti:SiC:Cc=3:1.5:0.5. However, for mixture Ti:Si:Cf with a molar ratio of 3:1.1:3.1 there is a small increase on the final amount of Ti3SiC2 in the powder. This can be due to the higher reactivity of elemental silicon, having in this case a better diffusion compared to the SiC, which is present in the other mixtures studied.
Quatification of detected phases (XRD) present in selected mixtures (surface and powders) after heat treatment in vacuum atmosphere at 1300°C temperature for 2h.
| Initial mixture | Sample | Detected phases (%) | |||||
|---|---|---|---|---|---|---|---|
| Ti3SiC2 | TiC | TiSi2 | Ti5Si3 | C | SiC | ||
| Ti:Si:Cf | Surface | 82 | 13 | – | – | 5 | – |
| 3:1.1:3.1 | Powder | 83 | 10 | – | – | 7 | – |
| Ti:SiC | Surface | 91 | – | 3 | – | – | 6 |
| 3:2 | Powder | 83 | – | 11 | – | – | 6 |
| Ti:SiC:Cc | Surface | 94 | – | – | – | – | 6 |
| 3:1.5:0.5 | Powder | 90 | – | – | 5 | – | 5 |
 Ti:Si:Cf=3:1.1:3.1, (b) Ti:SiC=3:2 and (c) Ti:SiC:Cc=3:1.5:0.5 of surface (left) and powders (right).")
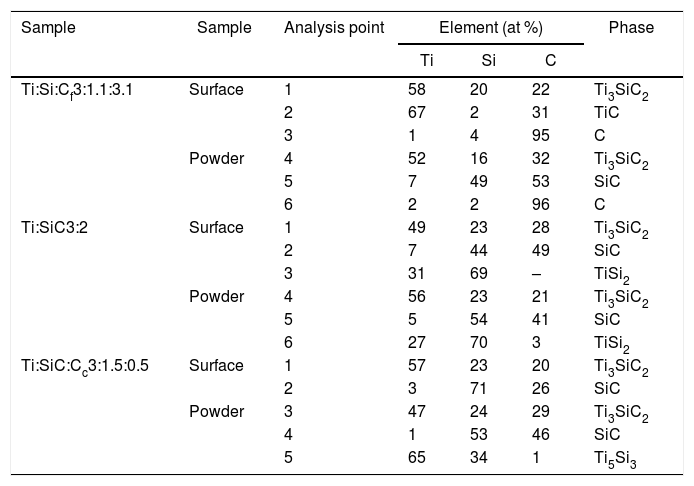
From micrographs in Fig. 2 it is clear how there is a different reaction mechanism occurring depending on the starting mixture. Point analysis results are shown in Table 6. For mixture (a) (Ti:Si:Cf=3:1.1:3.1) the formation of the MAX phase is combined with second phases of TiC and C that has not reacted, according to XRD. In the microstructure (Fig. 2a) a lighter majoritarian phase is observed, corresponding to Ti3SiC2, and also secondary darker phases can be seen (Points 2, 3, 5 and 6 in Fig. 2a) which probably correspond to TiC, C and SiC, respectively, attending to EDS analysis. The presence of TiC during the synthesis of Ti3SiC2 from elemental powders can be either an intermediate product prior to the formation of the Ti3SiC2 phase, or a result of its decomposition [16]. Examination of the milled powder shows the presence of SiC (Point 5 in Fig. 2a); however, this phase was not detected by XRD. Unreacted graphite was detected both in the surface and in the milled powder, suggesting that the initial powder ratios where not optimal. Therefore, this starting composition is disregarded as an optimal mixture.
EDS point analysis of mixtures Ti:Si:Cf=3:1.1:3.1, Ti:SiC=3:2 and Ti:SiC:Cc=3:1.5:0.5 for points shown in Fig. 2.
| Sample | Sample | Analysis point | Element (at %) | Phase | ||
|---|---|---|---|---|---|---|
| Ti | Si | C | ||||
| Ti:Si:Cf3:1.1:3.1 | Surface | 1 | 58 | 20 | 22 | Ti3SiC2 |
| 2 | 67 | 2 | 31 | TiC | ||
| 3 | 1 | 4 | 95 | C | ||
| Powder | 4 | 52 | 16 | 32 | Ti3SiC2 | |
| 5 | 7 | 49 | 53 | SiC | ||
| 6 | 2 | 2 | 96 | C | ||
| Ti:SiC3:2 | Surface | 1 | 49 | 23 | 28 | Ti3SiC2 |
| 2 | 7 | 44 | 49 | SiC | ||
| 3 | 31 | 69 | – | TiSi2 | ||
| Powder | 4 | 56 | 23 | 21 | Ti3SiC2 | |
| 5 | 5 | 54 | 41 | SiC | ||
| 6 | 27 | 70 | 3 | TiSi2 | ||
| Ti:SiC:Cc3:1.5:0.5 | Surface | 1 | 57 | 23 | 20 | Ti3SiC2 |
| 2 | 3 | 71 | 26 | SiC | ||
| Powder | 3 | 47 | 24 | 29 | Ti3SiC2 | |
| 4 | 1 | 53 | 46 | SiC | ||
| 5 | 65 | 34 | 1 | Ti5Si3 | ||
For Ti:SiC=3:2 (mixture (b) in Fig. 2), XRD shows the presence of SiC and TiSi2 in addition to Ti3SiC2, and this is in accordance with the microstructure observed by SEM. However, in the SEM micrographs, a great difference can be observed between the phases detected at the surface, where a large amount of secondary darker phase can be distinguished, and the milled powder, where less amount of this secondary phase is observed. The presence of intermediate phases such as TiSi2 suggests that the synthesis of Ti3SiC2 could be optimized with this initial powder ratio, by adjusting the thermal cycle. However, due to the large differences between the microstructures observed and the amount of MAX phase present in the milled powders and in the surface, this mixture was not considered for further optimization.
A good candidate is mixture Ti:SiC:Cc=3:1.5:0.5 (mixture (c) in Fig. 2) since there is a high amount of Ti3SiC2 phase both at the surface and in the milled powders (Points 1 and 2 in Fig. 2c). At the surface it can be observed how the only secondary phase present is SiC (Point 2 in Fig. 2c, darker zones in the micrographs), that exists in lower amount compared to Ti:SiC=3:2. Analyzing the microstructure of the milled powders it can be seen how the lighter phase predominates, corresponding to MAX phase Ti3SiC2. Darker zones correspond to SiC that still is present from the initial powder mixture (Point 4 in Fig. 2c), but in a low amount. Another intermediate phase is present in the powders due to the different diffusion mechanism depending on the zone of the sample. From EDS analysis it can be deduced that this phase corresponds to Ti5Si3 (Point 5 in Fig. 2c). The absence of remnant graphite from the initial mixture and the intermediate phases present suggest that the formation of MAX phase is incomplete but still possible, an adjustment of the thermal cycle could further enhance the formation of Ti3SiC2 for this molar ratio. Therefore, this molar ratio was selected for further optimization and study of the synthesis mechanism.
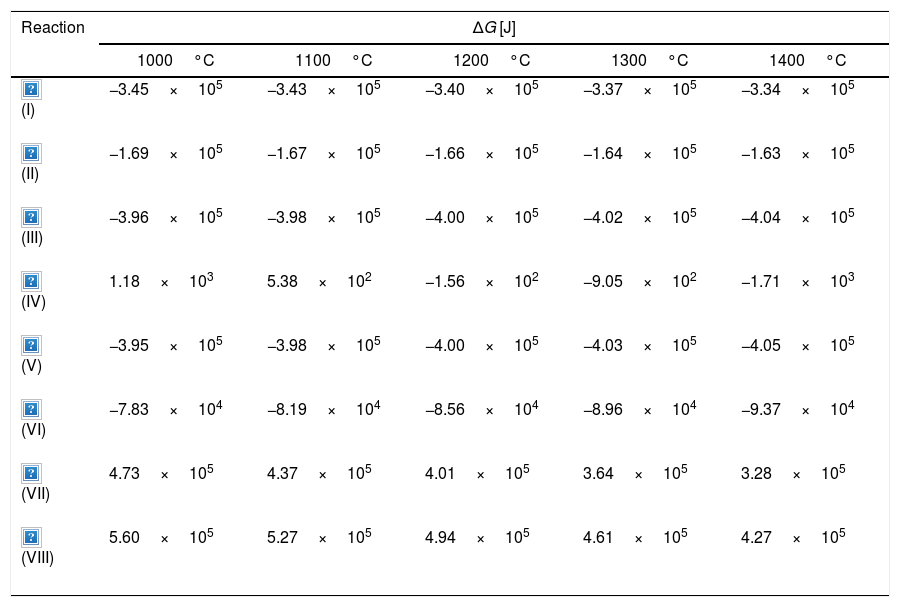
Reaction mechanism of the Ti3SiC2 synthesisThere are different intermediate reactions that can be occurring during the synthesis process, some of them are shown in Table 7, together with their calculated ΔG. These proposed reactions have been calculated in concordance with the secondary/intermediate phases obtained during the synthesis. According to the thermodynamic calculations performed using Thermo-Calc, over 1000°C all of the reactions are spontaneous, with the exception of reaction Ti+2SiC→TiSi2+2C, that is spontaneous over 1200°C, and reactions (VII) and (VIII) that are not favourable for all temperatures. The first reaction presented corresponds to the formation of the MAX phase from the initial powder mixture that has been selected for optimization. This powder mixture starts from Ti, SiC and C to produce Ti3SiC2; this reaction is spontaneous for all temperatures analyzed, so it could be a possible formation mechanism. The reactions and ΔG for the formation of intermediate compounds Ti5Si3 and TiSi2 are also presented. The ΔG for the formation of these compounds is in the same order of magnitude and slightly more negative than the formation of Ti3SiC2, with the exception of the formation of TiSi2 from Ti and SiC. Therefore, it is energetically favourable that these compounds will form as secondary phases, as observed previously. The reaction products of the formation of these secondary phases, include C, that could promote the formation of Ti3SiC2 at other stages of the synthesis.
Gibbs free energy calculation of different possible reactions during the synthesis process at temperature range from 1000°C to 1400°C.
| Reaction | ΔG [J] | ||||
|---|---|---|---|---|---|
| 1000°C | 1100°C | 1200°C | 1300°C | 1400°C | |
| −3.45×10⁵ | −3.43×10⁵ | −3.40×10⁵ | −3.37×10⁵ | −3.34×10⁵ | |
| −1.69×10⁵ | −1.67×10⁵ | −1.66×10⁵ | −1.64×10⁵ | −1.63×10⁵ | |
| −3.96×10⁵ | −3.98×10⁵ | −4.00×10⁵ | −4.02×10⁵ | −4.04×10⁵ | |
| 1.18×10³ | 5.38×10² | −1.56×10² | −9.05×10² | −1.71×10³ | |
| −3.95×10⁵ | −3.98×10⁵ | −4.00×10⁵ | −4.03×10⁵ | −4.05×10⁵ | |
| −7.83×10⁴ | −8.19×10⁴ | −8.56×10⁴ | −8.96×10⁴ | −9.37×10⁴ | |
| 4.73×10⁵ | 4.37×10⁵ | 4.01×10⁵ | 3.64×10⁵ | 3.28×10⁵ | |
| 5.60×10⁵ | 5.27×10⁵ | 4.94×10⁵ | 4.61×10⁵ | 4.27×10⁵ | |
Differential thermal analysis (DTA) was carried out to the mixture Ti/SiC/Cc with a molar ratio of 3:1.5:0.5 to understand further the reaction mechanism (Fig. 3a). It can be seen that there is a big range of temperatures where a phase transformation is happening and for further analysis, compacted samples were heat treated at these different temperatures to identify the phases present after each thermal treatment performed under vacuum atmosphere for 6h. Evolution of calculated phases obtained from XRD analysis is shown in Fig. 3b. It is observed that at 1000°C elemental titanium, from the starting mixture, has fully reacted to form TiC and intermetallic Ti5Si3; and MAX phase Ti3SiC2 begins to form. Indeed, ΔG calculation presented in Table 7 corroborated that the formation of Ti5Si3 is energetically favourable at this temperature. With the increase of temperature there is a higher amount of formation of MAX phase Ti3SiC2 and a decrease in the amount of the intermediate phases. In addition, graphite has completely reacted at 1300°C and no more graphite appears to be present at higher temperatures. TiC that forms during the initial stages of the synthesis process is not detected at 1300°C and, subsequently, at 1400°C is again detected. This is in concordance with work reported by other authors [16] where the presence of TiC as final element when this phase is not present in the initial mixture is an indication of a possible decomposition of the Ti3SiC2 phase. The amount of Ti3SiC2 synthesized in the mixture increases with temperature and reaches the highest at 1300°C. Graphite, SiC and Ti5Si3 slowly decrease with the increase of temperature as a sign of a reaction with the rest of elements. TiC and Ti5Si3 are the two intermediate phases formed at 1000°C in this representation of the synthesis process. These intermediate phases react with the rest of phases (C and SiC) present to form the MAX phase. At 1300°C TiSi2 starts to be present as an intermediate product of the synthesis and this is also in concordance with the ΔG calculations performed where this subproduct reaction begins to be spontaneous at 1200°C.
 DTA analysis of mixture Ti:SiC:Cc with a molar ratio of 3:1.5:0.5 and (b) phase evolution obtained by XRD profiles after a heat treatment under vacuum atmosphere for 6h at different temperatures (a – 1000°C, b – 1100°C, c – 1200°C, d – 1300°C, e – 1400°C).")
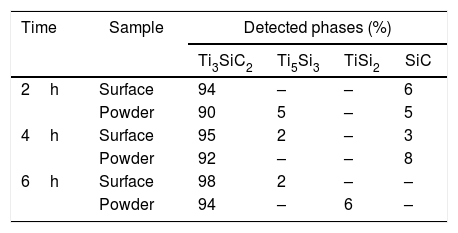
Considering that the highest amount of Ti3SiC2 was obtained from the selected mixture at a temperature of 1300°C, this was established as the optimum synthesis temperature. Subsequently, isothermal holding times were varied, to further study the reaction mechanism. In this case, time was increased from 2h to 4 and 6h and, as before, bulk sample surface and powders were analyzed to study diffusion differences. Table 8 shows the influence that the isothermal holding time has on the synthesis of Ti3SiC2 through XRD analysis of the samples. Formation of the MAX phase is higher with the increment of time. Up to a 94% of Ti3SiC2 is obtained for a heat treatment temperature of 1300°C and an isothermal time of 6h. Micrographs in Fig. 4 show how from SiC powders a phase transformation occurs, where in a first stage the intermediate phase Ti5Si3 is formed. The reaction of SiC with Ti to form Ti5Si3 (reaction (III) in Table 7) is thermodynamically favourable for all the temperature range studied. Subsequently transforms Ti5Si3 into Ti3SiC2 by reaction with SiC and TiC (reaction (VI) in Table 7) which are also thermodynamically favourable. At higher times, there is a complete transformation of SiC into the intermediate phase TiSi2 and MAX phase with no presence of TiC, a phase generally present when the decomposition of Ti3SiC2 occurs [16]. The formation of TiSi2 at 1300°C is in concordance with the thermodynamic calculations preformed that corroborate that it is energetically favourable for temperatures above 1200°C (reaction (IV) in Table 7). Reactions of the intermediate phases to yield Ti3SiC2 and Si(g) (reactions (VII) and (VIII) in Table 7) do not seem to be energetically favourable, and therefore are not proposed as a synthesis mechanism.
 and powders (right) of the samples Ti:SiC:Cc with a molar ratio of 3:1.5:0.5 heat treated at 1300°C for different holding times: (a) 2h, (b) 4h and (c) 6h.")
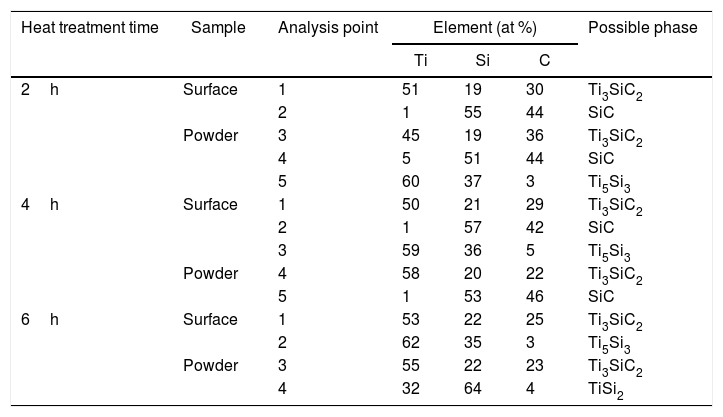
Microstructures of the surface and the powders for the different holding times at 1300°C were studied (as shown in Fig. 4) and composition of the phases present was analyzed by EDS (Point analysis in Table 9). Synthesis for 2h at 1300°C, as discussed in the section “Reaction mechanism of the Ti3SiC2 synthesis”, shows a majority of a lighter phase corresponding to Ti3SiC2 (Points 1 and 3 in Fig. 4a) with different second phases. In the surface analysis, there is only presence of a darker phase that corresponds to SiC (Point 2 in Fig. 4). Analyzing milled powders, there are two different darker phases corresponding to SiC and Ti5Si3 (Points 4 and 5 in Fig. 4a, respectively). By increasing the holding time to 4h it can be seen how the amount of SiC (Points 2 and 5 in Fig. 4b) is lower because of its transformation into Ti3SiC2 (Points 1 and 4 in Fig. 4b), corresponding to the lighter phase. Again, an intermediate phase appears as a sign of an incomplete transformation into Ti3SiC2 (Point 5 in Fig. 4b) that corresponds to Ti5Si3. In Fig. 4c the holding time was increased to 6h, and it can be seen how there is an almost complete transformation to Ti3SiC2 (lighter phase Points 1 and 3). There is a difference in the intermediate phases detected considering surface and powders (Points 2 and 4 in Fig. 4c) analyzed corresponding to Ti5Si3 and TiSi2 for the surface and powder, respectively, nevertheless the formation of both phases is energetically favourable. It is possible that the addition of C into the starting mixture could enhance the formation of MAX phase with these processing conditions. Nevertheless, the purity reached for this synthesis (94%), with the condition proposed is considered optimal. Although this value is lower than the obtained by Córdoba et al. also by pressureless sintering (98%), in their work they study the synthesis of different mixtures using 100mg of the initial powders and a more complex synthesis route. In our case, we have developed an easy to scale process also through a simple technique.
EDS point analysis of mixture Ti:SiC:Cc=3:1.5:0.5 heat treated at 1300°C for points shown in Fig. 4.
| Heat treatment time | Sample | Analysis point | Element (at %) | Possible phase | ||
|---|---|---|---|---|---|---|
| Ti | Si | C | ||||
| 2h | Surface | 1 | 51 | 19 | 30 | Ti3SiC2 |
| 2 | 1 | 55 | 44 | SiC | ||
| Powder | 3 | 45 | 19 | 36 | Ti3SiC2 | |
| 4 | 5 | 51 | 44 | SiC | ||
| 5 | 60 | 37 | 3 | Ti5Si3 | ||
| 4h | Surface | 1 | 50 | 21 | 29 | Ti3SiC2 |
| 2 | 1 | 57 | 42 | SiC | ||
| 3 | 59 | 36 | 5 | Ti5Si3 | ||
| Powder | 4 | 58 | 20 | 22 | Ti3SiC2 | |
| 5 | 1 | 53 | 46 | SiC | ||
| 6h | Surface | 1 | 53 | 22 | 25 | Ti3SiC2 |
| 2 | 62 | 35 | 3 | Ti5Si3 | ||
| Powder | 3 | 55 | 22 | 23 | Ti3SiC2 | |
| 4 | 32 | 64 | 4 | TiSi2 | ||
From these results, analyzing the variation of isothermal times during the heat treatment, it is possible to establish a reaction mechanism that explains the transformation process with time. Powder analysis after 2h of heat treatment shows that, in addition to Ti3SiC2, the intermediate phases found are SiC, which is present in the initial mixture, and Ti5Si3 which is formed according to reaction (III) from Table 7. Increasing heat treatment time to 6h the phases present are Ti3SiC2 and TiSi2. Therefore, SiC has reacted with Ti5Si3 to form Ti3SiC2, according to Eq. (VI) in Table 7, with impurities of TiSi2. Along with the Ti3SiC2 that has already been formed at 2h (probably according to reaction (I) in Table 7 which is also thermodynamically favourable). The intermediate phases present at this holding time react to produce more Ti3SiC2 and TiSi2 (reaction (VI) in Table 7) that is not formed at lower times and temperatures.
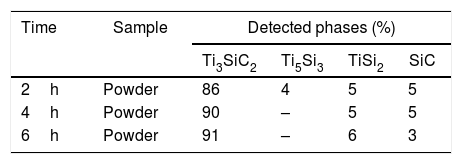
Effect of graphite particle size in the synthesis of Ti3SiC2In order to analyze the influence of graphite particle size in the initial mixture during the synthesis process, initial mixture of Ti:SiC:C with a molar ratio of 3:1.5:0.5 starting with smaller graphite particle size (D50=13.03μm) was prepared. In this case, the heat treatment temperature was set to 1300°C and the synthesis process was analyzed with the increase of holding times, as done in the section “Reaction mechanism of the Ti3SiC2 synthesis”. It is possible to observe from the phase calculations shown in Table 10 how the amount of MAX phase synthesized increases with the increase of isothermal time. Although, in this case, at 6h there is still presence of SiC in the final powders.
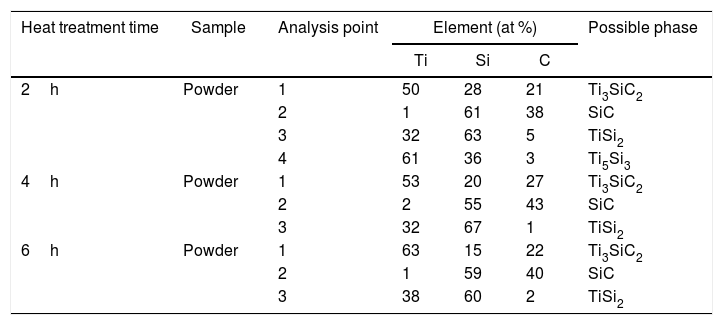
From micrographs, shown in Fig. 5, it is possible to see the same tendency as analyzed before for the mixture with coarser graphite. At 2h darker areas can be seen that are intermediate phases corresponding to SiC, TiSi2 and Ti5Si3 (Points 2, 3 and 4, respectively, in Fig. 5a). At 4h, intermediate phase Ti5Si3 is no longer seen as confirmed by XRD results and EDS analysis, as reported before in the proposed mechanism, this phase reacts with SiC to form Ti3SiC2 and TiSi2. These two phases (SiC and TiSi2) are present in the final powders, Points 2 and 3 in Fig. 5b. Increasing the time up to 6h for this mixture with a finer graphite does not enhance the Ti3SiC2 synthesis as studied before. It can be seen how there is still presence of SiC in the final powders as well as intermediate phase TiSi2 (Points 2 and 3 in Fig. 5c). Although phase transformation has not been complete as in the case of Ti:SiC:Cc, there is still a majority of a lighter phase corresponding to Ti3SiC2 (Point 1 in Fig. 5) in the final powders (all EDS point analysis are summarized in Table 11). Fig. 6 shows the evolution of detected phases of XRD phase analysis, shown in Tables 8 and 9, for different holding times during the heat treatment process of the two graphite particle sizes analyzed. Comparing these results, it can be seen that the amount of Ti3SiC2 formed during the synthesis is of great purity even for the finer graphite (91% at 6h), but there is a clear difference between both mixtures in terms of secondary phases and final purity. Particle size in the initial mixture does affect to the synthesis process of MAX phase Ti3SiC2. In this case, a coarser graphite enhances the synthesis of the MAX phase. In terms of difference between the powders, both of the graphite powders used have a flake-like morphology. Regarding purity, the coarser powders have a higher purity (as showed in Table 1), however, this does not seem to be a determining factor in the synthesis process. Analyzing these results and comparing them to Table 3, it appears that when elemental Si is used as starting powder, the particle size of C has a larger influence on the amount of MAX phase produced. In this case, is more beneficial to use a finer particle size distribution of graphite. On the other hand, when silicon carbide is used in the initial mixture (as for the final mixture selected) there is a smaller influence on the particle size of graphite, but in all cases the use of coarser C seems to favour MAX phase formation. These effects might be due to the reactivity of finer powders that are more critical when using elemental powders in the starting mixture (i.e. Si). When a more chemically stable compound is selected, as SiC, the particle size of C is not as determinant. Nevertheless, for SiC in the starting mixture it appears that the use of coarser graphite yields a slightly higher amount of MAX phase. According to XRD results (Fig. 3b), when SiC is used in the starting mixture, even after 2h at 1000°C all the Ti present has reacted to form TiC, Ti5Si3, and Ti3SiC2, since these are the only Ti containing phases and no elemental Ti is present. Reactions (I), (II), (III) and (V) in Table 7 for the reaction of Ti are all thermodynamically favourable at this temperature. It is possible that, when SiC is present, instead of Si, the size of C does not affect significantly due to the high stability of the compound TiC, and C is mostly consumed by reaction with Ti to form TiC. When elemental Si is used, there are more competing reactions and hence a finer more reactive C particle size favours a higher reaction to form Ti3SiC2.
 2h, (b) 4h and (c) 6h.")
EDS point analysis of mixture Ti:SiC:Cf=3:1.5:0.5 heat treated at 1300°C for points shown in Fig. 5.
| Heat treatment time | Sample | Analysis point | Element (at %) | Possible phase | ||
|---|---|---|---|---|---|---|
| Ti | Si | C | ||||
| 2h | Powder | 1 | 50 | 28 | 21 | Ti3SiC2 |
| 2 | 1 | 61 | 38 | SiC | ||
| 3 | 32 | 63 | 5 | TiSi2 | ||
| 4 | 61 | 36 | 3 | Ti5Si3 | ||
| 4h | Powder | 1 | 53 | 20 | 27 | Ti3SiC2 |
| 2 | 2 | 55 | 43 | SiC | ||
| 3 | 32 | 67 | 1 | TiSi2 | ||
| 6h | Powder | 1 | 63 | 15 | 22 | Ti3SiC2 |
| 2 | 1 | 59 | 40 | SiC | ||
| 3 | 38 | 60 | 2 | TiSi2 | ||
 Ti:SiC:Cc and (b) Ti:SiC:Cf powders with a molar ratio of 3:1.5:0.5 heat treated at 1300°C for 2, 4 and 6h.")
Ti3SiC2 has been successfully synthesized through pressureless sintering for powder production of this MAX phase. Different conditions of the synthesis have been studied such as, initial compositions (molar ratios, initial powder, particle size) and heat treatment conditions (atmosphere, temperature, time). An optimal synthesis route is proposed with starting powder of Ti:SiC:Cc with a molar ratio of 3:1.5:0.5. The effect on graphite particle size has been studied for this mixture. For the mixture selected, graphite size does not have a significant effect, however, using a coarser graphite enhances slightly the formation of the MAX phase. It has been determined that for mixtures starting from elemental silicon, using a finer particle size of C will be beneficial for the Ti3SiC2 synthesis, probably due to the higher reactivity of elemental Si as compared to SiC. A heat treatment cycle at 1300°C for 6h under vacuum has been the optimal process for the selected mixture, reaching up to a 94% of Ti3SiC2 in an easy to scale-up process. Thermodynamic calculations have been performed and intermediate reactions for the synthesis of MAX phase are proposed considering the intermediate phases observed during the synthesis. A thermodynamically favourable mechanism for the formation of Ti3SiC2 is proposed, were intermediate phases of Ti5Si3 and SiC react to form Ti3SiC2 and TiSi2, in concordance with the evolution of phases observed during the heat treatment process.
The authors would like to thank the funding provided for this research by the Regional Government of Madrid (Dir. Gral. Universidades e Investigación) through the project P2018/NMT4411 (ADITIMAT-CM), the Spanish Government through the Ramón y Cajal contract RYC-2014-15014 and the project MAT2012-38650-C02-01.
The following are the supplementary data to this article:

