


This research consists of the fabrication of synthetic gels of hydrated calcium silicate (C-S-H gel) and hydrated calcium aluminate silicates (C-A-S-H gel) in aqueous solution oversaturated in calcium hydroxide. These gels were fabricated using nanomaterials with different specific surface area; two nanosilicas (NS), OX50 and A200 (50 and 200m2/g respectively) and two nanoaluminas (NA), A65 and A130 (65 and 130m2/g). Mixtures were carried out maintaining a Ca/Si=2 ratio and variable Al/Si ratios of 0.1, 0.5 and 1. The effect of aluminium incorporation in the C-S-H gel was studied using the nuclear magnetic resonance technique (29Si MAS-NMR), and the information obtained was further processed using the mathematical deconvolution method. Chemical shift bands were delimited to identify the structures. From the results obtained, modifications of the tetrahedral (Qn) in the dreierketten structure were observed in the different combinations, as well as the modification of the bridging tetrahedral (Q2b) due to the presence of aluminium replacing the silica bridging tetrahedron Q2b(1Al). High Q4 values were detected in the C-S-H gel with NS OX50 and this could be associated to a double chain formation very similar to a perfect tobermorite. The length of the mean chains (MCL) was very variable in each blend, but some trends were observed as the Al/Si=1 ratio and the Al/Si=0.1 ratio maintain or increases the MCL respectively. The results are interesting and concrete case mixtures with NS OX50 show original trends that have not yet been reported in the literature.
Esta investigación consiste en la fabricación de geles sintéticos de silicato de calcio hidratado (gel C-S-H) y de silicatos de aluminato de calcio hidratados (gel C-A-S-H) en solución acuosa sobresaturada en hidróxido de calcio. Estos geles se fabricaron utilizando nanomateriales con diferente superficie específica; dos nanosílicas (NS), OX50 y A200 (50 y 200m2/g respectivamente) y dos nanoaluminas (NA), A65 y A130 (65 y 130m2/g). Las mezclas se realizaron manteniendo una relación Ca/Si=2 y proporciones variables de Al/Si de 0,1, 0,5 y 1. El efecto de la incorporación de aluminio en el gel C-S-H se estudió mediante la técnica de resonancia magnética nuclear (29Si MAS-NMR), y la información obtenida se procesó posteriormente mediante el método de deconvolución matemática. Se delimitaron las bandas de desplazamiento químico para identificar las estructuras. A partir de los resultados obtenidos, se observaron modificaciones del tetraedro (Qn) en la estructura dreierketten en las diferentes combinaciones, así como la modificación del tetraedro puente (Q2b) debido a la presencia de aluminio que sustituye al tetraedro puente de sílice Q2b(1Al). Se detectaron altos valores de Q4 en el gel C-S-H con NS OX50 y esto podría estar asociado a una formación de doble cadena muy similar a la de una tobermorita perfecta. La longitud de las cadenas medias (MCL) fue muy variable en cada mezcla, pero se observaron algunas tendencias como que la relación Al/Si=1 y la relación Al/Si=0,1 mantienen o aumentan la MCL, respectivamente. Los resultados son interesantes y las mezclas de casos concretos con NS OX50 muestran tendencias originales que aún no se han reportado en la literatura.
The use of nanomaterials as partial replacements for Portland Cement (PC) such as nanoalumina and nanosilica offers the possibility to improve the performance and properties of mortars and concretes [1,2]. There may be, depending on the nature of the nanoparticle, changes in the structure of the hydrated compounds of the cement and a significant reduction of the porous microstructure due to the filling effect, together with the formation of nucleation sites for hydration in some cases [3,4]. Pores are open pathways to the penetration of aggressive ions that can cause deterioration of concrete, among which chlorides stand out. So, the improvement of the microstructure by the addition of nanoparticles may have important repercussions on durability. A possible effect attributed to the use of nanosilica may be the reduction of calcium leaching in the degradation process in the dissolution of the cement paste. At the level of the C-S-H gel structure, silica nanoparticles increase the average length of silicate chains and reduce their polymerisation when calcium is dissolved. A significant decrease in degradation has also been observed in terms of porosity and amount of calcium lost [5]. Haruehansapong et al. demonstrated that nanosilica has an effect on the durability and repair properties of cement mortars. Nanosilica directly affects the abrasion resistance and water permeability [6]. Naji et al. investigated the effect of nanosilica in concrete. They observed that smaller particles showed more strength in the first few days but over time larger particles increased in strength. The possible multi-site and rapid nucleation may have caused this early strength but the strengthening of the core by curing over time may have led to longer nucleation and increased strength [7].
The most important product resulting from the hydration of ordinary Portland cement (PC) due to its strength and durability properties is calcium silicate hydrate C-S-H [8]. The structure of C-S-H is amorphous, gel-like, with variable contents of calcium, water and silica, which significantly influence the physical, chemical and mechanical properties of OPC [9]. This is the reason why it is essential to study the microstructure of the hydration products obtained in cement-based materials, in particular the C-S-H gel, as well as the modifications that it may undergo. With the use of nuclear magnetic resonance analysis (MAS-NMR) [10–12], the different types of structural units that form part of the C-S-H gel can be distinguished. The NMR findings, together with the results of other instrumental techniques, have been used to establish some models for the structure of the CSH gel, among which the one known as the “defective tobermorite structure model” stands out [13–18]. According to this model, CSH gel can be described as layers of calcium oxide sandwiched by silica chains organised in a “dreierketten” structure, a repeating chain of three silica tetrahedral as shown in Fig. 1[12,19]. Two of these silica units, called tetrahedral pairs, are attached to the calcium oxide layer, while the third is the so-called bridging tetrahedron that links the two pairing tetrahedral. Water, calcium, alkali or other ions are present in the intermediate layer between the layers. If all dimers are bridged, the chains are infinite and correspond to the dreierketten arrangement of silica chains found in natural calcium silicates such as Tobermorite, Jennite, and Wollastonite.
![Scheme of the structure of the C-S-H gel. The grey circle: calcium, empty circle: intermediate layer (water or alkali), light grey tetrahedral: SiO4−, dark grey tetrahedral: AlO4. Qn (mAl): n indicates the number of neighbours of Si and m the number of neighbours of Al, b: bridge, p: paired. Adapted by L’Hôpital et al. [24].](https://static.elsevier.es/multimedia/03663175/0000006200000005/v1_202310231527/S0366317522000401/v1_202310231527/en/main.assets/gr1.jpeg?xkr=ue/ImdikoIMrsJoerZ+w997EogCnBdOOD93cPFbanNd3TCEZuNxhudow/+3Hrh9WJc+mtnYSSPL9K6mfMWVj1ij+qEL8Az62xfWmhN1tMECyF+MItexJ+4Ay47KxNvkkts8pmsEsuPhVMl+iMm1Wq0INiqH96yL0wyk0jMBGMCW3HHpKhtRTIQzjAQRh/OSdNpEqZoUU30AHMCHw/RgHgtymWpBmHl7opFl4gwwzxnWufNhy2XArKgp3VzC6Q1pzp52F6Dx7rfc6oF0fcMQPULL1fS5sgq3l/O3/0DOyjjg0NoEjypT8k0FAt26UD/Np "Scheme of the structure of the C-S-H gel. The grey circle: calcium, empty circle: intermediate layer (water or alkali), light grey tetrahedral: SiO4−, dark grey tetrahedral: AlO4. Qn (mAl): n indicates the number of neighbours of Si and m the number of neighbours of Al, b: bridge, p: paired. Adapted by L’Hôpital et al. [24].")
Scheme of the structure of the C-S-H gel. The grey circle: calcium, empty circle: intermediate layer (water or alkali), light grey tetrahedral: SiO4−, dark grey tetrahedral: AlO4. Qn (mAl): n indicates the number of neighbours of Si and m the number of neighbours of Al, b: bridge, p: paired. Adapted by L’Hôpital et al. [24].
Perfect tobermorite consists of two linear chains of silica tetrahedral arranged on either side of a central CaO sheet. In this case, the linear chains of silica tetrahedral, corresponding to the Q2 units obtained by NMR, would be infinite. Instead, many of the bridge tetrahedral (Q2b units) are missing in the C-S-H gel, leading to finite chains of two, three or five bonds in the case of hydrated OPC [12,20,21]. This type of structure essentially generates two types of signals: one around −79ppm [10] associated with the presence of dimers or end chain units, corresponding to Q1 obtained by NMR, and another around -85ppm, associated to Q2 or intermediate units [20,22,23].
29Si NMR studies have contributed greatly to showing that the number of bridging tetrahedral decreases when the Ca/Si ratio increases [12,13,15]. In the case of synthetic C-S-H gel, which is representative of C-S-H in mixed cements with a high content of reactive silica (low pH cements); it has been shown that the composition of the solid phase is determined by the composition of the solution. The higher Ca/Si ratio is limited by the solubility of portlandite. Previous experimental studies [10,22,23] confirm that the structure of C-S-H can be described as a defective tobermorite structure. The Ca/Si ratio of the C-S-H gel in a cement paste is generally between 1.5 and 1.7 on average, and could reach 2 under certain conditions [11]. These very high ratios occur during hydration of the alite, in which the solution is oversaturated with respect to the portlandite [19,24]. In other words, the calcium hydroxide concentration is greater than the solubility of portlandite, which initially leads to higher calcium content in the C-S-H [25–27]. Several NMR studies have investigated the incorporation of aluminium into the C-S-H gel as Hôpital, varying Ca/Si ratios and Al incorporation in 0–0.1 ratios [19,24]. The substitution of aluminium occurs primarily as tetrahedrally coordinated Al(IV) in the bridging position (Q2b) [3,4,24], as indicated in Fig. 1. In tobermorite, Al(IV) is also present in the units that join two dreierketten chains, obtained as Q3 by NMR [25]. At higher Ca/Si ratios, the relative amount of Al(IV) in C-S-H decreases, instead more octahedral coordinated Al(VI) is observed [28–30]. The octahedral coordinated Al(VI) has been suggested to represent either an amorphous aluminium hydroxide or a calcium aluminate hydrate at the C-S-H surface: third aluminium hydrate (TAH) 31or in the interlayer within the C-S-H [13]. In addition to Al(IV) and Al(VI), approximately 10% of the aluminium associated with C-S-H is present as pentacoordinated Al(V) regardless the Ca/Si ratio of the C-S-H. Sun et al. [32] suggested that Al(V) and Al(VI) could compensate the negative charge introduced by the replacement of Si(+IV) by Al(+III) in the silica chain. However, the amount of Al(V) and Al(VI) does not correlate with the amount of Al(IV) in the silica chains [28,30,33]. A recent paper of Pardal et al. [30], where relatively high aluminium concentrations (1mmol/L) and short reaction times (1 day) have been used. The lack of systematic experimental data at equilibrium conditions hinders the development of adequate thermodynamic models which would allow prediction of the aluminium uptake in C-S-H.
The present work aims to determine whether there is an interaction of nanoalumina when incorporated with nanosilica combined with calcium hydroxide in aqueous synthetic solution. Two nanosilica with different specific surface area and size were chosen, as well as the nanoalumina. A constant Ca/Si ratio of 2 is established and three Al/Si ratios of 0.10, 0.5 and 1 are determined. The solubility, structure and chemical composition of the resulting gel are investigated after an equilibrium time of 24h of stirring and 7 days of resting in the desiccator. The formation of C-S-H or C-A-S-H gels with a structure similar to that of Tobermorite or Jennite is expected depending on the polymerisation and the increase or decrease of the Ca/Si ratio. There is a limitation in the work that only the NMR results are available and with this it is intended to make an approximate interpretation of the products obtained. It is clear that an additional technique would support the results obtained but that it is supported by literature consulted.
Materials and methodsPreparation of sample solutionCalcium hydroxide, two types of pyrogenic hydrophilic nanosilicas (NS) with two different grain sizes surface area (AEROSIL A200 and OX50) and two types of nanoaluminas obtained by the same method (NA) with two different grain sizes surface area (AEROXIDE Alu65, Al65 and AEROXIDE Alu130, A130)) were used to synthesise the C-S-H and C-(A)-S-H gels. Ca(OH)2 used was of purity greater than 99.9% and supplied by Scharlab S. L.®. The four nanoparticles used were prepared by pyrogenic synthesis with have apurity greater than 99.8% and supplied by Evonik®. Both NS types were hydrophilic. Table 1 shows the specific surface area and the average diameter particle size supplied by the manufacturer.
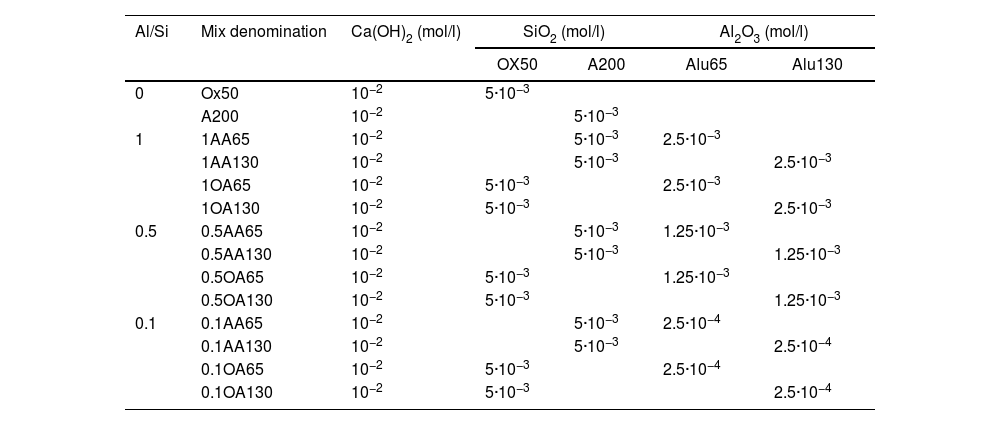
The C-A-S-H synthesised gels were prepared with a fixed Ca/Si ratio of 2 and different Al/Si ratios of 0, 0.1, 0.5 and 1, adding Ca(OH)2 0.01M, SiO2 0.005M and Al2O3 (0.0025M, 0.00125M and 0.00025M). The composition of the mixtures used to prepare the C-A-S-H gels is shown in Table 2. The solutions were prepared with distilled and decarbonated water at 20°C and stirred during 60min covered with plastic to minimise CO2 contamination. Then, the solutions were allowed to stand during 24h until the two parts were clearly differentiated: the solid gel and the liquid phase. The two phases were separated by vacuum filtration using 0.45μm filter paper. After that, the gels were stored in a plastic bag and dried at 40°C for 7 days before 29Si nuclear magnetic resonance (NMR) analysis.
Composition of the solutions to obtain the synthesised C-(A)-S-H gels (mol/l).
| Al/Si | Mix denomination | Ca(OH)2 (mol/l) | SiO2 (mol/l) | Al2O3 (mol/l) | ||
|---|---|---|---|---|---|---|
| OX50 | A200 | Alu65 | Alu130 | |||
| 0 | Ox50 | 10−2 | 5·10−3 | |||
| A200 | 10−2 | 5·10−3 | ||||
| 1 | 1AA65 | 10−2 | 5·10−3 | 2.5·10−3 | ||
| 1AA130 | 10−2 | 5·10−3 | 2.5·10−3 | |||
| 1OA65 | 10−2 | 5·10−3 | 2.5·10−3 | |||
| 1OA130 | 10−2 | 5·10−3 | 2.5·10−3 | |||
| 0.5 | 0.5AA65 | 10−2 | 5·10−3 | 1.25·10−3 | ||
| 0.5AA130 | 10−2 | 5·10−3 | 1.25·10−3 | |||
| 0.5OA65 | 10−2 | 5·10−3 | 1.25·10−3 | |||
| 0.5OA130 | 10−2 | 5·10−3 | 1.25·10−3 | |||
| 0.1 | 0.1AA65 | 10−2 | 5·10−3 | 2.5·10−4 | ||
| 0.1AA130 | 10−2 | 5·10−3 | 2.5·10−4 | |||
| 0.1OA65 | 10−2 | 5·10−3 | 2.5·10−4 | |||
| 0.1OA130 | 10−2 | 5·10−3 | 2.5·10−4 | |||
To ensure that as much Ca2+ was incorporated into the gel as possible, the Ca2+ concentration was measured by titration in all solutions before and after the incorporation of NS and NA, at various time intervals. The test was performed with a Metrohm Ti-Touch with a photometric sensor (Optrode) at a wavelength of 610nm using a standard solution of 0.002M Na4EDTA as titrant.
Nuclear magnetic resonance analysis of the solid phaseMeasurements of the synthetic gels were performed on a Bruker Avance-AV400WB spectrometer at a resonance frequency of 79.5MHz and a slew rate of 10kHz. The 29Si MAS-NMR spectra were irradiated with a single (π/2) pulse (4μs) and tetramethylsilane (TMS) was used as the external standard for the 29Si spectra. The relaxation time used was 5s for all experiments assuming differential error with respect to the usual acquisition parameters [13,34]. A check of the rotation sidebands was performed and found to be absent in all spectra. The 1H/29Si CP MAS-NMR experiments is performed for all spectra with a contact time of (3ms). The nature of the cross-polarisation process, where the 29Si spin picks up a higher polarisation of the proton reservoir, restricts the detection of silica nuclei that have interactions with proton nuclei, so that those silica nuclei that have interactions with proton nuclei can be detected by 29Si CP MAS-NMR [13,34].
The deconvolution of the 29Si MAS spectra was performed with the commercial software MestReNova (Mnova) [14] and the Gauss–Lorentzian profile was used. NMR spectra data were processed adopting a Bernstein Polynominal baseline correction of 1° for synthetic pastes to flatten the background. A zero fill was performed to increase the spectrum resolution up to 32768 (32k), as well as an apodization was performed at 12Hz [34] for synthetic pastes. Deconvolutions were performed using a Gauss–Lorentzian profile for each component, with a Gaussian–Lorentzian relationship of 0.5 for silica and a width <3ppm [19,24]. The spectra were studied in detail to properly identify the peaks and the noise related part should be discarded in the range of 1.8–2.5 of signal normalised to the highest peak. The integral in the range of interest was determined and the deconvolution area was delimited from −75ppm to −115ppm [3,10–13,16,24,25,35] where the most important points of the spectrum are located (Table 3). The identification of the peaks are in the specified range, starting with the highest peak and continuing with the search for the hidden and lower intensity peaks, identifying the following values Q1, Q2, Q3 and Q4.
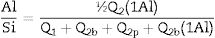
Among Q2 values are included the bridge tetrahedral Q2b, paired tetrahedral Q2p and the intrusion of the Q2b (Al) structure as a bridge between the silica tetrahedral. The number of iterations for each spectrum was at least 20 for the best possible spectrum fit. 29Si MAS NMR has revealed important information regarding incorporation of Al in C-S-H (i.e. forming C-A-S-H) in hydrated PC [16,22,26]. Application of 29Si MAS NMR has allowed observation of resonances from Q1, Q2 and Q2b(1Al) sites which make up the silicate chains in the C-A-S-H gel [22,24,25]. The MCL can be calculated from the intensities of Qn(mAl) resonances obtained from 29Si MAS NMR spectral deconvolutions by using Eq. (1), while the degree of Al-Si substitution in the tetrahedral chains can be obtained from the intensities of the Q1, Q2 and Q2b(1Al) resonances (Eq. (3)), as demonstrated by Richardson et al. [25,36] and Andersen et al. Based on the NMR results, the main chain lengths (MCL) of the gels were determined from the following equation [10,24,25]:
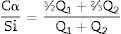
With Q1: end of chain and Q2b(1Al): pairing silica tetrahedral neighbouring an aluminium in bridging position. Eqs. (2) and (3) were used to determine the Ca/Si ratio and the Al/Si ratio of the synthetic gels [23–25]. As can be seen, this estimation does not include the Q3(1Al) value because the structures formed are considered to be aluminosilicates. This is to observe the interaction of the C-A-S-H in the bridge structures in silica and not the bridge between structures dreierketten in the synthetic gels. Using 29Si MAS NMR, Andersen et al.36 showed that the Al(IV)/Si ratio in C-A-S-H in hydrated white PC depends on the availability of dissolved Al3+ ions, but is independent of the hydration time. Richardson et al. [25] used 29Si MAS NMR to determine that Al preferentially substitutes at Q2b sites and that the MCL of aluminosilicate chains in C-(A)-S-H depends on both the availability of Al3+ ions in solution and hydration time, findings that were later confirmed by Andersen et al. [31,36]Results and discussionSolution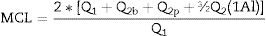
As can be seen in Fig. 2, after 24h the Ca2+ concentration remains constant. Therefore, by leaving the gel at rest for 24h, the incorporation of Ca2+ into the gel can be assumed. It can also be observed that Ca2+ is incorporated faster in the mixtures with A200 NS than in the mixtures with OX50, which would be due to a higher surface area and therefore higher reactivity of A200 NS.
C-S-H and C-A-S-H structures
Analysis of the 29Si MAS-NMR spectra provides quantitative information on the silica fractions present in the tetrahedral environments Qn (0<n<4), where Q represents the silica tetrahedron and n the number of oxygen atoms bridging with adjacent tetrahedral. The analysis range of the resonance spectrum was delimited from −75 to −115ppm, to be representative for all tests [4,15,17,25]. Previous studies assigned the different environments of the silica tetrahedral frequency ranges in the NMR spectrum [10,15,25].
The assignment of the different chemical shifts (ppm) has been done according to the literature, taking into account that these Si structures must be connected to other Si [19,24,37–39]. Accordingly, in the synthetic C-S-H the end of the chain Q1 is taken at −79.0±1.0ppm, the Q2b bridge tetrahedron at −82.75±0.75ppm within the “dreierketten” model, the Q2p pairing site at −86.0±2.40ppm, the Q0 as anhydride material at 73.5±4.50ppm, the Q3 as a tetrahedron that connects two dreierketten structures (complete in three of its four available bonds with Si) in the range −88.4 to −100ppm and the Q4 completing its four bonds with Si, connects perpendicular to the silica chain. These most common structures are shown in Fig. 1. Al readily substitutes for Si in the bridging position in aluminosilicate chains in C-A-S-H up to a ratio of Al/Si<0.1, while at higher Al/Si ratios, katoite and/or stratlingite are also formed. This is proven by signal observed at −85.6ppm contained in Q2p, associated with the presence of synthetic stratlingite [40]. Stratlingite is based on a double tetrahedral layer which, if fully occupied, would in fact be a network structure, i.e., contain all Q4, silicate anions. However, the structure has up to 45% vacancies in the double tetrahedral layer, thus allowing most any configuration involving the silicon–oxygen linkages [24,40]. The presence of aluminium in C-S-H gel introduces an additional peak, Q2b (1Al) between −82.0 and −80.5ppm, collected in the literature [28,29,36,41]. The Q2p signal is displaced by a tetrahedrally coordinated aluminium Al(IV) present in the nearby bridging position of the “dreierketten” chains, corresponding to Q2b (1Al) [31].
Figs. 3–5 and 6 show the spectra of all the combinations made with their reference or Al/Si ratio=0. In all these cases a signal predominates between −85 and −86ppm, which is associated with the paired tetrahedra attached to the CaO chain. Figs. 3 and 4 show the comparison of the NS A200 combined with the two different NA using Al/Si ratios of 0.1, 0.5 and 1. Fig. 3 shows the combinations of A200 with Alu 65, assigned as AA65. Fig. 4 shows the combinations of A200 with Alu 130, assigned as AA130. In Figs. 3 and 4, shifts of the Q2p signal with respect to the NS of the A200 references are observed, this may be associated with the interaction of the NA in the structures formed from the silicates. In Fig. 3, it can be observed that Q2b is present in all spectra, Q2b1Al does not appear in the spectrum and must be as a hidden signal within the range, Q1 and Q0 are observed with low intensity as. In Fig. 4 the trend in the formation of Q2b is very similar to the previous figure, it can be seen that the resonances of the combinations AA65 and AA130 are in principle very similar. 29Si NMR signal of the silica is very similar in the spectra shown in Figs. 3 and 4. The differences may be better assessed by the deconvolution of the signal and the quantification of the individual values of Q1, Q2, Q3 and Q4.
.")
.")
.")
.")
Figs. 5 and 6 show the comparison of NS OX50 combined with the two different NA using Al/Si ratios of 0.1, 0.5 and 1. Fig. 5 shows the combinations of OX50 with Alu 65, assigned as OA65, and Fig. 6 shows the combinations of OX50 with Alu 130, assigned as OA130.
NS OX50 shows a significantly different resonance spectrum compared to NS A200 as can be seen in Figs. 5 and 6. The OX50 shows a higher value of Q4 and Q3 which corresponds to the connection of the chains of the dreierketten structure in the interlayer region. The predominant signal in the spectra again coincides in between −85 and −86ppm very similar in the samples with NS A200. Furthermore, it is worth noting that sample 01OA130 shows a very different spectrum than the other spectra with NS OX50 and NS A200. This may be due to the interaction between the particles as NS OX50 has a larger surface area compared to NA A130. When comparing all the combinations OA65 and OA130 specifically the 0.1 Al/Si ratio we observe that 01OA65 has a different behaviour than 01OA130. This may be associated to a specific surface area interaction of the NA as described above. This may be associated with improved mechanical properties when combined with cement [42]. The NS OX50 in Figs. 5 and 6 shows with little clarity the signals of Q2b and Q2b1Al, the shift generated in the Q2p signal can be associated to the incorporation of the NA regardless of whether it is A130 or A65. The 29Si NMR signal of silica is very similar in the spectra shown in Figs. 5 and 6. The differences can best be assessed by deconvolution of the signal and quantification of the individual Qn values.
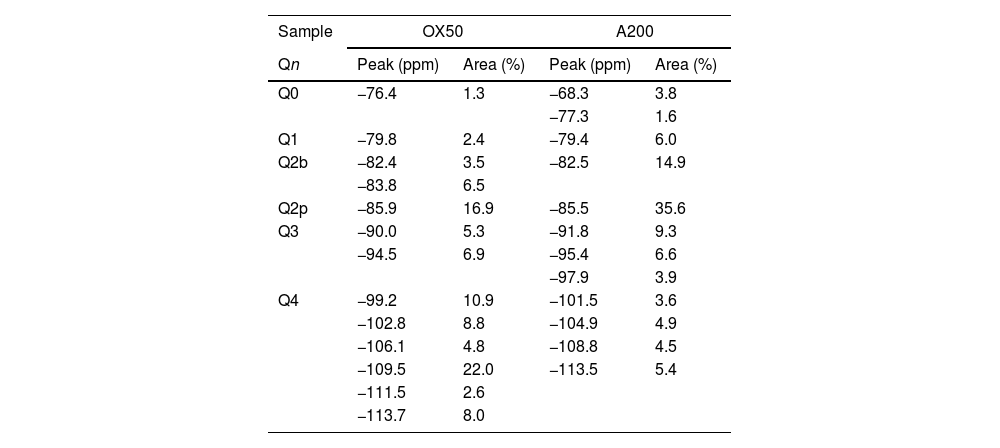
Spectral deconvolution is a mathematical operation that identifies possible signal components, in this work, the 29Si components. Although this procedure, which relies on a specific interpretation of the results, can tolerate some errors, it is widely used by the scientific community [10]. In this particular case, the signals of most of the gels had clearly defined peaks, which greatly facilitated the evaluation of the deconvoluted components. The check the presence of critical signal in the samples, the 1H/29Si CP/MAS-NMR was recorded. This was done to check that signals such as Q2b or Q2b (1Al) were those identified in the Si MAS-NMR deconvolution. Fig. 7 shows the deconvolution of the references with NS and Ca(OH)2 without aluminium and it can be seen that the Q2p signal is the most intense in the spectra. However, when processing the signals and quantifying the values in Table 4, it was observed that NS A200 maintains this signal intensity but NS OX50 does not. While NS A200 has a 35.6% quantification in that signal, NS OX50 drops to 16.9% area. Another important difference is the ability to form Q2b when using NS A200 with a value of 14.9% compared to NS OX50 which quantifies 10% which is one third less than the former. According to Myers et al. to quantify a non-crosslinked MCL the value of Q3 would be out of Eq. (1), but the action of Q3 would represent a crosslinked MCL and at the same time a perfect tobermorite structure very different from that observed in the CPO [43]. It was observed that the quantification of Q3 for NS OX50 was 12.2% area and 19.8% area for NS A200, being lower in NS OX50 and with a high possibility that the C-S-H structures formed have a structure very similar to perfect tobermorite. For both samples the Q4 value is present but more noticeably in NS OX50. The high formation of Q4 in NS OX50 indicates that there is a perpendicular connection to the silicate chain, there is a spatial polymerisation between the silicates. In contrast NS A200 does not show this behaviour.
 A200 and (b) OX50.")
Chemical shifts [δ (ppm)] and area percentages (A%) of the deconvoluted components in the spectra of NS with calcium 29Si-NMR spectra.
| Sample | OX50 | A200 | ||
|---|---|---|---|---|
| Qn | Peak (ppm) | Area (%) | Peak (ppm) | Area (%) |
| Q0 | −76.4 | 1.3 | −68.3 | 3.8 |
| −77.3 | 1.6 | |||
| Q1 | −79.8 | 2.4 | −79.4 | 6.0 |
| Q2b | −82.4 | 3.5 | −82.5 | 14.9 |
| −83.8 | 6.5 | |||
| Q2p | −85.9 | 16.9 | −85.5 | 35.6 |
| Q3 | −90.0 | 5.3 | −91.8 | 9.3 |
| −94.5 | 6.9 | −95.4 | 6.6 | |
| −97.9 | 3.9 | |||
| Q4 | −99.2 | 10.9 | −101.5 | 3.6 |
| −102.8 | 8.8 | −104.9 | 4.9 | |
| −106.1 | 4.8 | −108.8 | 4.5 | |
| −109.5 | 22.0 | −113.5 | 5.4 | |
| −111.5 | 2.6 | |||
| −113.7 | 8.0 | |||
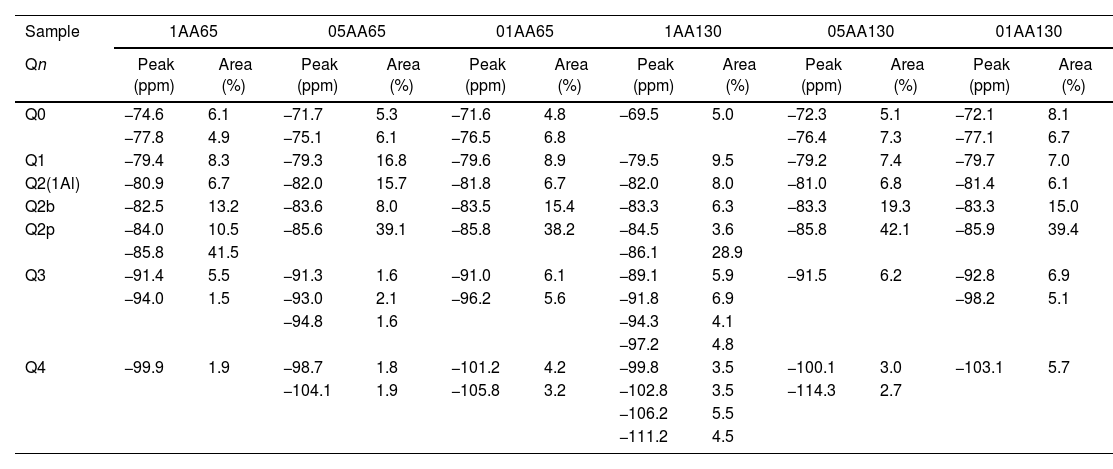
Fig. 8 shows the deconvolutions of samples AA65 and AA130 and Table 5 quantifies the observed signals. The strongest signals observed are found in Q2p with values from 33.5% to 50.8% for these combinations. The formation of Q2b is higher when using NS A200 as observed in Table 4 but when combined with NA these values are reduced as in sample 1AA130 [8,39]. This can be corroborated in Table 5 and Fig. 8. But it has been observed that there is a tendency to form more Q2p when Al is integrated as in sample 1AA65 but overall there is an increase from 6 to 46% in all samples and it is higher when in combination with AA65. This shows that this reduction is due to the substitution of Al(IV) at the bridging position in the chain. This substitution of Q2b(1Al) is higher when the Q2b is lower as in sample 05AA65 which has 15.7% and 8.0% respectively as reported by Kwan et al., Hopital et al. and Myres et al.
 1AA65, (b) 1AA130, (c) 05AA65, (d) 05AA130, (e) 01AA65 and (f) 01AA130.")
Chemical shifts [δ (ppm)] and area percentages (A%) of the deconvoluted components in the 29Si-NMR spectra in the combinations AA65 and AA130.
| Sample | 1AA65 | 05AA65 | 01AA65 | 1AA130 | 05AA130 | 01AA130 | ||||||
|---|---|---|---|---|---|---|---|---|---|---|---|---|
| Qn | Peak (ppm) | Area (%) | Peak (ppm) | Area (%) | Peak (ppm) | Area (%) | Peak (ppm) | Area (%) | Peak (ppm) | Area (%) | Peak (ppm) | Area (%) |
| Q0 | −74.6 | 6.1 | −71.7 | 5.3 | −71.6 | 4.8 | −69.5 | 5.0 | −72.3 | 5.1 | −72.1 | 8.1 |
| −77.8 | 4.9 | −75.1 | 6.1 | −76.5 | 6.8 | −76.4 | 7.3 | −77.1 | 6.7 | |||
| Q1 | −79.4 | 8.3 | −79.3 | 16.8 | −79.6 | 8.9 | −79.5 | 9.5 | −79.2 | 7.4 | −79.7 | 7.0 |
| Q2(1Al) | −80.9 | 6.7 | −82.0 | 15.7 | −81.8 | 6.7 | −82.0 | 8.0 | −81.0 | 6.8 | −81.4 | 6.1 |
| Q2b | −82.5 | 13.2 | −83.6 | 8.0 | −83.5 | 15.4 | −83.3 | 6.3 | −83.3 | 19.3 | −83.3 | 15.0 |
| Q2p | −84.0 | 10.5 | −85.6 | 39.1 | −85.8 | 38.2 | −84.5 | 3.6 | −85.8 | 42.1 | −85.9 | 39.4 |
| −85.8 | 41.5 | −86.1 | 28.9 | |||||||||
| Q3 | −91.4 | 5.5 | −91.3 | 1.6 | −91.0 | 6.1 | −89.1 | 5.9 | −91.5 | 6.2 | −92.8 | 6.9 |
| −94.0 | 1.5 | −93.0 | 2.1 | −96.2 | 5.6 | −91.8 | 6.9 | −98.2 | 5.1 | |||
| −94.8 | 1.6 | −94.3 | 4.1 | |||||||||
| −97.2 | 4.8 | |||||||||||
| Q4 | −99.9 | 1.9 | −98.7 | 1.8 | −101.2 | 4.2 | −99.8 | 3.5 | −100.1 | 3.0 | −103.1 | 5.7 |
| −104.1 | 1.9 | −105.8 | 3.2 | −102.8 | 3.5 | −114.3 | 2.7 | |||||
| −106.2 | 5.5 | |||||||||||
| −111.2 | 4.5 | |||||||||||
When the Al/Si ratio increases the above values change, i.e. Q2b increases while Q2b(1Al) decreases as in samples 1AA65, 05AA65 and 1AA130. From the observations it can be argued that the size or specific surface area of the three nanomaterials combined could also have an influence on this change. NA A65 has a higher tendency to form Q2b(1Al) compared to A130. Of these combinations, 1AA130 presents a high amount of Q3 and Q4 where possibly some Al is being incorporated, but to determine this with certainty it is necessary to carry out a 27AL MAS NMR resonance. The presence of Q3 would indicate that there is a connection between two Q2b and that they link two chains of the structure. This sample retains the Q3 formed by the NS A200 for the rest there is a modification of that Q3 reducing it drastically. It would be interesting to study sample 1AA130 in detail to see what kind of structures it generates when Al is incorporated, since Q2b does not incorporate Al with intensity.
According to the literature, the Al/Si ratio is more important than the particle size when trying to incorporate Al in a NS with a high specific surface like A200, but when combining two materials with similar surfaces the tendency to form Q3 and Q4 is higher creating a perfect tobermorite type polymerisation and changing the single chain structure to a double one.
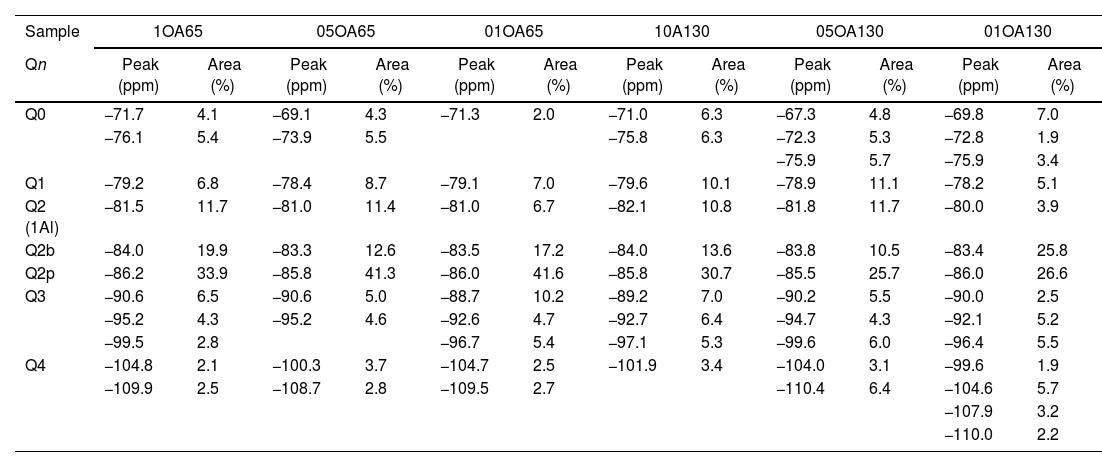
Fig. 9 shows the deconvolutions of samples OA65 and OA130 and Table 6 quantifies the observed signals. The dominant signal repeats as with the previous NS A200 between −85 and −87ppm with values from 25.7% to 41.6% overall. The Q2b signal of the reference NS OX50 is lower compared to all combinations of OA65 and OA130 [8,39].
 1OA65, (b) 1OA130, (c) 05OA65, (d) 05OA130, (e) 01OA65 and (f) 01OA130.")
Chemical shifts [δ (ppm)] and area percentages (A%) of the deconvoluted components in the 29Si-NMR spectra in the combinations OA65 and OA130.
| Sample | 1OA65 | 05OA65 | 01OA65 | 10A130 | 05OA130 | 01OA130 | ||||||
|---|---|---|---|---|---|---|---|---|---|---|---|---|
| Qn | Peak (ppm) | Area (%) | Peak (ppm) | Area (%) | Peak (ppm) | Area (%) | Peak (ppm) | Area (%) | Peak (ppm) | Area (%) | Peak (ppm) | Area (%) |
| Q0 | −71.7 | 4.1 | −69.1 | 4.3 | −71.3 | 2.0 | −71.0 | 6.3 | −67.3 | 4.8 | −69.8 | 7.0 |
| −76.1 | 5.4 | −73.9 | 5.5 | −75.8 | 6.3 | −72.3 | 5.3 | −72.8 | 1.9 | |||
| −75.9 | 5.7 | −75.9 | 3.4 | |||||||||
| Q1 | −79.2 | 6.8 | −78.4 | 8.7 | −79.1 | 7.0 | −79.6 | 10.1 | −78.9 | 11.1 | −78.2 | 5.1 |
| Q2 (1Al) | −81.5 | 11.7 | −81.0 | 11.4 | −81.0 | 6.7 | −82.1 | 10.8 | −81.8 | 11.7 | −80.0 | 3.9 |
| Q2b | −84.0 | 19.9 | −83.3 | 12.6 | −83.5 | 17.2 | −84.0 | 13.6 | −83.8 | 10.5 | −83.4 | 25.8 |
| Q2p | −86.2 | 33.9 | −85.8 | 41.3 | −86.0 | 41.6 | −85.8 | 30.7 | −85.5 | 25.7 | −86.0 | 26.6 |
| Q3 | −90.6 | 6.5 | −90.6 | 5.0 | −88.7 | 10.2 | −89.2 | 7.0 | −90.2 | 5.5 | −90.0 | 2.5 |
| −95.2 | 4.3 | −95.2 | 4.6 | −92.6 | 4.7 | −92.7 | 6.4 | −94.7 | 4.3 | −92.1 | 5.2 | |
| −99.5 | 2.8 | −96.7 | 5.4 | −97.1 | 5.3 | −99.6 | 6.0 | −96.4 | 5.5 | |||
| Q4 | −104.8 | 2.1 | −100.3 | 3.7 | −104.7 | 2.5 | −101.9 | 3.4 | −104.0 | 3.1 | −99.6 | 1.9 |
| −109.9 | 2.5 | −108.7 | 2.8 | −109.5 | 2.7 | −110.4 | 6.4 | −104.6 | 5.7 | |||
| −107.9 | 3.2 | |||||||||||
| −110.0 | 2.2 | |||||||||||
Both combinations OA65 and OA130 have been shown to increase the ability of silica to form Q2b. Al incorporation is higher at Al/Si ratios of 1 and 0.5 and reduced at Al/Si=0.1. This is in line with the literature and shows that in both cases high Al/Si ratios are the ones that incorporate Al(IV). Furthermore, it was observed that the interaction of two nanomaterials with different specific surface area can also favour the incorporation of Al. This occurs in samples 0.5AA65 and 0.5OA130. Sample 1OA65 is the exception as the specific surface area of both nanomaterials is very similar and presents a behaviour very similar to the one described above. The value of Q3 and Q4 formed by the NS OX50 reference are considerably reduced but still present. This may indicate that the rearrangement of the structure by incorporating Al causes these double chains to simplify forming a type of defective tobermorite very similar to that observed in the PC. The Q3 values for these combinations are between 9.7% and 20.3%, well below those quantified for NS OX50. The Q4 values are also greatly reduced from 57.2% of the NS OX50 without Al to a value of 3.4% and 13.0%. This indicates that the reduction is equivalent to one fifth of that observed for NS OX50. There is a rearrangement of the signal distribution in the Q1 and Q2 signals.
The decrease in the signals corresponding to the Q3 and Q4 structures may be associated with tetrahedra that were previously partially or fully co-ordinated being integrated into the Q2 structures. The relative intensity of the end of chain Q1 was 9.65% on average for the combinations AA65 and AA130, while it decreases for all combinations with decreasing OX50 to 8.13% on average. Based on these results, it can be stated that A200 generates a Q1 value and this will affect its polymerisation, compared to the Q1 values of the reference NS, which is in line with what was observed for all combinations. So far, structural changes of C-S-H and C-A-S-H have been observed, but it is necessary to calculate the MCL and the Al/Si and Ca/Si ratios to determine what kind of structures have been formed and to observe the polymerisation.
Fig. 10 shows several examples of silicate chains with different MCLs in which the units Q2=Q2p and Q2(L)=Q2b can be distinguished. The dreierketten structure is composed of dimers, trimers, pentamers, octamers and the n-union of monomers. This figure shows the approximate shape of the chains that can be produced and the Q2b/Q2 ratio that should remain constant for all chains regardless of their theoretical length. In this case, the chain would have three tetrahedra, two of which would be at end positions, constituting Q1 units, and only one in the intermediate position (Q2p units). This third silica, moreover, would be in a bridging position; i.e., in this specific case, “all” the Q2 units should be regarded to be bridging tetrahedra, whereby the signal on the spectrum should be attributed to Q2b units. The calculation of the MCL with Eq. (1) for the NS references yielded 18.28 and 29.53 for NS A200 and OX50 respectively, being higher for the latter. At the same time, the ratio between the units Q2b and Q2 was estimated to see if the ratio of 0.5 was maintained and the only ones that maintained it were 01AA130, 05OA65 and OX50.
![Silicate chain structure MCL. Adapted by García-Lodeiro et al. [10].](https://static.elsevier.es/multimedia/03663175/0000006200000005/v1_202310231527/S0366317522000401/v1_202310231527/en/main.assets/gr10.jpeg?xkr=ue/ImdikoIMrsJoerZ+w997EogCnBdOOD93cPFbanNd3TCEZuNxhudow/+3Hrh9WJc+mtnYSSPL9K6mfMWVj1ij+qEL8Az62xfWmhN1tMECyF+MItexJ+4Ay47KxNvkkts8pmsEsuPhVMl+iMm1Wq0INiqH96yL0wyk0jMBGMCW3HHpKhtRTIQzjAQRh/OSdNpEqZoUU30AHMCHw/RgHgtymWpBmHl7opFl4gwwzxnWufNhy2XArKgp3VzC6Q1pzp52F6Dx7rfc6oF0fcMQPULL1fS5sgq3l/O3/0DOyjjg0NoEjypT8k0FAt26UD/Np "Silicate chain structure MCL. Adapted by García-Lodeiro et al. [10].")
Silicate chain structure MCL. Adapted by García-Lodeiro et al. [10].
In both cases the values found are higher than the typical 5–8 MCL values normally found in C-S-H gels generated during PC hydration. This confirmed that, although the gels being formed were calcium silicate hydrates, they had highly polymerised structures, unlike the C-S-H gels of OPC. As a general rule, the number of Q2b units increased with the number of tetrahedral in the chains and the signal became more visible at OX50. The Ca/Si ratio was calculated for the references, obtaining values of 0.755 and 0.735 for NS A200 and OX50 respectively. By presenting such a low ratio compared to the initial one of 2, it is attributed that this ratio only considers silica and calcium within the structures as found in the literature. However, these low values favour the increase of the MCL as well as the low values of Q1 units but also the presences of Q2p units favour this. The latter results could indicate that there is different arrangement of the bridge tetrahedral and therefore the chains of these samples do not have an idealised structure as shown in Fig. 10. Table 7 and Fig. 10 show the MCL values of all samples calculated with Eq. (1). Comparing all samples, sample 01AA130 has the highest MCL and very similar to the reference value NS OX50. It is the most polymerised sample and it is also the one with the lowest Ca/Si values, corroborating what is described in the literature. But it also has a low Al/Si value showing that the incorporation of Al has not a great impact on the longitudinally polymerising Q2b units. The Q2b/Q2 value is also different from 0.5 being 1.115 corroborating that there is little relationship with the idealisation of the chains shown in Fig. 10.
Parameters calculated from the Qn values of the deconvolution.
| Sample | Ca/Si | Al/Si | MCL | Q2b/Q2 |
|---|---|---|---|---|
| 1AA65 | 0.753 | 0.042 | 20.03 | 0.383 |
| 05AA65 | 0.843 | 0.099 | 10.40 | 0.605 |
| 01AA65 | 0.773 | 0.049 | 16.38 | 0.578 |
| 1AA130 | 0.808 | 0.071 | 12.66 | 0.440 |
| 05AA130 | 0.748 | 0.045 | 21.29 | 0.619 |
| 01AA130 | 0.753 | 0.045 | 20.22 | 0.535 |
| 1OA65 | 0.745 | 0.081 | 22.89 | 0.930 |
| 05OA65 | 0.765 | 0.077 | 18.31 | 0.582 |
| 01OA65 | 0.747 | 0.046 | 21.66 | 0.575 |
| 10A130 | 0.796 | 0.083 | 13.92 | 0.792 |
| 05OA130 | 0.824 | 0.099 | 11.66 | 0.865 |
| 01OA130 | 0.735 | 0.032 | 25.00 | 1.115 |
| A200 | 0.755 | 0.000 | 18.83 | 0.418 |
| OX 50 | 0.735 | 0.000 | 24.52 | 0.590 |
In Table 7, the Q2b/Q2 ratio remains around 0.645 on average above 0.5, regardless of the MCL. The Ca/Si and Al/Si ratios remain in the region of 0.770 and 0.064 respectively. The mean MCL value is 18.412, calculated according to Eq. (1). The observations in Table 7 show that the higher occupation of the bridging tetrahedral by Q2b and Q2b(1Al) decreases the Ca/(Si+Al) ratio and leads to a higher degree of polymerisation of the silicatetrahedra and thus to a longer silica chain length, as reported previously [28,31]. Observing that samples with Ca/Si values around 0.75 are the ones with the highest MCL compared to the others. However, 05AA65 has a lower MCL than the NS A200 references but with a Ca/Si ratio of 0.843 and one of the highest Al/Si ratio values with a value of 0.099. The role played by Al does not influence the increase of the MCL as this sample had the highest Q1 value causing a very significant MCL reduction. In the quantification of its deconvolution the value of Q2b (1Al) was among the highest of all the samples.
It is corroborated that higher Ca/Si values give shorter MCLs, even compared to the NS references and to each other. It has been observed that there is a trend in the results when the Ca/Si ratio increases so does the Al/Si ratio. The possibility of calcium available in the chain is higher and allows more vacancies for the incorporation of Al and Si. It can be stated that the MCL does not increase with the incorporation of Al as it would be using the spaces previously occupied by Q2b. Only sample 1OA65 has a high Al/Si value of 0.081 and a good MCL attributing this behaviour to the specific surface area of the nanomaterials being the same. The values of Q0 and Q1 are the indicators of this result, for example if there is a high number of Q1 dimers it would indicate that the CaO layer has been formed and at least two Si(I) tetrahedra have been incorporated and therefore there may be a high number of Q0 monomers incorporated into that CaO layer as a Si(0) tetrahedron without contributing length to the MCL but to the Ca/Si ratio.
Observe Fig. 11 where the MCL graphs are shown. Separating in combinations AA65 and AA130 with its reference NS A200 it has been distinguished that the samples 1AA65, 05AA130 and 01AA130 present higher MCL than the reference. While for samples 05AA65, 01AA65 and 1AA130 the MCL value is significantly reduced. It can be argued that combining NS A200 with NA A65 performs better at high Al/Si ratios and when combining NS A200 with NA A130 the behaviour is the other way around. In the same figure, analysing the combinations OA65 and OA130, the MCL values of the samples 1OA65, 01OA65 and 01OA130 obtain the highest values and are very similar to their reference NS OX50. While the rest 05OA65, 1OA130 and 05OA130 the MCL value is very considerably reduced. Comparing this with the use of NS A200 it can be argued that there is a bias when combining NS OX with NA A65. The interaction of two nanomaterials with different specific surface areas does not lead to an improvement of the MCL or the Ca/Si or Al/Si ratios. This may indicate that the assumption that there is a relatively better arrangement due to different sizes would be false.
 for all combinations of nanomaterials.")
Returning to the tables and figures of the deconvolutions we can corroborate that these ratios in that order presented mostly Q2p, Q2b and Q2b(1Al) units. All the observed results indicate that there is a modification of the C-H-S to C-A-S-H gel to different extents according to the calculated Al/Si ratios and the modification of the MCL chains of the NS as C-S-H. Somehow, the C-S-H gel of NS OX50 manages to maintain a very similar MCL when NA is incorporated, showing that this incorporation does not have a great influence on its polymerisation, whereas the gel of NS A200 is affected by the incorporation of NA except in 1AA65, 05AA130 and 01AA130 where this incorporation benefits in an increase of the MCL.
ConclusionsAfter studying the C-S-H and C-(A)-S-H gels structures by 29Si MAS-NMR analysis, the following conclusions have been drawn from this work:
- -
The interaction of Al in the dreierketten structure has been studied. It modifies the C-S-H gel structures as observed in the MCL values were reduced when more Al was incorporated. Furthermore, there is a competition for the occupation of the Q2b vacancy between Al and Si. The Q1 values increase when Al appears modifying the whole structure. There is a predisposition to improve the MCL when two nanomaterials with the same surface area are used, but the best results are obtained for samples 05AA130 and 01OA130, the latter of which shows the best results.
- -
The shift of the octahedral coordination of Al(VI) to the tetrahedral Q2b(1Al) or Al(IV) was observed by 29Si MAS-NMR and CP/MAS-NMR resonance. As we are limited in the use of one technique, the possibility of 27Al MAS-NMR resonance remains open.
- -
The deconvolution results analysis shows that there is a high Q4 formation when using the lowest surface area nanosilica (OX50) and this would indicate that this nanoscale material has a tendency to polymerise into a perfect tobermorite structure compared to highest surface area nanosilica (A200). This would reflect that combining nanosilica OX50 with OPC would increase the mechanical properties of OPC based materials.
- -
The presence of Al in the hydrated components of cement will be very beneficial for the durability of the cement based materials, especially in chloride environments, as it can contribute significantly to the chemical combination of chlorides get involved in the formation of Friedel's salt (3CaO·Al2O3·CaCl2·10H) and as physisorbed chlorides in C-A-S-H gel.
The authors declare that there are no conflicts of interest in the publication of this paper.
This work was supported by the Spanish Ministry of Science, Innovation, and Universities, FEDER (U.E.) through the Project RTI2018-100962-B-I00 titled: “Sustainable strategy of high durability in concrete subjected to marine environments at early ages.” 2018 Call for R&D&I Projects “Research challenges” of the state R&D&I oriented program for societal challenges and Support is also gratefully acknowledged from the grant PRE2019-090002 supported MCIN/AEI/10.13039/501100011033 and as appropriate: ESF "ESF invests in your future" or EU funded "NextGenerationEU"/PRTR.

