


Glasses in the LMAS (Li2O, MgO, Al2O3, SiO2) system containing F, CaO, ZrO2, and TiO2 were subjected to crystallization by incorporating P2O5. The glass stability, glass forming ability, and crystallization kinetics have been determined. Crystals of Lithium Aluminum Silicate (LixAlxSi1−xO2), Enstatite (MgSi2O6) and β-spodumene (LiAlSi2O6) were detected in the samples containing F, but β-spodumene was not observed in the glass-ceramic in its absence. Glasses containing F show a dependence of the activation with the addition of P2O5 with energy values ranging from 426kJmol−1 to 483kJmol−1, being this maximum found for P2O5 amounts up to 3mol%. High concentrations of P2O5 and Al2O3 improve the glass stability and increase the crystallization temperature. The most common crystallization mechanism is of bulk type with a constant number of nuclei. Two- and three-dimensional growth of crystals was observed in glasses containing F but in its absence and at high Al2O3 concentration bulk crystallization with two- and one-dimensional growth is observed.
Vidrios del sistema LMAS (Li2O, MgO, Al2O3, SiO2) y que contienen además F, Ca, ZrO2 y TiO2 han sido llevados a cristalización mediante la adición de P2O5. La estabilidad vítrea, capacidad formadora de vidrio y cinética de cristalización han sido estudiadas. Se ha determinado la presencia de cristales de aluminosilicato de litio (LixAlxSi1−xO2), enstatita (MgSi2O6) y β-espodumena (LiAlSi2O6) en los vidrios que contenían F; sin embargo, sin la presencia de este, no se ha podido detectar β-espodumena. Los vidrios que contenían F muestran una dependencia en la energía de activación con el contenido en P2O5, encontrándose valores que oscilaban entre 426kJ/mol y 483kJ/mol, este último, el máximo encontrado para contenidos en P2O5 de hasta un 3%. A altas concentraciones de P2O5 y Al2O3 se observó un aumento de la estabilidad vítrea y de la temperatura de cristalización. Durante la cristalización, el mecanismo más común observado es una cristalización masiva con un número constante de núcleos. Se observó un crecimiento en dos y tres dimensiones en los cristales que contenían F, pero en aquellos preparados sin F y a altas concentraciones de Al2O3, la cristalización masiva con crecimiento uni- y bidimensional se apreció preferentemente.
During last decades, increasing interest in glass ceramic materials (GCM) has been developed in both scientific and technological point of view. These materials present interesting properties such as low thermal expansion coefficient, thermal and chemical stabilities even at high temperatures, biocompatibility, good mechanical resistance, etc. [1,2]. In the technological aspect, GCM are used in conventional or advanced technology fields such as healthcare (dental restoration [3], bone tissue regeneration [4]), domestic uses (glazes for ceramic tiles [5] or digital ceramic inks [6]), armors [7], telecommunications [8], energy generation [9], optical systems [10,11], electronics [12], etc. Up to now, most of the scientific literature is focused in research on the nucleation and crystallization processes as a function of the additives (F, P2O5, TiO2, ZrO2, etc.) [13], thermal schedule [14] or preparation processes [14–16].
GCM cover a vast family of materials which can be prepared with a wide range of chemical compositions depending on their final use [17]. Among all the different systems, Li2O–SiO2 (LS) [18], Li2O–Al2O3–SiO2 (LAS) [19], MgO–Al2O3–SiO2 (MAS) [20] and CaO–MgO–Al2O3–SiO2 (CMAS) [21] are the most widely studied. LS glass ceramics are applied for dental applications due to their interlocked microstructure [2], whereas LAS glass ceramics present excellent thermal shock resistance and low coefficient of thermal expansion (CTE) which in association with their high transparency broadly open their application fields [2]. The good mechanical properties of MAS glass ceramics (because of the crystallization of cordierite and sapphirine) make these materials excellent candidates in conventional and top technologies involving microwave radiation [22,23]. Some other compositions, such the CAS glass ceramics are mostly studied as low temperature co-fired ceramics (LTCC) [24] whereas CMAS glass ceramics can be used as sealants for solid oxide fuel cells [25].
Despite all those possibilities, the majority of GCM systems are mainly based on two or three oxides of the type of SiO2, Li2O, Al2O3, MgO and CaO. However, during last years more complex systems like LMAS and CMAS are gaining scientific and technological interest. In the case of the LMAS system, the approach is based in substituting a given concentration of the Li2CO3 expensive raw material for less expensive oxides and minerals, reaching Li2O/MgO (L/M) ratios varying from 0.02 to 137.5 [26]. Other different oxides like Na2O, K2O, CaO, B2O3 and ZnO can form part of the LMAS system thus rendering different properties. At the same time, different nucleating agents are normally employed being TiO2, ZrO2, F and P2O5 the most frequently used to increase the crystalline phases in this LMAS and other GCM systems. The use of a mixture of the TiO2, ZrO2 and F nucleating agents in the same GCM has demonstrated to present a synergistic effect on the crystallization mechanism of spodumene–willemite–diopside glasses [27]. Similarly, the use of more complex nucleating agents provides important effects in the crystallization and microstructure of CMAS glass-ceramic materials [25]. Due to the complexity in the study of the crystallization mechanisms attributed to the use of these complex nucleating agents in the LMAS system, they have been rarely studied and in the few reports found in the literature, such agents are used in very low concentrations [26,28]. The challenge reported in this work is to achieve a detailed knowledge on the effect of both Al2O3 and P2O5 amounts on the crystallization kinetics of LMAS materials in the presence and in the absence of fluorine as nucleating agent.
Experimental procedureSamples preparationThe starting raw materials were SiO2 (purity >99.0%), Al2O3 (purity >99.5%), TiO2 (purity 99.9%), P2O5 (purity >98.0%), MgCO3 (purity >99.5%), Na2CO3 (purity >99.7%), cryolite (Na3AlF6, purity 98.5%), zirconium silicate (ZrSiO4, purity 98.5%), CaCO3 (purity >99.5%) and Li2CO3 (purity >99.8%). All of them were in the form of fine powders and mixed in different batches of 100g. Then, they were calcined in a platinum crucible at 900°C for 2h and melted in an electric furnace at 1600°C for 3h in air atmosphere. The homogeneous melts were poured onto a preheated metallic plate and allowed to cool to room temperature. To ensure a good homogeneity, the obtained glasses were ground and melted again for 2h. The obtained glasses were annealed immediately at 575°C for 4h and slowly left cool into the furnace to minimize thermal residual stresses. Three glasses were prepared with similar compositions (SiO2, Al2O3, F, etc.) and increasing P2O5 concentration and, an additional glass was prepared without both P2O5 and F in order to analyze the effect of these nucleating agents in the crystallization mechanism.
Methods of characterizationThe chemical compositions of the obtained glasses were determined using an X-ray fluorescence instrument with the analysis curve IQ+ (XRF, Philips, Magic Pro, USA). Crystallization kinetic parameters were analyzed by differential thermal analysis (DTA, TA Instruments, SDT Q600, USA) using glass powders sieved below 50μm and heated from 25 to 1300°C at different heating rates (2, 5, 10 and 20°Cmin−1) in air atmosphere. Triplicated experiments were performed in series to determine the error in the characteristic temperatures. The glasses were crushed and sieved to different particle sizes (50–100, 100–200, 200–500 and 500–1000μm) and an analyzed at 10°Cmin−1 to estimate the dimensionality growth mechanism at each particle size. Pt crucibles filled with 50mg glass sample were used. After crystallization, the developed crystalline phases were examined by X-ray diffraction (XRD, D8 Advance, Bruker Corp., Germany). The morphology of these crystalline phases was examined by field emission scanning electron microscopy (FE-SEM, Hitachi 4700, Japan) operating at 20kV and backscattered electrons. Fractured surfaces were etched with a 3% HF solution for 15s, rinsed with deionized water until removed all HF and then dried at 50°C before observation in the FE-SEM.
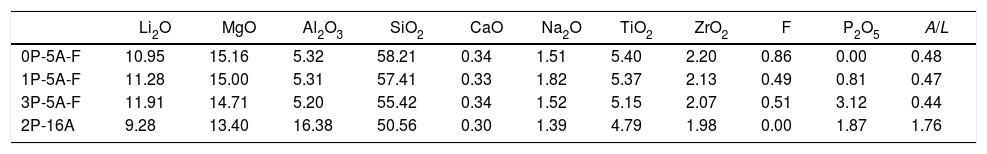
Results and discussionThe obtained glasses were all transparent with a yellowish tonality for low P2O5 concentration that turns to brown for the high P2O5 content. The experimental chemical compositions of these glasses as analyzed by XRF are given in Table 1.
Chemical compositions (mol%) of the prepared glasses (A/L=Al2O3/Li2O).
| Li2O | MgO | Al2O3 | SiO2 | CaO | Na2O | TiO2 | ZrO2 | F | P2O5 | A/L | |
|---|---|---|---|---|---|---|---|---|---|---|---|
| 0P-5A-F | 10.95 | 15.16 | 5.32 | 58.21 | 0.34 | 1.51 | 5.40 | 2.20 | 0.86 | 0.00 | 0.48 |
| 1P-5A-F | 11.28 | 15.00 | 5.31 | 57.41 | 0.33 | 1.82 | 5.37 | 2.13 | 0.49 | 0.81 | 0.47 |
| 3P-5A-F | 11.91 | 14.71 | 5.20 | 55.42 | 0.34 | 1.52 | 5.15 | 2.07 | 0.51 | 3.12 | 0.44 |
| 2P-16A | 9.28 | 13.40 | 16.38 | 50.56 | 0.30 | 1.39 | 4.79 | 1.98 | 0.00 | 1.87 | 1.76 |
Fig. 1 shows the DTA thermograms of the obtained glasses. All the DTA curves exhibit similar trends with a small endothermic signal around 600°C corresponding to the glass transition temperature, Tg. The observed exothermic peaks, labeled Tp in Fig. 1 correspond to the formation of the different crystalline phases. In the temperature range comprised between 1100 and 1300°C, another endothermic signal is also detected and correspond to the melting point, Tm, of the crystals. In regard to the crystallization peaks, it should be noticed that all the samples show the principal peak whose position depends on the chemical composition of the glass. However, for the fluorine containing glasses and those produced with no or with low amounts of P2O5, the main exothermic peak is shown like centered between two small reflections, assigned to pre-nucleation events [29]. When a high P2O5 amount is added, the main peak appears at higher temperature than the two small ones. The described results are perfectly related with the well recognized effect of P2O5 as a crystallization promoter. In the case of the glass without F, the main crystallization peak appears before and at the lowest temperature and just one small right-hand shoulder accompaines this transition.

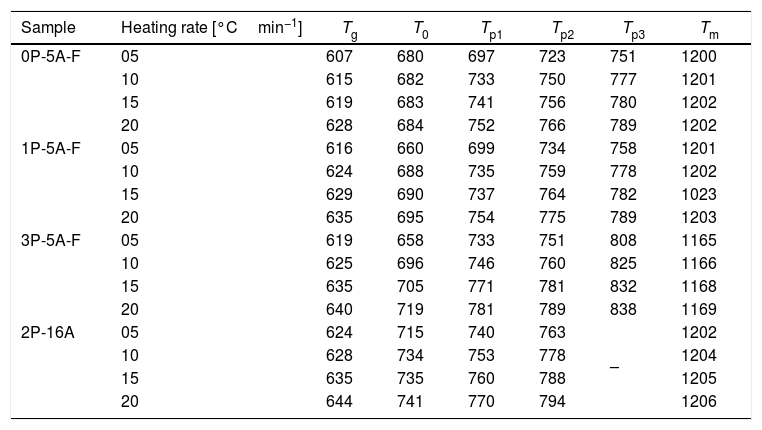
In Fig. 2 it is presented the DTA curves of each glass heated at different rates where we have highlighted the temperature range where the crystallization peaks are observed. The precise crystallization temperatures have been determined by curve fitting deconvolution, assuming that every peak presents a mixed Gaussian–Lorentzian (50–50%) shape. From these fitted peak, the exact positions (temperatures), full-widths (Δw) and intensities are obtained. Table 2 collects the temperatures labeled Tg and Tp and those corresponding to the onset of crystallization, T0.

Characteristic temperatures (°C) from the DTA curves (the error in the determination of Tg, T0, Tp and Tm is estimated to be ±2°C).
| Sample | Heating rate [°Cmin−1] | Tg | T0 | Tp1 | Tp2 | Tp3 | Tm |
|---|---|---|---|---|---|---|---|
| 0P-5A-F | 05 | 607 | 680 | 697 | 723 | 751 | 1200 |
| 10 | 615 | 682 | 733 | 750 | 777 | 1201 | |
| 15 | 619 | 683 | 741 | 756 | 780 | 1202 | |
| 20 | 628 | 684 | 752 | 766 | 789 | 1202 | |
| 1P-5A-F | 05 | 616 | 660 | 699 | 734 | 758 | 1201 |
| 10 | 624 | 688 | 735 | 759 | 778 | 1202 | |
| 15 | 629 | 690 | 737 | 764 | 782 | 1023 | |
| 20 | 635 | 695 | 754 | 775 | 789 | 1203 | |
| 3P-5A-F | 05 | 619 | 658 | 733 | 751 | 808 | 1165 |
| 10 | 625 | 696 | 746 | 760 | 825 | 1166 | |
| 15 | 635 | 705 | 771 | 781 | 832 | 1168 | |
| 20 | 640 | 719 | 781 | 789 | 838 | 1169 | |
| 2P-16A | 05 | 624 | 715 | 740 | 763 | – | 1202 |
| 10 | 628 | 734 | 753 | 778 | 1204 | ||
| 15 | 635 | 735 | 760 | 788 | 1205 | ||
| 20 | 644 | 741 | 770 | 794 | 1206 |
From the results presented in Tables 1 and 2, it can be deduced that when the F nucleant agent is not added into the glass composition, just one peak, sometimes accompained with a small shoulder, appear in the DTA (sample 2P-16A). However, in the presence of F, the thermograms show at least three peaks whose definition is increased because of the addition of both P2O5 and F. Data of Table 2 also show that Tg and Tp increase with the P2O5 content. These results are in line with several works that correlate the increase of Tg and Tp with the addition of P2O5[30,31] or both F and P2O5[32] to MAS and LAS glasses, respectively. In the literature, it is also described that if the concentration of Li2O is higher than MgO, the addition of either P2O5 or F leads to a decrease of Tg and Tp[28,32,33]. Tg and Tp temperatures are indications of the tendency to maintain the glass structure or crystallize.
According to Table 2, the A/L ratio influences Tg and Tp in the sense that if this ratio is less and close to 0.2, the P2O5 acts as a nucleation promoter leading to a decrease of Tg and Tp; by if such ratio is higher than 0.7 P2O5 acts as glass stabilizer increasing these characteristic temperatures [34]. Results in Table 2 show that A/L≥0.2 for all the studied glasses and the effect of a the addition of P2O5 induce a stabilization of the glass network.
An exahustive exploration of the different regions in the DTA curves was also carried out in the next sections to analyze the crystallization mechanism of the LMAS glass-ceramics. In the first region, Tg informs about the structural relaxation occurring in the glass network when the material is subjected to a heating process. In this region the glass structure is relaxed from internal tensions and molecular motion within the glass matrix may occur. The second region corresponds to the temperatures between Tg and Tp and/or Tm. By using these characteristic temperatures, it is possible to obtain information about the glass forming ability and glass stability and the tendency to crystallization of the glass network. Finally, the third region is where Tp appear and informs about the crystallization kinetics of the glass.
Structural relaxation and fragility index (FI)The FI index was firstly proposed by Angell for characterizing the structural relaxation ocurring in a glass network when is heated below its Tg[35]. If the glass presents a resistance to a structural relaxation, it is referred as strong glass, but if such resistance is small it is described a fragile glass. These differences appear if Tg values present an Arrhenius temperature dependence with the viscosity. It is commonly accepted that an Arrhenius temperature dependence with its viscosity is exhibited by the so-called strong glasses.
This index, FI, is considered a kinetic property since it is related to the variation of the glass viscosity near Tg so the determination of, FI must be ideally performed through viscosity measurements. Nevertheless, these type of measurements are in general extremely difficult when the inorganic glasses present strong crystallization tendencies or high melting temperatures [36]. An elegant approach to overcome this issue is the employment of indirect methods based in differential thermal analyses [37–39]. Among these methods, probably the most used one is the Kissinger method that can be expressed as in equation [38]:
where v is the DTA heating rate, Eg is the activation energy of glass transition which takes into account the molecular motion and rearrangement of atoms around Tg, R is the universal gas constant and C is also a constant.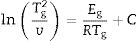
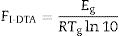
The FI index calculated from the DTA measurements (FI-DTA) can now be expressed as a function of both Eg and Tg according to [40,41]:
The reported values of FI varies widely within the range comprised between FI=14.97 for strong glasses and FI=200 for fragile glasses[42]. It should be advised there that the use of Eq. (1) together with the DTA data instead of using the viscosity measurements could lead in some errors in the determination of the correct FI values. However, Zheng et al. [43] demonstrated that the differences between the Tg values as obtained by either one or the other technique are completely equivalents just by taking into account that the Tg data obtained by DTA can be used if the following equation is employed:
where FI-vis is the correct fragility (FI=FI-vis) determined from viscosity measurements and FI-0 is the reference fragility corresponding to a pefect strong glass which exhibits an Arrhenius behavior (FI-0=14.97).
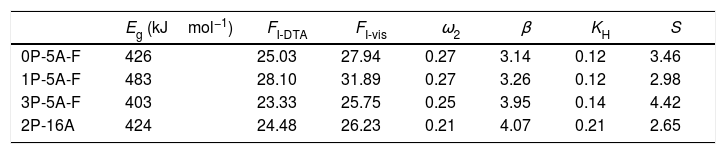
The calculation of the Eg values from Eq. (1) is carried out by fitting the data shown in Fig. 3 to a straight line, being the results collected in Table 3. Eg values are in the range of silicate glasses with an Al2O3 molar concentrations varying between 0% and 20% [43,44]. From the calculated Eg values, the FI-DTA and FI-vis indexes are obtained by using Eqs. (2) and (3). As observed in Table 3, the FI values of the studied glasses are higher than the values reported for vitreous silica which is close to 19 [36,45]. As observed in Table 3, the higher the Eg the higher FI, and also, the obtained glasses can be considered as strong glasses since all FI values are higher than the silica glass (FI=19).
 vs 1000/Tg plots and activation energies of viscoglass in the different glasses transition range.")
GS and GFA parameters (FI-vis calculated form Eq. (3), ω2, β, KH and S calculated as an average for the four heating rates).
| Eg (kJmol−1) | FI-DTA | FI-vis | ω2 | β | KH | S | |
|---|---|---|---|---|---|---|---|
| 0P-5A-F | 426 | 25.03 | 27.94 | 0.27 | 3.14 | 0.12 | 3.46 |
| 1P-5A-F | 483 | 28.10 | 31.89 | 0.27 | 3.26 | 0.12 | 2.98 |
| 3P-5A-F | 403 | 23.33 | 25.75 | 0.25 | 3.95 | 0.14 | 4.42 |
| 2P-16A | 424 | 24.48 | 26.23 | 0.21 | 4.07 | 0.21 | 2.65 |
It is also observed that Eg and FI increase only with the addition of a small amount of P2O5 (0.81mol%) to the glass composition but if more P2O5 is added Eg and FI decrease. Variations of Eg and FI can be explained on the basis of structural changes due to the introduction of phosphorus atoms. Although P2O5 generally acts as a nucleation agent to induce crystallization in silicoaluminate glasses containing Li, Mg, etc., it is also known that such effect strongly depends upon the A/L ratio [34]. For A/L<0.2, P2O5 acts as a nucleating agent leading to an easy bulk crystallization and therefore the glass tends to be fragile whereas, if A/L>0.7 P2O5 acts as a glass structure stabilizer improving the rigidity of the glass network, i.e. leading to a stronger glass. According to the chemical compositions provided in Table 2 and results of Tables 3 and 4, the studied glasses containing F present A/L ratios between 0.2 and 0.7 but they can be considered as strong glasses because their FI values are closer to 19 than to 200. However, these results present some discrepancies because of the random variation with the P2O2 and Al2O3 content in the glasses. In order to discern these variations, the glass stability parameters are then further considered.
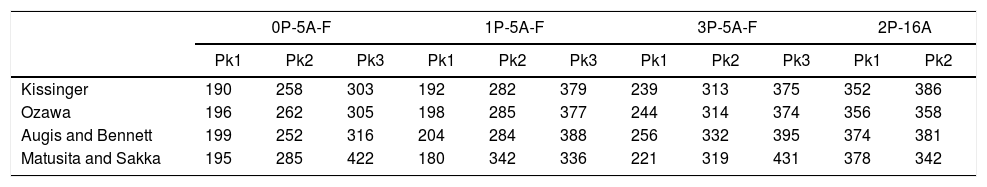
Activation energies (kJmol−1) of each exothermic peak (Pk) for the studied glasses.
| 0P-5A-F | 1P-5A-F | 3P-5A-F | 2P-16A | ||||||||
|---|---|---|---|---|---|---|---|---|---|---|---|
| Pk1 | Pk2 | Pk3 | Pk1 | Pk2 | Pk3 | Pk1 | Pk2 | Pk3 | Pk1 | Pk2 | |
| Kissinger | 190 | 258 | 303 | 192 | 282 | 379 | 239 | 313 | 375 | 352 | 386 |
| Ozawa | 196 | 262 | 305 | 198 | 285 | 377 | 244 | 314 | 374 | 356 | 358 |
| Augis and Bennett | 199 | 252 | 316 | 204 | 284 | 388 | 256 | 332 | 395 | 374 | 381 |
| Matusita and Sakka | 195 | 285 | 422 | 180 | 342 | 336 | 221 | 319 | 431 | 378 | 342 |
The glass forming ability (GFA) is a parameter that indicates the facility of a melt to form a glass when is cooled and, therefore, it expresses the stability of a glass and its resistance to crystallization during cooling. At the same time, the glass stability (GS) expresses the resistance to crystallization when a cooled glass is heat-treated at increasing temperatures [35]. While GFA is related to melt glass cooling, GS is related to solid glass heating; although both parameters are related concepts, they are not equivalent [46] and present a strong correlation [47]. To study these parameters, we will use the region of the DTA curve between Tg and Tm. If the glass tends to devitrificate upon heating, new crystallization peaks will appear so, this region will provide the most valuable information about the glass stability.
In the literature, there are several equations that can be used for calculating GFA which principally differ in the use two or three characteristic temperatures of the DTA curve. Moreover, different works aimed to determine what are the best approaches, but the general conclusion is that it is not possible to select only one equation that would be valid for all glass materials, although it seems that those equations that use three characteristic points present higher correlation with GFA. In this sense, we have selected the equations described by Zhang et al. [48] and Yuan et al. [49] who defined the parameters ω2 and β (Eqs. (4) and (5), respectively) because in most of the analysis they have shown much more sensitivity to changes in T0/Tg and Tm/Tg temperature ratios:
where T0 and Tl are the onset crystallization and liquidus temperatures, respectively.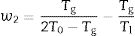

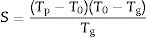
Similarly, GS is mainly related to the differences between Tg and Tp and, although several equations have been proposed, Marques and Cabral [50] have shown that all of them can be used to accurate determine the GS in different glasses. One of these methods in that proposed by Hruby which, besides Tg and Tp it takes also into account Tm[51]. The Hruby parameter, KH, is defined as:
where Tm is the melting temperature. When using the Hruby equation, it is considered that GS increases with KH. Similarly, another equation proposed by Saad and Poulain (S) reflected the resistance to devitrification of a glass when it's heated [52]:
In Table 3 we have collected the ω2, β, KH and S values obtained for the LMAS glasses studied in this work and calculated as the averaged value for the four heating rates.
According to Marques and Cabral [50], some GS parameters are well correlated to the GFA, nevertheless they can express a different behavior: some of them, β, KH and S are directly proportional to the GFA, while ω2 is inversely proportional to GFA. The results recorded in Table 3 show that the addition of P2O5 to the LMAS glasses leads to an increase in β, KH and a decrease in ω2, which is translated is an increase in the GFA and GS of the glasses. The absence of F and the higher Al2O3 content in the 2P-16A glass confers to this glass the major stability.
It is also noticed that the S values do not follow any trend like the other three parameters so we cannot extract any correlation or conclusion. This problem may arise because the S parameter takes into account both the Tp values and the corresponding differences between Tp and T0, and the studied glasses present several crystallization peaks so, it is difficult to analyze. Since at low heating rates, the peaks are mostly well ressolved, we performed these calculations by solely using Tp2 values of Table 2 at the 5°Cmin−1 heating rate, being 3.66, 3.70, 4.07 and 4.87 the obtained S values for the 0P-5A-F, 1P-5A-F, 3P-5A-F and 2P-16 glasses, respectively. This is then translated as an increase in GS like the other parameters have shown. We think that the behavior of the S parameter still needs a toughtful study for the different glasses and also in a wider range of compositions where several crystallization peaks appear.
Crystallization kinetic mechanismThe DTA curves have been used to determine the crystallization mechanisms and the activation energies (Ec) for crystal growth through the analysis of the exothermic peaks at different heating rates. All kinetic analysis models of non-isothermal DTA data are based on the Johnson–Mehl–Avrami–Kolmogorov relation (JMAK):
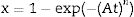
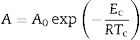
where x is the crystallized fraction volume, N is related to the number density of nuclei with a crystalline phase factor, U is the growth rate, m is the growth morphology index, which depends on the dimensionality of the crystal growth, t is the time and n is the Avrami exponent. In most of cases m=n and then Eq. (8) can be written as Eq. (9)where n now depends on both the growth mechanism and the dimensionality of the crystal and A is the Arrhenian pre-exponential factor depending on the temperature:where A0 is the frequency factor and Ec is the activation energy for the whole process, i.e. it takes into account the nucleation and growth processes and, in some cases the activation energies of different crystalline phases crystallizing at similar temperatures.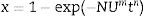
The parameters m and n can take various values: for surface crystallization n=m=1, for bulk crystallization with a constant number of nuclei independent of temperature n=m and, for bulk crystallization with an increasing number of nuclei inversely proportional to the heating rate n=m+1 [53]. In these later cases of bulk crystallization m can take values of 3, 2 or 1 if the dominating growth mechanism of the crystals is three-dimensional, two-dimensional or one-dimensional, respectively.
In order to determine the activation energies for crystallization and the corresponding mechanism, the first kinetics model we are using was developed Kissinger [38,54] who established that the activation energy, Eck, can be obtained from the heating rate dependence of the crystallization peak temperature according to the equation:
where v is the DTA heating rate. Kissinger plots for the different studied glasses at heating rates of 5, 10, 15 and 20°Cmin−1 are shown in Fig. 4, and the corresponding Eck values are given in Table 4. As it has been mentioned before, the peak temperature has been determined by deconvoluting the DTA curve into two or three Gaussian peaks.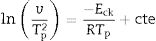
 vs 1000/Tp plot): 0P-5A-F (a), 2P-16A (b) and (c) for all different glasses at the temperature of main peak.")
In a similar fashion, Ozawa [55,56] proposed a modified form of the Kissinger's equation. According to Ozawa model, the change of ln(1/Tp2) with v is negligibly small compared to the change of ln(v) and therefore, the Kissinger's equation must be written as:
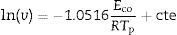
Fig. 5 shows ln(v) vs 1000/Tp plot and the value of Eco can be obtained from the slope of the straight line according to Eq. (12).
 vs 1000/Tp: (a) for 1P-5A-F, (b) for 2P-16A and (c) for temperature of main peak of the different glasses.")
To further confirm the accuracy of the above results for activation energy values, Augis and Bennett [57] developed a more exact method for determining crystallization parameters:
where the differences between Tp and T0 are taken into account [58]. Fig. 6 shows the plot ln(v/(Tp−T0)) vs 1000/Tp from which the Ecab has been obtained.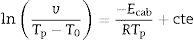
) vs 1000/Tp. 3P-5A-F (a), 2P-16A (b), and for the different glasses at the temperature of main peak (c).")
Once the Ecab is known, the Augis and Bennett method [57] permits the determination of the Avrami parameter n:
where Δw is the full-width of the exothermic peak at half-maximum intensity. As evidenced in Eq. (13), higher Δw values result in smaller n values, and vice versa.
Matusita and Sakka [59] deduced that Eq. (11) was only valid if the crystal growth occurs over a fixed number of nuclei and suggested a modified form of the Kissinger equation which can be written as:
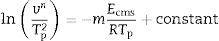
As it can be observed, this equation takes into consideration the two parameters, n and m, which characterize the crystallization growth mechanism and the activation energy. In Eq. (15), it is assumed that n and Ecms are constants for a given material but Marques et al. [60] have shown that n and Ec vary with the particle size. They also demonstrated that for small particles (<105μm and 105–355μm) both values present a little variations and, thus the above referred equation is suitable for our work since in all the cases, the particle size is maintained below 50μm. The values of Ec for crystallization calculated by different methods, the values of Avrami exponent n and the m parameter are given in Tables 4 and 5 and Fig. 7.
n and m parameters for the studied glasses. Pk1, Pk2 and Pk3 indicate each one of the peaks detected in the thermograms.
| 0P-5A-F | 1P-5A-F | 3P-5A-F | 2P-16A | |||||||||
|---|---|---|---|---|---|---|---|---|---|---|---|---|
| Pk1 | Pk2 | Pk3 | Pk1 | Pk2 | Pk3 | Pk1 | Pk2 | Pk3 | Pk1 | Pk2 | ||
| Augis and Bennett | n | 2.9 | 4.2 | 1.4 | 2.7 | 3.5 | 1.7 | 1.8 | 2.9 | 2.2 | 2.1 | 0.9 |
| Matusita and Sakka | m | 2.9 | 4.5 | 1.3 | 2.6 | 3.6 | 1.7 | 1.7 | 2.9 | 2.2 | 2.0 | 0.8 |
 vs 1000/Tp. 0P-5A-F (a), 2P-16A (b), and for the different glasses at the temperature of main peak (c).")
In addition to that, Xu et al. [61] reported that for most oxide-glass systems Ec and Eck are related through the equation:

Here, when m=n, crystallization occurs on a fixed number of nuclei and Eck=Ec. Thus, for crystal growth that occurs on a fixed number of nuclei, the analysis of DTA data by the Kissinger model, Eq. (11) yields the correct value of Ec. When the number of nuclei changes during the DTA measurements, we have the option to use Eq. (14) or we can determine Eck from Eq. (11) and then multiply this term by n/m to obtain the correct activation energy.
As mentioned before, the DTA curves present two or three peaks so, the Ec and n and m values can be calculated in each peak. The differences in the Ec values determined by different methods may be attributed to the different approximations that have been adopted while arriving at the final values from them, but, in most cases, the results are very close and the discussion of the crystallization kinetics can be carried out by taking the average values of each parameter. The activation energies of Table 4 are in the range of 200–400kJmol−1 as correspond to a LAS or MAS glass ceramic material [62]. From the data of Table 4 it is clear that for the glasses with 5% of Al2O3Ec values increase with Tp indicating that it is necessary higher temperatures to induce crystal growth. However, in the glass with 16% of Al2O3 and although the two crystallization peaks appear at temperatures close to the low temperature peaks of the other glasses with lower Al2O3 concentration, the Ec values for such two crystallization peaks are very close the one of the high temperature peak of low Al2O3 glasses. We attribute this result to the effect of Al2O3 limiting the mobility of the crystal forming cations [63].
The effect of P2O5 on the crystallization kinetics of LAS and MAS glasses has been extensively studied [28,63,64]. P2O5 is considered as a crystallization promoter due to its nucleating role; however it has recently shown that such role depends on the composition of the parent glass. If K2O and Al2O3 are replaced by P2O5, the activation energy for the crystallization decreases [63]. A similar effect that is observed if P2O5 is added to a glass with an A/L ratio lower than 0.4, however, if the A/L ratio is higher than 0.7 then P2O5 acts as a glass structure stabilizer due to the formation of POAl complexes that prevent the formation of the heterogeneities that inhibits glass crystallization [34]. Results in Table 4 indicate that for the LMAS glasses containing 5% of Al2O3 (with Al/L around to 0.47) the addition of 1% and 3% of P2O5 leads to an increase in Ec, a result that indicates that P2O5 restrains the crystallization of the LMAS glass. Similarly, in the 2P-16A glass with A/L=1.76, the high Al2O3 concentration and the addition of 2% of P2O5 also mitigates the glass crystallization and then the Ec values are the highest among all the studied glasses.
With respect to the n and m parameters, Table 5 shows that both parameters have the same values and, therefore, in accordance to Donald [53] and Matusita and Sakka [59] the crystallization mechanism is mainly of bulk type with a constant number of nuclei, although the specific values depends on the amount of F, P2O5 and Al2O3 in the glass. The main difference appears whit the presence of F and, it is observed that those glasses containing F present a different behavior than the one without it (2P-16A). For the F containing glasses the addition of P2O5 leads to a decrease of the n and m values for the first and second peaks, while for the third peak n and m increase. This result indicates that the incorporation of P2O5 leads to a homogeneous crystallization mechanism for the three peaks and mainly with two- and three-dimensional growth of crystals. On the other hand, for the 2P-16A glass without F the n and m values correspond to bulk crystallization with two- and one-dimensional growth of crystals.
In order to confirm the dimensionality growth mechanism, Ray and Day proposed a simple and rapid method to identify and distinguish surface from bulk crystallization [65]. This method consists on analyzing the Tp and Tp2/Δw as a function of the particle size. Because as particle size increases the surface to volume ratio decreases, if surface crystallization is the dominant mechanism, then Tp and Tp2/Δw will decrease and, on the contrary, for bulk crystallization they will increase. DTA plots for glass samples 0P-5A-F, 1P-5A-F, 3P-5A-F and 2P-16A of different particle size (50–100, 100–200, 200–500 and 500–1000) are shown in Fig. 8. In all the glasses, it is observed the same crystallization peaks, but, in the case of the 0P-5A-F, 3P-5A-F glasses, a new peak appears at temperatures of 760 and 820°C, respectively. The kinetic mechanism of this new peak was not subjected to the analysis described above but it is clear that it increases in intensity with the particle size indicating that the crystallization mechanisms is of bulk type. The rest of the crystallization peaks for these and other samples have been analyzed by the method described by Ray and Day. Fig. 9 presents the evolution of the Tp2/Δw for the main representative peaks of each glass. It is observed that the evolution of Tp2/Δw with the particle size varies from one glass to another and, in the case of the 3P-5A-F that presents two main peaks both give different evolution. In this 3P-5A-F glass while the peak at 760°C shows a decrease Tp2/Δw with the particle size, the one at 825°C shows an increase. In general it could be said that the evolution of Tp2/Δw with the particle size is an appropriate method for obtaining a conclusion about the crystallization mechanism or for discriminating between surface and bulk crystallization types. This result has just been described by Marques et al. when analyzing the crystallization of lithium disilicate glasses [60].


Fig. 10 shows the XRD patterns for the different studied glass-ceramics after heat treating at 860°C, i.e. when all the DTA peaks have appeared. In all cases, a high degree of crystallization is observed. As expected, the main signals are attributed to a Lithium Aluminum Silicate (LixAlxSi1−xO2, JCPDS 00-040-0073), and some other small peaks attributed to Enstatite (MgSi2O6, JCPDS 00-022-0714) and β-spodumene (LiAlSi2O6, JCPDS 00-035-0797) also appeared in the samples containing F, i.e. 0P-5A-F, 1P-5A-F and 3P-5A-F. In all the cases and under identical experimental conditions, the intensity of the major diffraction peaks, LixAlxSi1−xO2, increases with the P2O5 concentration, a result that indicates the influence of this nucleant agent in the crystallization reactions In the diffractogram of the sample 2P-16A without F and a high concentration of Al2O3 no traces of crystallization of β-spodumene was found. In accordance to these data, and from the results presented in Table 2 and Figs. 1 and 2, three exothermic crystallization peaks were found in the thermograms of the glasses with F which is in line with the three crystalline phases appearing in the XRD of Fig. 10. In the glass without F just two peaks were found in the thermogram and just two crystalline phases emerged in the XRD diffractograms. Thus, it must be assumed that each peak corresponds to a given crystalline phase. Further analysis of these results will be explored in a next work by using other characterization techniques such as Raman and IR spectroscopies.

SEM micrographs of the heat treated glasses are shown in Fig. 11. Here it is observed the presence some crystals with a globular shape. Similar results have been found in different works [26,66] that assigned the tiny globular particles to the LixAlxSi1−xO2 crystals. It is observed that the sizes of these particles increase with the P2O5 content in the glass and reaching sizes higher than 500nm. In the case of the 2P-16A glass ceramic (Fig. 11) the obtained microstructure is very similar to the one showed by Guo et al. [67] for a LAS glass-ceramic containing F, where the sizes were in the range of 50–100nm. In all cases the crystallization is of bulk type, according to the n and m values of Table 5 and as it has been discussed throughout the work.
Conclusions
Several glasses in the LMAS (Li2O, MgO, Al2O3, SiO2) system with F, CaO, ZrO2 and TiO2 in their compositions have been prepared by melting at high temperatures. Glass stabilities and crystallization mechanisms have been analyzed by DTA as a function of P2O5 concentration and Al2O3/Li2O ratio. These glasses crystallize in Lithium Aluminum Silicate (LixAlxSi1−xO2), Enstatite (MgSi2O6) and β-spodumene (LiAlSi2O6) when F is in their composition, whereas β-spodumene does not appear if F is not present. These crystals appear as particles of globular shape whose sizes increase with the P2O5 content in the glass reaching values higher than 500nm. The addition of F and P2O5 give an increase in the glass transformation and crystallization temperatures. Because the A/L ratio is higher than 0.2 in all cases the addition of P2O5 produces a stabilization of the glass network, a similar effect that appears if the glass presents a high Al2O3 concentration. The activation energies for crystallization are in the range of 400–500kJmol−1 as correspond to LAS and MAS glass ceramic materials. The obtained results indicate that for glasses containing 5% of Al2O3 (with Al/L around to 0.47) the addition of 1% and 3% of P2O5 lead to an increase in Ec, a result that indicates that in this study the P2O5 restrains the crystallization of the LMAS glass. In the case of the glass with A/L=1.76 the high Al2O3 concentration and the addition of 2% of P2O5 mitigates the activation energy for glass crystallization. The incorporation of P2O5 or the high Al2O3 concentration increases the glass stability. The crystallization mechanism is mainly of bulk type with a constant number of nuclei, although and it depends on the amount of both Al2O3 and P2O5 in the glass. For the glass without F and high Al2O3 concentration the crystallization presents a one and two-dimensional growth of crystals, however for those glasses containing F the growth is two- and three-dimensional. The incorporation of P2O5 in the glass composition leads to a homogeneously crystallization mechanism.
The present work was supported by the Algerian Ministry of Higher Education and Scientific Research (Algerian program P.N.E 2016–2017 scholarship fund) and with the collaboration of the Institute of Ceramic and Glass ICV-CSIC, Madrid, Spain. This work was developed under the frame of the project MAT2016-78700-R.

